


Immediate responses to the heatwave
- France requested aid from the European Union to deal with the effects.
- Public water supply shortages occurred in several countries, including the UK and Croatia, which led to a temporary ban on using hose pipes.
- TV news, internet and newspapers informed the public on how to cope with the heat — drinking plenty of water, wearing cool clothing, and staying in the shade in the middle of the day.
- Network Rail in the UK imposed speed restrictions for trains when the temperature was above 30 °C. This was to help avoid trains derailing when railway lines might have buckled
- Workers around Europe altered their working hours. Some refuse collectors started earlier to pick up rapidly decomposing rubbish from the streets.
What happened to cause the heatwave?
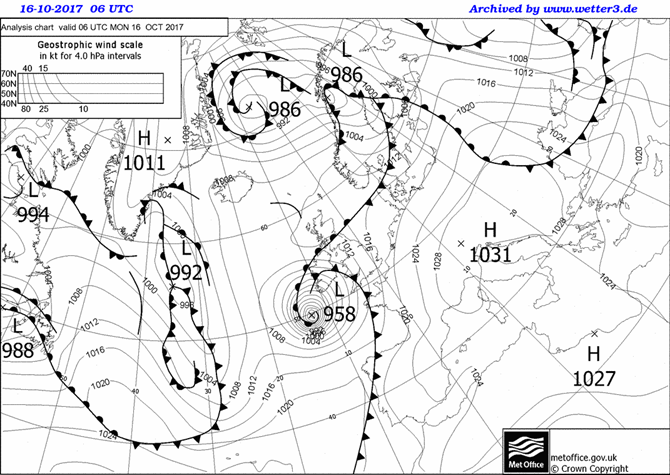
Weather chart
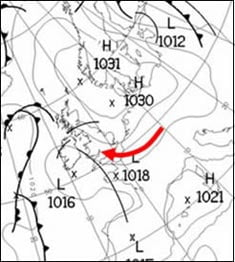
It shows an area of high pressure over most of Western Europe. Air is moving around the high in a clockwise direction, bringing a hot, dry tropical continental air mass to the UK at this time. This pattern occurred for much of the rest of the month. High pressure areas usually bring little cloud and warm conditions in summer.
You can find out more about weather charts in the weather section of the Met Office website.
Satellite imagery
The satellite images below confirm there is very little cloud over most of Europe.
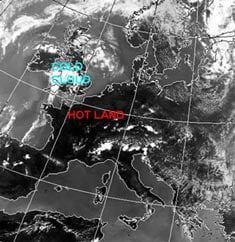
Fig. 3 shows a visible satellite image of north-west Europe at 2 p.m. on 5 August. Visible satellites show what you would see if you were in space looking down at Earth. White areas show were there is cloud, the brighter the shading the deeper the cloud. The dark areas show cloud free areas. On Figure 12, the darker areas over most of Europe show the area has thin or little cloud.
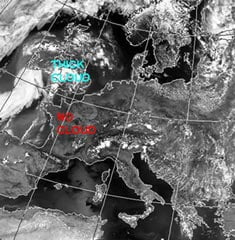
Fig. 4 shows an infrared satellite image for north-west Europe at 2 p.m. on 5 August. Infrared satellite images measure the temperature of the cloud or ground surface. The dark areas show surfaces that are warm and where there is no cloud. The whiter shading indicates cold cloud. The darker the shading of the land, the hotter it is.


 It was reported in The Times newspaper on 15 April 1986 that a hailstorm lashing Dhaka, the capital of Bangladesh, had killed nearly 50 people and injured more than 400. The storm had brought winds of about 60 mph and hailstones weighing up to 2 lb (nearly 1 kg). Houses had been flattened, communications disrupted and the windscreens of more than 700 cars shattered. In such conditions, an umbrella was no use whatsoever; even a riot shield may not have provided adequate protection! According to Dick File, in Weather Facts (Oxford University Press, 1991), this storm (which struck on 14 April 1986) killed 92 people and produced hailstones that weighed 1.02 kg.


