Categories
CPD Extreme weather Weather

5 Weather Websites to Keep an Eye on

Here are 5 (ish) websites which anyone teaching about weather may find useful: 


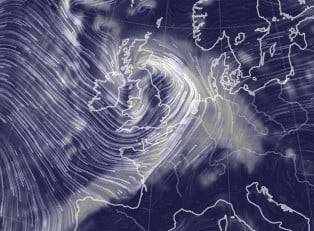
Earth.nullschool.net for current and past atmospheric and oceanic conditions

Met Office weather warnings

Met Office synoptic charts

Blitzortung for live, global lightning 

NASA for live, global rainfall 

NetWeather for radar images, will it snow and some satellite images

Zoom Earth for satellite images

Categories
Climate Climate Change Weather

Weather, Climate and Climate Change

This is probably one of our favourite short explainer type videos that we use when delivering teacher CPD and when talking to students. It uses the analogy of a dog and its owner to represent the relationship between weather and climate, and can be really helpful!   You can find classroom resources and further support materials for teachers in our Weather and Climate: a Teachers’ Guide chapter on weather and climate.
Categories
Climate CPD Teaching Weather

Resource Wins GA Silver Award

Rob Gamesby collects GA silver award

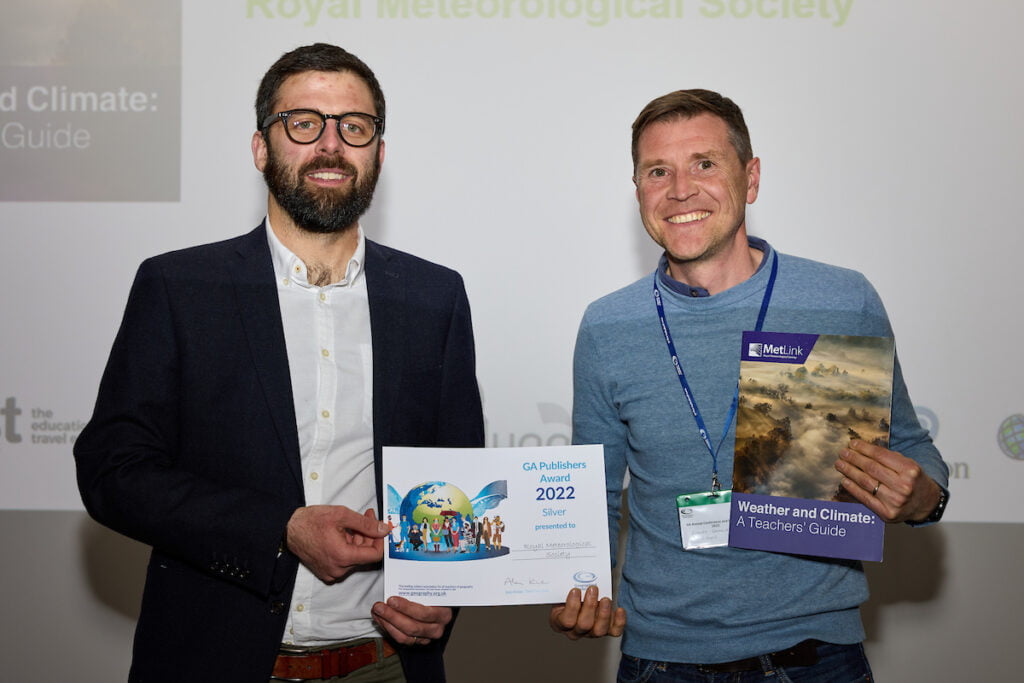
We were delighted that our Weather and Climate Teachers’ Guide/ scheme of work for 11-14 geography was awarded a ‘silver’ by the Geographical Association at their conference in April.

“This excellent – and free – resource, accompanied by differentiated PowerPoints, is well-structured, informative, and fits some complex weather and climate topics into a digestible format. The judges felt it is an accessible resource that provides support for subject specialist and non-specialist teachers alike. They liked the examples that the authors used and the way it makes connections from one lesson to another, building the learning along the way.”

Photo credit: Geographical Association/Shaun Flannery 2022

Categories
Secondary Weather

Tropical Continental Air Mass and Saharan Dust

This morning, skies were orange/ beige across much of England as a Tropical continental (Tc) air mass brought Saharan dust. 

Saharan Dust on Windscreen

Image credit: Geoff Jenkins

Read more about why the air was carrying so much dust, and see some stunning photos from Spain and France here. The further the air travelled, the more dust was deposited and the less dust remained in the air – so the most vivid skies were in the south. 

Read our guide to air masses for background information or show our YouTube explainer

weather chart 16th March 2022

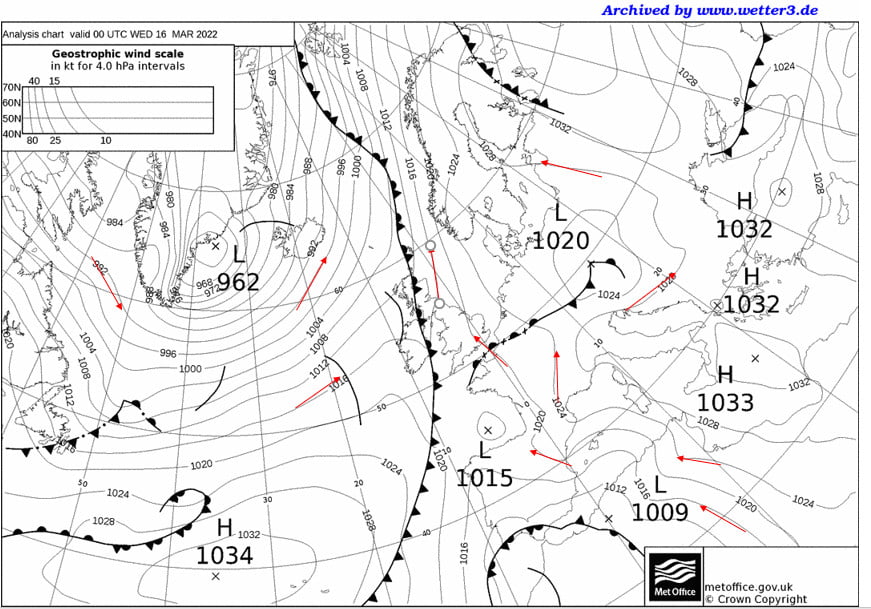
How can you tell that there is Tc air from this weather chart (midnight on 16th March 2022)? 

The air approximately follows the isobars, shown as thin lines on this chart. To work out which way, you need to look at the pressure systems and remember that air goes clockwise around anticyclones (H) and anticlockwise around cyclones (L). 

Considering either the 962mbar Low or the 1033mbar High shows you that the air is coming from the south (a southerly wind) across England.

Following the isobar marked 1020 back, you can see that the air has come over Spain from Africa. This is a Tropical continental air mass.

Behind the occluded front, for much of Ireland, the wind coming from the west. The 1020mbar Low is a bit misleading, but you can see that the air coming up from the south diverts to curve round it in an anticlockwise flow. 

Tc weather chart
Categories
Extreme weather Geography Secondary Weather

Storm Eunice and Generic Case Study Template

Storm Eunice cloud and wind

We have created a new worksheet which allows students to collect information and create a case study of a named UK storm. As part of the worksheet, students collect and annotate weather chart and other information about the storm including weather warnings. 

Storm Eunice is given as a worked example. 

Categories
Books Primary Schools Weather

My First Book of Weather

My First Book of Weather

This beautifully illustrated children’s book is full of fantastic facts about weather, climate and the world around us. It would be a wonderful gift for primary school aged children, with plenty of engaging pictures to keep infants interested as well as lots of interesting facts and trivia to interest junior children. The author, Camilla de la Bedoyere, has written more than 200 books for children and adults, many of which explore the natural world. Cinyee Chiu, the illustrator, believes in a sustainable lifestyle and is interested in projects about environmental/climate issues.

Covering a wide range of subjects, the author and illustrator take us on a tour to discover: ‘what is weather?’ and ‘how does the weather change?’, including how forecasts and charts are made. The book also tells us about Earth’s past climate, wild weather, extremes and climate change. It covers an amazingly large range of topics and both children and adults will likely learn plenty of new information about weather and climate from reading this book together.

As you would expect, the book starts with a gentle introduction to the atmosphere, the Sun and the wind, but it soon goes beyond the more basic kids’ weather books as it shows examples of how wind is measured with the Beaufort Scale. The water cycle and formation of clouds is shown with accurate representations of the different types of cloud. In the section on how the weather changes, it starts with a selection of nature’s weather warnings, where I learnt a new and interesting fact about how crickets chirrup faster and louder as the temperature rises! This is nicely followed by an overview of how storms develop and how we forecast the weather. The only thing that is missing from this section is some time spent in the book talking about supercomputers and the importance of number crunching, which is somewhat glossed over. However, unlike other children’s books about weather, it is nice that this book includes information about weather charts and weather records. There is a large section on world weather, which spans from Earth’s past climate (both hot and cold) to climates and seasons, making links to migrations and the impacts of weather and climate on people. A weather book would not be complete without sections on wild weather, from hurricanes and tornadoes to extreme and strange weather, which is covered very well by this author and illustrator. Finally, climate change has a prominent place in this excellent book, with a focus on renewable energy and how it is generated.

The illustrations in this book are beautiful and the content very engaging and interesting, giving the perfect combination to keep children and adults interested from front to back cover. Dr Sylvia Knight (RMetS) was consulted during the writing of the book, so we can feel confident that the content is accurate. I would definitely recommend this book for primary age school children – a great gift and lovely to read with them as an adult too!

My First Book of Weather, Bedoyere, Camilla (Author) &  Chiu, Cinyee (Illustrator) Templar Publishing, 2021 Hardback £12.99, 64 pp ISBN 978-1-787418-50-9  
 
Reviewed by Jenny Rourke for Weather, July 2021
Categories
Geography Schools Secondary Teaching Weather

New Films: Air Masses and the ITCZ

We have made two new explainer films which can be seen on YouTube:

An Introduction to Air Masses

All About the InterTropical Convergence Zone (ITCZ)

 
global rainfall patterns
Categories
Blog Geography Secondary Teaching Weather

Air Masses

In this article we explore air masses – the idea that, by looking at where our wind is blowing from, and what has happened to the air in the wind on its way to use, we can begin to understand why we’re getting some particular weather.

We live on an island, and the weather can come at us from any direction, although in practice, it comes from some directions more than others  – this wind rose shows the direction the wind was recorded coming from at Heathrow airport, near London. The longer the bar, the more often the wind came from that direction, so you can see that our wind comes from between southwest and west most often.  

Lets take a step back and remember that warm air rises – whether that’s the air being heated in a hot air balloon or the air above a radiator (watch a simple demonstration).

What happens to the rising air? As it rises it cools. Cloud and rain are caused by warm air rising, warm air rising is called convection (watch a simple demonstration).

You can often see convection going on in the atmosphere – you get puffy cumulus clouds, with flattish bases and puffy tops where the cloud is bubbling up.

clouds

More generally, Clouds form when there is more condensation going on than evaporation in the atmosphere.

The colder it is, the less evaporation happens – so cloud forms when the air cools.

This isn’t just when warm air rises.

Now we can think about air masses, they are classified according to where they have come from, and what they have passed over:

UK air masses

One air mass generally covers the whole country.

However, it can bring different weather conditions to different places. For example, Tropical continental air can carry Saharan dust, but it mostly falls on the south of the UK – there isn’t much left in the air by the time it reaches Scotland.

Lets consider Polar maritime (Pm) air first (click on the map to start the animation):

Polar maritime air comes towards us from further North in the Atlantic. It starts cold, but is slowly warmed by the ocean below as it travels over progressively warmer water. It also picks up moisture from the ocean. 

As it is warmed, it becomes more unstable and inclined to rise, leading to convection and puffy Cumulus clouds, mainly over the ocean. As the air hits land (the western coast of Ireland, Wales, Scotland and England) the air, which was already inclined to rise, is forced up a bit more – forming more cloud, and giving rise to rainfall. 

Polar maritime air, our dominant air mass, brings cloud and rain to the west of the UK and relatively dry air to the east. 

This satellite image is typical of Pm air – you can see the puffy cumulus clouds over the ocean, and the belt of cloud over the western side of the country.  

Returning Polar maritime air (rPm) is air which is Polar in origin but which swings round to hit the UK from the west or even slightly south of west – but if you were to follow its path back, you would see that it was Polar. 

Arctic maritime (Am) air is extreme Polar maritime air, coming down to the UK straight from the north, over the Arctic ocean. It tends to bring wintry weather to Scotland and isolated snowy showers further south, triggered by air rising over the local orography. 

Polar Continental (Pc) air will also be cold to start with and get progressively warmer as it moves south, so you would also expect convection. However, the air will be very dry as it passes over continental Europe, so little cloud will form. The UK is a set of islands though and to reach us, the air must pass over the North Sea, picking up water vapour as it does so. The cloud and precipitation (typically snow in winter) it brings therefore primarily affect the east coast. The longer the path it takes over the North Sea, the more precipitation there will be. 

This satellite image is typical for Pc air – you can see the cloud free areas immediately to the west of the land masses, with cloud forming further east (ignore the front to the west of the UK and Ireland).

Of course, the characteristics of the air masses can be very different in the summer and the winter. Siberia, for example, is extremely cold in winter but relatively warm in summer – so a polar continental air mass can bring us bitterly cold weather and heavy snowfall (for eastern counties) in the winter, but much warmer weather in the summer.

The processes at work in Tropical Maritime (Tm) air are a bit different. This is warm air, which is being cooled from below as it moves north. You therefore wouldn’t expect any convection with air rising, cooling and forming cloud. However, the air is being cooled just by moving north and so eventually may reach the temperature at which cloud forms – flat, featureless sheets of stratus cloud because, on the whole, the air is staying at the same level.

As it is maritime air, there is plenty of water vapour available to form cloud droplets. The processes which give us big, fat raindrops are mainly associated with the vertical air motion and circulations in cumulus clouds. So Tm air at best gives a persistent drizzle.

The satellite image below shows the extensive sheet of stratus cloud over the Atlantic associated with Tm air.

We rarely experience Tropical Continental (Tc) air – air that flows up from the Sahara over continental Europe.  This is the warmest and driest air we can get – any moisture picked up over the Mediterranean will be rained out before it reaches us.

Tc air gives clear skies, as you can see in the satellite image below – again ignore the front to the west of the UK. In the summer, this can mean that some areas get particularly warm – maybe because of their colour (dark) or aspect (facing the Sun) – giving rise to late afternoon localised thunderstorms

A front is where two air masses meet. In the UK, the weather fronts associated with depressions usually separate polar and tropical maritime air.

If there is a front, then different parts of the UK can be experiencing different air masses. The weather on the fronts themselves is more extreme. 

Look out of the window now – what cloud types can you see? Does that tell you anything about where the air is coming from? You can have a look at earth.nullschool to see if you are right.


Categories
Careers Weather

Weather Forecasting Game

Try your hand at weather forecasting – can you beat the experts from University of Reading and beyond?

Calling all weather enthusiasts and wannabe forecasters! Following its successful launch to the public last summer, The Weather Game, run by the University of Reading is returning for another friendly competition round.

The game offers entrants the chance to try and predict the weather around the world and close to home. Points are awarded for correct weekly forecasts over six weeks, allowing people to take on their friends and try to beat the experts to top the league.

This activity gives school pupils and weather fanatics a glimpse at the science used on television forecasts or to monitor impacts of climate change. A number of high-profile TV weather forecasters like Laura Tobin and Tomasz Schafernaker made some of their first forecasts while they were students at Reading.

Forecasts from leading sources like the Met Office and BBC Weather can be used as a basis for predictions, but players are encouraged to follow their own intuition on where weather might differ from what is expected. For example, if changeable weather is certain or there is only a small chance of showers, going against the expert forecasts for sunshine and rain might earn you the points.

Entrants will make predictions on the temperature, precipitation and sunshine hours for three fixed locations: Reading, UK; Toronto, Canada; Hong Kong, China and also for another city that changes weekly. While travel is off the cards for most of us this year, experiencing the weather is something that connects us all.

Registration opens from Monday 7 June with entries due each Friday for six weeks at 19:00 London time.

Categories
Books Climate Climate Change CPD Geography Microclimates Schools Secondary Teaching Weather

Weather and Climate: a Teachers’ Guide

weather and climate teachers guideIn this teachers’ guide and the accompanying online teaching resources, we aim to give UK geography teachers all that they need to deliver relevant, engaging and thorough weather and climate lessons to 11–14+ year old students. They are not linked to any specific curriculum but should be easily adaptable to all.

The book is accompanied by high quality online background information/professional development resources for teachers.


The Royal Meteorological Society believes that:

  • all students should leave school with basic weather literacy that allows them to understand the weather that affects them, their leisure activities and the careers they choose to follow
  • every student should leave school with basic climate literacy that would enable them to engage with the messages put forward by the media or politicians and to make informed decisions about their own opportunities and responsibilities.

To this end, we have embedded a climate change thread throughout the online resources, showing its relevance to both weather and climate. An understanding of weather and climate is fundamental to an understanding of climate change.

There is a progression of knowledge through the topics, supported by review and assessment activities. The resources also progressively develop key geographical skills such as data, mapwork, GIS, fieldwork and critical thinking.

In this guide, we include common misconceptions which should be challenged in the classroom.

There are 20 topics or chapters. Across these, there are three threads or paths which can be taken through the online resources, depending on the teaching time available:

Basic weather: Weather in our lives, weather measurements, weather and climate, global atmospheric circulation, global climate zones, air masses, pressure and wind and water in the atmosphere

Climate: Weather and climate, global atmospheric circulation, global climate zones, past climate change, polar climate, hot deserts, changing global climate, UK climate, changing UK climate, the climate crisis

Extending weather: Anticyclones, depressions, microclimates, urban weather, tropical cyclones.

Many of the online teaching resources are available with standard or easier versions, as well as extension or alternative activities.

Find the scheme of work, teaching resources, background information for teachers, as well as the Teachers’ Guide (copies of which may be printed on request), here

All the online resources will be updated and revised regularly.

BACK TO TOP