
The first of our very short daily bulletins from COP26 for teachers to use during registration or lessons can now be found on YouTube.
These bulletins will cover highlights about the coming day’s events as well as more general background information about how COP works. We’ll also try and bring in a bit of careers related information.
The aim of the films will be to help students engage more with this very important event which is happening in the UK, as well as giving them some context for the messages that they get through social media etc.
Please share with other teachers in your school who might be interested.
Thanks!
We will be filming very short daily bulletins from COP26 for teachers to use during registration or lessons.
They will cover highlights about the coming day’s events as well as more general background information about how COP works. We’ll also try and bring in a bit of careers related information. You will be able to find them on YouTube and we’ll try to make sure that they have been uploaded the night before, in plenty of time for morning registration.
The aim of the films will be to help students engage more with this very important event which is happening in the UK, as well as giving them some context for the messages that they get through social media etc.
The first video will be available for showing on Monday, 1st November.
Please share with other teachers in your school who might be interested.
Thanks!
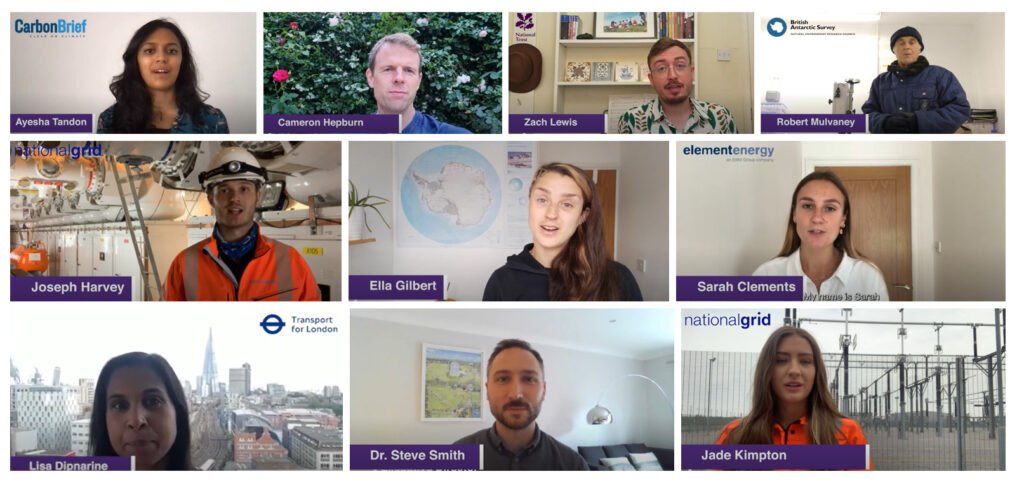
In this new set of 11 short videos, we explore some of the many careers in climate change that you could do with qualifications in STEM subjects.
If you want to work in an area where you can do something positive about climate change, but don’t know how, have a look at the work that these people do, why they think it’s important and the paths they took to the jobs that they now do.
If a career in weather or climate sounds interesting, have a look at the further careers information on our website at metlink.org/careers

The Central England Temperature (CET) dataset is the longest instrumental record of temperature in the world, pre-dating the satellites and radar instruments which we now have to tell us about the state of the atmosphere.
The data represents the temperature in a roughly triangular area of the United Kingdom enclosed by Lancashire, London and Bristol.
The sources of the data include records kept by individuals around the country, all carefully combined and corrected for factors such as changing instruments over time etc. The precision of the data published for each year reflects the number, accuracy, reliability and geographical spread of the temperature records that were available for that year – so early in the record, the data may only have a precision of 1°C or 0.5°C, whereas more recent data has a precision of 0.1°C.
The mean monthly temperature record starts in 1659 (with daily data being available from 1772 and maximum and minimum daily and monthly data beginning in 1878).
The full dataset and references can be found at www.metoffice.gov.uk/hadobs/hadcet
The Royal Meteorological Society is delighted to have collaborated with CREATE Education to develop instructions to allow schools or individuals to 3D print sections of the Central England Temperature Record and use their models to learn about weather, climate, extreme weather and climate change.
These engaging, tactile resources allow students to get a hands-on experience of what climate is and how it can change, and how extreme weather relates to the climate.
Each three dimensional block shows 10 years’ worth of monthly temperature records. Printing off several blocks allows you to compare the changing weather and identify extreme weather events. The models have been designed to interlink, so students can create a series of models to represent larger timeframes.
Climate is usually defined as the average of 30 years’ weather. For easy comparison with the weather in any one year, you can 3D print an additional mini block which shows current (1981-2010) climate.
Once the 3D models have been created and 3D printed, there is a tactile resource that can be used in multiple ways in the classroom to visualise and study past weather and climate, and at how the climate of the UK has been changing over time.
The lesson resources specifically focus on
1. The difference between climate and weather
2. The current climate of the UK
3. The changing climate of the UK
4. Looking at past extreme weather events and researching their impacts on people in the UK.