Categories
Science Secondary

New Resource – Carbon Dioxide in the Atmosphere

Mauna Loa Observatory NOAA

Bringing together learning from biology and chemistry topics in GCSE science, this new resource explores the seasonal cycle in atmospheric carbon dioxide concentrations as well as the year-on-year increase due to human activities.   

Categories
Schools Science Secondary

Isaac Physics Resources

Isaac Physics logo

Over the course of 2022 we produced questions for Isaac Physics, an online study tool developed by the University of Cambridge. Isaac Physics questions are self marking practice questions for secondary school and undergraduate scientists. 

They cover a diverse range of applications of physics in weather and climate, including sea level rise, radar frequencies,  aerosols, oceanic circulation, tidal barrages etc. 

These questions are now live and fully searchable on the Isaac Physics website. 

Categories
Climate Change Geography Science Teaching

Resources for COP27

We have produced some curriculum linked resources for schools to use in the build up to and during COP27 this year.

For geography teachers: a 11-14(+) resources looking at population growth, pyramids, urbanisation and the climate impacts of construction.

For maths teachers: an 11-14 or possibly Core maths resource applying Pythagoras’ theorem to the problem of efficient road construction.

For science (physics) teachers: a 13-16 resource looking at energy transfer and electricity production in the Benban solar farm.  

Categories
Climate Change Science Teaching

Climate Change in Physics

We have created a set of resources designed to allow physics teachers to demonstrate how the core physics taught links to current climate change research and action. For each topic, an expert in the field has recorded a short film which could be shown at the end of the lesson or topic. For some topics, practical activities or worksheets are also included:

Adapting the National Grid

We have a large and growing proportion of our electricity from renewables, and the amount of electricity generated varies depending on the weather. In this film, Jade Kimpton from the National Grid shows how the flow of electricity in the National Grid is getting more complex. 

Key words: renewable and non-renewable energy, greenhouse gasses, fossil fuels, gravitational potential and kinetic store of energy.

Associated activity: UK energy mix

Clouds: Uncertainty in Climate Projections

Clouds reflect the Sun’s light, cooling the planet, but they can also act a bit like greenhouse gases, warming the planet. In this film, Dan Grosvenor from the University of Leeds shows how different types of cloud have a different climate effect.

Key words: transmit, scatter, reflect, dispersion, refraction, electromagnetic radiation

Associated Activity: Light levels and cloud colour

Atmospheric Pressure

The Jet streams are bands of fast winds high in the atmosphere which are driven by pressure differences. Stormy weather follows the jet stream. In this film, Tim Woollings from the University of Oxford shows how, as the lower atmosphere gets warmer, we need to understand how the patterns of pressure and the jet stream change and what effect that will have on storms in the UK.

Key words: Atmospheric pressure, weight, force

Associated activity: Using PhyPhox to investigate atmospheric pressure


Optimising Flight Times

Cathie Wells from the University of Reading is helping aircraft conserve fuel which reduces greenhouse gas emissions by making use of high resolution forecasts of three dimensional wind speeds in the atmosphere.

Key Words: speed, distance, time, velocity, greenhouse gas

Associated Activity: Optimising flight times

States of Matter – Reducing Aircraft Contrails

Contrails occur when water vapour from jet engines condenses – only when the temperature and humidity conditions of the air is right. Contrails act like greenhouse gases. Marc Stettler from Imperial College, London is interested in guiding aircraft to fly where conditions are right, reducing contrail formation.

Key words: gas, liquid, solid, evaporate, condense, sublimate, deposit, humidity, latent heat


Categories
Climate Change Primary Science Teaching

Post SATs Year 6 Weather and Climate Day

We have pulled together a set of Weather and Climate Change resources which could be used with a year 6 class after their SATs exams. Designed as a progressive set of engaging and interactive resources, they introduce skills and knowledge which will help prepare students for secondary school.

The resources can be used in independent lessons, or as part of a whole or half weather and climate themed day.


Categories
Research Science Secondary

Resources for Mars Day

Mars not dusty

14th March 2022 is Mars Day

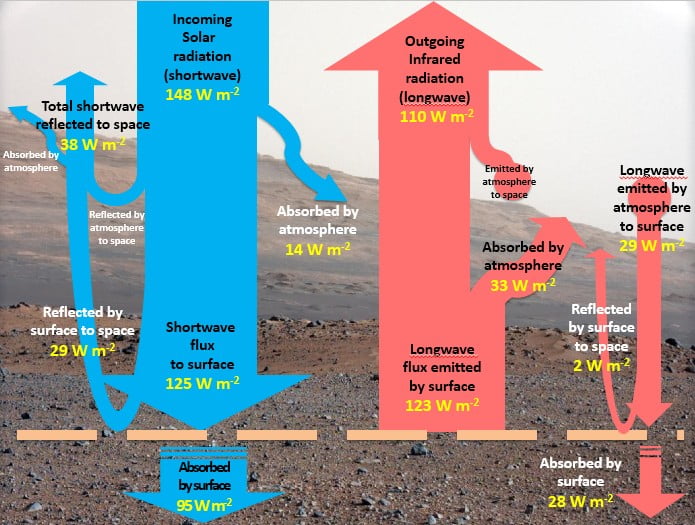
Establishing the radiation or energy budget of the Earth has been crucial to understanding climate change, but what do the radiation budgets of Mars and other planets in our solar system look like? Read about it in this article from Physics Review or this one from Science in School

You can find the energy budget images for all the planets mentioned here

Categories
Blog Books Climate Change Science

Three New Climate Change Books

Climate change books

The Society has been given the chance to review three new climate change books aimed at a very similar audience:

Climate Crisis

Climate Crisis for Beginners
Andy Prentice and Eddie Reynolds
Usborne Publishing Ltd, 2020
Hardback £9.99
128pp
ISBN 978-1-4749-7986-3

Summary: a very comprehensive, engaging and current book for upper primary/ lower secondary aged students

“How important is this crisis? Not everyone agrees about this. This book is here to help you make up your own mind.”

With bright, simple illustrations and a cartoon-like style, it is aimed at young people – the recommended age range is 10+. I suspect that it will appeal most to the 10-14 age range, and then again to slightly older people who will not feel patronised by the style but will have interest in the content. My 14 year-old daughter was put off both by ‘for beginners’ and the appearance of the book. Being much older than that, I struggled a bit with the style – I didn’t know which bit to read next.

Andy Prentice and Eddie Reynolds are authors and editors at Usborne and have consulted with Steve Smith (University of Oxford) and Ajay Ghambir (Imperial College, London) in writing this book.  Ed Hawkins (University of Reading) and Richard Betts (University of Exeter) also contributed. There are 5 chapters – The Basics; How sure are we? What do we do? What’s stopping us? And What can I do?

The book manages to walk the tightrope of accuracy v. oversimplification very well. Of course, that balance will never be perfect – for me, for example, it’s missing a discussion of water vapour in the section about greenhouse gases. However, it introduces an impressively broad range of concepts and vocabulary associated with climate science and climate change more generally.

Climate Crisis for Beginners conveys the significance of climate change together with the many and various political and social issues as well as the viewpoints and priorities of individuals. However, for me, the strength of this book lies in the weight it puts on the solutions and opportunities already available. It is not all doom and gloom.

One concern that I do have is just how quickly the book will become out of date – in one or two places it already has.

I asked my 11 year-old daughter to read it – here are some of her thoughts (I have corrected the spelling): “When I first looked at this book, it looked colourful and full of interesting ideas and visions of the future. The information is presented in a fun way with lots of subtitles and boxes so that you can find what you need easily. I like all the different points of view and the reasoning behind the different answers to questions.”

The book concludes “Now that you’ve read this book, you’ve got the tools to imagine the future that you want and an idea of how to start your journey towards it.”

Climate Action

Climate Action: The Future is in our Hands
Georgina Stevens
Illustrator Katie Rewse
Little Tiger Press, 2021
Hardback £19.99
72pp

Summary: A bright, positive reference book for upper primary aged children, focussing on climate change impacts, mitigation and action

“In this book, we share the facts, but we also share hope.

Learn about the causes of climate change and how it is affecting our world.

Explore the human impact and what it means to have a carbon footprint.

Read about creative ideas for tackling the climate crisis.

Be inspired by positive stories from young changemakers around the globe.

Get tips on how to take action and reduce your carbon footprint.”

The recommended age range for this book is 7-12 and the bright, colourful and relatively simple design and illustrations are geared towards the younger end of that age range. Having said that, my daughters, aged 11 and 14 both really enjoyed it, particularly liking the embossed cover. This is a book which is nice to hold – possibly justifying its price which includes the cost of planting a tree. The layout is as a reference book, making extensive use of subtitles, with each double page spread covering one topic, such as greenhouse gases, tropical storms or our clothes. The ratio of text to images is appealing and the text and images are appropriate to the literacy and numeracy skills of the intended age group.

Georgina Stevens is a sustainability writer, advisor and campaigner. In each topic she features a ‘what can we do’ section with small, achievable changes that young people and their families could make. The book also features a number of ‘changemakers’ and ‘groundbreakers’ – young people from around the world who have already developed sustainability initiatives or got involved in the climate change movement. What the book is missing, though, is the big, complex, economic, social and political developments that could have a really significant global impact on greenhouse gas emissions.

I think that the book probably does have a nice balance of science, technology and positivity for the upper primary age range. The science parts of the book aren’t completely accurate – I cringed when the greenhouse effect was described as a reflection of heat, and water vapour is missing from the discussion of greenhouse gases, but it’s probably appropriate for this age range. 

My 11-year old sagely pointed out that the focus of the book is on now – to this age group, the past may feel slightly irrelevant and the future too unknown and intimidating.

Palm Trees at the North Pole, The Hot Truth about Climate Change
Marc ter Horst
Illustrated by Wendy Panders
Greystone Kids, 2021
Hardback £14.99
192pp

Summary: a science book best suited to early secondary school aged students who like reading. Don’t be put off by the title.

“Once upon a time, there were palm trees at the North Pole. Can you picture that? The most tropical of trees in a place where now there is only snow and ice. In the future, they might reappear. Because the climate is constantly changing.”

Firstly, the title. My 11 year-old daughter’s first comment was about the fact that there isn’t any land at the North Pole. Although the book does touch on continental drift, the author never really explains ‘palm trees at the North Pole’ nor justifies the extension to the future and, for anyone inclined to be sceptical about climate science, this is a very easy target. However, the book does merit passing this first hurdle.

The author, Marc ter Horst, has written several other non-fiction titles for young people. His interests in geology and evolution are apparent in the book, a large section of which focusses on the past. This is a book which is designed to be read from cover to cover rather than dipped in to. It is made up of double page case studies linked together in a  fairly simple, frequently light-hearted story-telling style which will appeal to some readers, particularly those who don’t much like reference book style facts and figures. Inevitably the style means that some processes are over-simplified. However, explaining, say, the Milankovitch cycles in story form is an impressive achievement.

The story starts with the early evolution of the Earth and, passing through Keeling curves and hockey sticks progresses to the impacts of climate change. Adaptation and mitigation strategies don’t really start being mentioned until p. 138 and its only after that – if the reader has got that far – that positive opportunities for preventing climate change start being introduced. This is not a book that will help much with the rise of eco-anxiety in young people.

A unique feature is that the book finishes with ‘climate bingo’ and the instruction to cross off events as they happen – with events covering a questionable choice of climate change impacts and mitigation and adaptation strategies.

My daughter thought the illustrations, which are simple and sometimes add to the text but are mostly just decorative, were her favourite part.  Aimed at readers aged 8-12, it is quite text heavy and I think most 8 year-olds would struggle with it.

Categories
Blog Climate Climate Change Science

Weather, Climate and Chaos Theory

Why is it so hard to predict the weather a week in advance, and how can scientists tell us what they think the climate will be like in 50 years’ time?

First of all, it’s important to understand that weather isn’t random, it’s chaotic. If the weather was random, it would mean there’s no possible way of knowing what it was going to do next. However, the weather does obey the laws of physics and every change in the weather has a cause. The problem is that since there are so many possible causes, we can’t know about them all.

You may have heard of the butterfly effect (first proposed by Ed Lorenz in the 1960s): A butterfly flapping its wings in the Amazon rainforest might, through a long line of unlikely but possible consequences, cause a storm over Texas. In a similar vein, if we don’t know what’s going on in the atmosphere and on the Earth’s surface down to the detail of a butterfly flapping its wings now, we can’t hope to know how that’ll affect the weather in a week’s time. The possible range of consequences grows with time – and the ability to accurately forecast the weather will decrease with time. Of course, some weather situations – such as High pressure, are much easier to predict than others – such as the snow showers which can be caused by Arctic maritime air, but in general tomorrow’s weather forecast is much more likely to be accurate than one for 10 days’ time.

double pendulum

Animation created by Ross Bannister

This animated double pendulum illustrates the chaotic nature of weather really well: The pendulum starts off in the same position, but with a slightly different rotation speed (400.0 degrees/ second v. 400.1 degrees/ second). Over time the difference in the way the double pendulum rotates grows, until the two are behaving completely differently. 

Modern forecasting techniques try to capture the range of possible future weather by making an ‘ensemble’ of weather forecasts – rather than making one forecast with one set of starting conditions (the weather now) they make many forecasts, each with tiny differences in the weather now – trying to take into account the effects of all the possible ‘butterflies’ or other tiny details about the climate system that we can’t possibly measure. The ensemble of forecasts gives forecasters a range of possible weather forecasts, with some indication of what’s most likely, and what might happen.

The climate, unlike the weather, is not chaotic. Remembering that climate is ‘average weather’, if large scale factors which control the climate are known – the composition of the atmosphere, the location of the continents, the Earth’s position in relation to the Sun etc. then it’s possible to predict the climate.

In between weather forecasts and climate forecasts come seasonal forecasts – the ‘what will the weather be next winter’ type questions. As the weather is chaotic, this is very hard to do, but there is some skill to be found in looking at the large scale influences on the weather – for example, if there’s a strong El Niño occurring, then certain weather patterns are more likely to form than others.

The North Atlantic Oscillation (or NAO) is another of the many factors which can be looked at. Meteorologists look at the pressure difference between Iceland and the Azores. The pressure is always lower in Iceland than in the Azores because of the large scale circulation of the atmosphere, however the difference in pressure can vary. A large difference in the pressure (a positive NAO) leads to stronger westerlies, bringing moist air to Europe. Consequently, summers are cool and winters are mild and wet in Central and Western Europe. In contrast, if the pressure difference is small (a negative NAO), westerlies are suppressed, winters are cold and dry in northern European areas and the depressions track southwards toward the Mediterranean Sea, bringing increased storm activity and rainfall to southern Europe and North Africa.

Categories
Blog Climate Climate Change Science

Carbon Dioxide in the Atmosphere – Balancing the Flow

It is the concentration of greenhouse gases in the atmosphere, rather than the emissions at a particular moment in time, which determines the temperature of the Earth.

How the concentration of Carbon Dioxide changes is determined by the balance between the amount of carbon dioxide going in to the atmosphere, and the amount being taken out. Change the flow rate using the + and – buttons on the animation below, where the water level in the bath represents the concentration of greenhouse gases in the atmosphere. 

In the furthest left position, there is less (no) carbon dioxide being added to the atmosphere than is being taken out by natural and human processes. The concentration of carbon dioxide in the atmosphere falls.

In the second position, the same amount of carbon dioxide is being added to the atmosphere than is being taken out by natural and human processes. The concentration of carbon dioxide in the atmosphere stays the same.

In the third position, there is slightly more carbon dioxide being added to the atmosphere than is being taken out by natural and human processes. The concentration of carbon dioxide in the atmosphere rises.

In the fourth position, there is much more carbon dioxide being added to the atmosphere than is being taken out by natural and human processes. The concentration of carbon dioxide in the atmosphere rises rapidly.

Even if emissions fall (position 3), as was the case briefly in 2020 when COVID19 related restrictions reduced global emissions, the concentration of greenhouse gases in the atmosphere continues to rise.

The relationship between emissions, concentrations, global temperature and sea level

Reducing emissions

Even before humans were around, there was a constantly evolving balance of greenhouse gases in the atmosphere. Natural sources, such as respiring animals, the decomposition of organic matter, volcanoes, rock weathering, freshwater outgassing and ocean-atmosphere exchange of gases are balanced by photosynthesis and ocean-atmosphere exchange of gases.

Humans have added additional sources and sinks, as are summarised by this diagram from the IPCC:

WG1 Chapter 6, figure 1. The numbers represent carbon reservoirs in Petagrams of Carbon (PgC; 1015gC) and the annual exchanges in PgC/year. The black numbers and arrows show the pre-Industrial reservoirs and fluxes. The red numbers and arrows show the additional fluxes caused by human activities averaged over 2000-2009, which include emissions due to the burning of fossil fuels, cement production and land use change (in total about 9 PgC/year). Some of this additional anthropogenic carbon is taken up by the land and the ocean (about 5 PgC/year) while the remainder is left in the atmosphere (4 PgC/year), explaining the rising atmospheric concentrations of CO2. The red numbers in the reservoirs show the cumulative changes in anthropogenic carbon from 1750-2011; a positive change indicates that the reservoir has gained carbon.

IPCC, 2013: Climate Change 2013: The Physical Science Basis. Working Group I Contribution to the Fifth Assessment Report of the Intergovernmental Panel on Climate Change, Cambridge University Press, Cambridge, United Kingdom and New York, NY, USA.

More processes could be added to this picture in the future, such as carbon capture and storage.

This animation was adapted from an infographic produced by the IPCC https://www.ipcc.ch/sr15/mulitimedia/worlds-apart/

Other related links

Categories
Science

Short Atmospheric Physics Videos

We have been delighted to work together with Imperial College, London and the Institute of Physics Environmental Physics group to produce a set of 6 short films looking at how we can use an infrared camera or thermometer to observe physics at work in the atmosphere.