Categories
Climate Change

COP26 and November 2020

As we head into the weeks when COP26, the UN climate change conference at which heads of state, climate experts and campaigners come together to agree coordinated action to tackle climate change, should have happened, a number of organisations are taking the opportunity to run virtual climate events.

The Youth Climate Summit will run from 9-13 November 2020.  It is a free, week-long virtual festival of themed discussions and activities.

Between 19 November – 1st December, Mockcop are running a youth-led online conference following a similar structure to the postponed COP26 climate summit to raise the ambition of our leaders when it comes to tackling the climate emergency.

If you are in a school, why not take the opportunity to run our Climate Negotiations resource with a year group bubble? We hope to have a fully virtual version available early in 2021.

COP26 will now run from 1-12 November 2021, in Glasgow.
https://www.youtube.com/embed/Cn-ZqGJxpk4
Categories
Geography Secondary Weather

The Weather of 2020

Last week, Sylvia Knight from the Royal Meteorological Society gave a talk for Geography education online on the Weather of 2020.
This year it felt like we had summer weather in Spring and Autumn weather in Summer. In this session, we examine the global processes that determine the weather in the UK, as well as the impact of COVID-19 on weather and climate around the world.
The talk is aimed at A Level students, but would also be useful CPD for geography teachers or for younger students who have already covered a weather topic.

Categories
Extreme weather Snow

Will it snow?

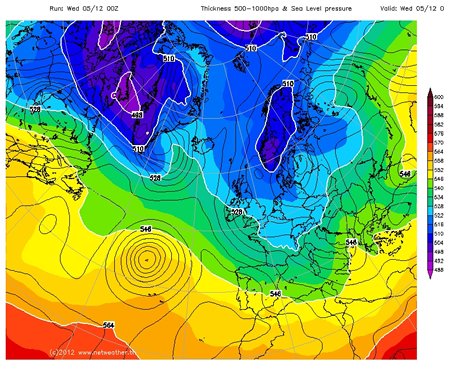
The best way to find out is to look at the weather forecast charts (in the charts and data menu) at http://www.netweather.tv/index.cgi?action=nwdc;sess= and select ‘HGT 500-1000’ from the ‘select chart type’ menu If the 528dam line is South of where you are, and there is a forecast of precipitation, then that precipitation is likely to be snow.

will it snow isobars
Image of the UK, 5th December 2012

What is the 528dam line?

528dam = 5280m
It is the vertical distance between the 1000mb height (somewhere near the ground) and the 500mb height (somewhere in the middle of the troposphere). As warm air is less dense than cold air, the smaller this distance, the colder the air is.

It is also worth having a look at a cross section through the atmosphere for example at http://www.wetter3.de/ – select ‘Vertikalschnitte’ which gives a longtitude/ height cross section for 50N (move the pointer on the right side of the left hand map to change the latitude of the cross section). The air between the clouds and the ground has to be cold for snow to reach the ground.

When do we get snow in the UK?

More information from the Met Office about Snow in the UK and forecasting snow.

A nice explanation of why we had such a different November in 2011 to the weather in November 2010 from the Met Office and a report on the 2010 snow and its impacts on the UK.

And an article from the BBC about what constitutes a white Christmas. 

Snow inspired science teaching ideas from Science in School.

When will it snow – an article from Met Matters

Snow inspired geography teaching ideas from the GA.

How to make a snowflake, from the Institute of Physics

From Brilliant Maps; the probability of a white Christmas across Europe.

Categories
Geography Rain Secondary

A Level Data Skills: Deforestation and Weather

In a paper that came out in the journal Nature Communications, Self-amplified Amazon forest loss due to vegetation-atmosphere feedbacks, scientists revealed that deforestation can intensify droughts, compounding climate change linked changes in rainfall patterns.

Using data collected by scientists in the School of Earth and the Environment at the University of Leeds, we have created a data skills exercise for A Level geography which allows students to explore leaf area, evapotranspiration and temperature data using various statistical techniques to explore the relationship between deforestation and weather.

With clear links to both the carbon and water cycles, you can find the resources here.

Categories
Folklore

Weather Folklore

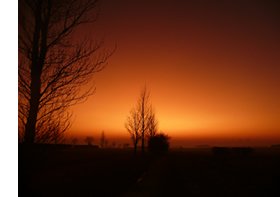
Sunset by Will Copeland

Weather forecasters are not the only people who predict the weather. There are also lots of traditional sayings and proverbs which aim to help ordinary people predict the weather.

The source of most of the sayings is unknown. In the past, when people lived and worked on the land, the weather was very important and they watched for patterns to help them predict the future weather. They then made up rhymes to help them to remember these patterns. Some of these sayings have some truth. Others, which try to predict the weather for the following season from a single event, are unlikely to ever be true. Can you guess which are true or false?

True!

There is a lot of confusion about this saying – although a dusty or polluted atmosphere, more common when the atmospheric pressure is high, can give a very vivid sunset, this saying refers to the passage of a depression across the UK.

Depressions usually travel from west to east, and if one has just passed, then we are unlikely to get another one for a couple of days. So if a depression has just passed, and is to the east of us, the sun setting in the west will illuminate it and give a beautiful red sky. On the other hand if a depression is approaching from the west, and is illuminated by the sun rising in the east, then bad weather is on its way.

Red Sky at Night worksheet and investigation.

True. Ish.

This should probably be adapted to “when swallows fly high, it is currently dry”. Swallows and other birds fly high to chase insects which have been carried up by thermals. If it’s raining, then those same insects will be washed down to lower levels.

Read more at MetMatters

False!

There is no evidence that this is true.

True!

Tall (sailing) ships would lower their sails when bad weather approached. Mackerel sky (altocumulus clouds) and mare’s tails (cirrus clouds) could both be associated with an approaching depression.

False!

St. Swithun’s Day is on 15th July. Although our summers can follow a more or less settled pattern, there has not been a continuous period of 40 days of rainfall since UK records began.

True!

An easterly wind implies polar continental air – which, in winter at least, can be bitterly cold and bring snow to eastern parts of the UK.

False!

In the UK at least, it is never too cold for snow. In places like Antarctica and the middle of large continents, far away from the relatively warm ocean, it may be true. At very cold temperatures, there will be very little evaporation from rivers, lakes etc. and so the air will be very dry and it’s very unlikely to snow.

Sometimes true!

In the summer, clear skies (maybe due to High pressure conditions, or a tropical continental air mass) which allow you to see the mountains can lead to thunderclouds bubbling up through the day and heavy rainfall in the late afternoon.

Mostly false!

Although depressions do tend to cross the UK on a timescale of a few hours, they can move much more slowly. Morning rain could be the last remnant of a depression passing through, but if it’s marking the arrival of a depression, then it’ll still be raining at 11.

False!

Blows it’s horn’ refers to the occurrence of thunderstorms. Thunderstorms in March indicate it is unusually warm for that time of year but this is no indicator of a long term weather trend.

False!

Whether or not there is a storm at the beginning of March (coming in like a Lion), the weather at the end of the month could be stormy or calm (going out like a lamb).

True!

A circle, corona or halo around the sun or moon is an indication of very high cloud (cirrostratus). This can be a sign that a warm front is on its way.

(another version of this saying is “When halo rings Moon or Sun, rain’s approaching on the run” )

True!

A clear night – typically due to High pressure conditions – will let you see the stars well. If there are no clouds to insulate the Earth then more heat will be lost from the surface to space and it will be a cold night.

Categories
Facts

Weather Facts

Look in this section to find out more about UK and global weather, with some weird and wonderful facts and pictures, clouds and great pictures of weather in general!!

You can download a powerpoint presentation below:

Cloud Images

cloud factsLearn what the different kinds of clouds look like with this powerpoint presentation about identifying clouds.

Download Powerpoint >> (53MB)

English Weather Facts

english weather factsHave you ever wondered about the hottest, coldest or any other English weather facts? Look at our powerpoint and find out some amazing facts.
Download Powerpoint >> (7.3MB)

Scottish Weather Facts

Scottish weather factsWhat was the sunniest month in Scotland? Do you know? Astound yourself with our powerpoint giving amazing Scottish weather facts!
Download Powerpoint >> (9MB)

World Weather Facts

world factsWhat is the wettest place in the world? You might be surprised!
Download Powerpoint >> (3.25MB)


Categories
CPD Teaching

Come Rain or Shine: Teacher CPD Wins Award

We are delighted that our online weather and climate teacher CPD course “Come Rain or Shine” has received the EMS Outreach & Communication Award 2018.

FutureLearn is a leading Massive Open Online Course (MOOC) platform delivering online learning to participants around the world, free of charge. Running a course on this platform has been a key way for us to engage new and harder-to-reach audiences than could otherwise be reached, and to be able to develop course content that is interactive and engaging. The only cost to participants is associated with extending access to the course materials beyond the initial, free, 5 week period.

The Royal Meteorological Society partnered with the University of Reading to develop a three week course entitled ‘Come Rain or Shine’ which focusses on the processes and phenomena which govern UK weather. The content of the course was developed with the needs of UK secondary geography teachers in mind, however the course was open and very much of interest to all.

An online course to reach secondary geography teachers was needed because:

  • Changes to the National Curriculum and exam specifications in the last couple of years have increased the requirement for the teaching of weather and climate in schools.
  • The knowledge, skills and confidence of current UK geography teachers to teach weather and climate is currently very low, following decades of little weather and climate teaching in schools and
  • The model of teacher training is moving from Universities to individual schools, making
    knowledge update days with trainee teachers increasingly difficult to deliver.

The course ran twice in 2016, three times in 2017 and will run three times in 2018, requiring participants to spend around 3 hours per week studying the dynamic materials. These materials consist of a mix of written articles, videos, fieldwork activities and other practical exercises written by Dr. Sylvia Knight, Head of Education at the Royal Meteorological Society and Dr. Pete Inness, a lecturer at the Department of Meteorology at the University of Reading. Registered participants benefit from peer-to-peer support. In addition, during the three week periods, additional support is available from expert mentors from the University and the Society given through integrated discussion areas at each step of the course.
Participant numbers have been high: in June 2016 over 9000 people registered for the course, in October 2016 over 4000 registered and through 2017 over 10,000 registered.

Learning Outcomes for Participants:

  • Describe the weather features associated with depressions, anticyclones and the four main air masses which affect the UK.
  • Interpret a synoptic or weather chart, to provide details about wind speed and direction, precipitation and cloud cover.
  • Describe some of the physical processes which give rise to weather, such as convection, condensation, pressure gradients and the Coriolis force.
  • Investigate local weather conditions using readily available instruments.
  • Explain some of the processes which transfer energy through the Earth system, including the transient effects of volcanoes and changes in the Earth’s orbit, and how these processes relate to the Earth’s climate.
  • Apply their understanding of mid-latitude weather systems to the analysis of weather data and images.