Back in 2021 we released the Weather and Climate Teachers’ guide, accompanied by resources for the classroom and teacher CPD.
We are now happy to announce that the CPD ‘More For Teachers’ documents are now available as a series of short films on our YouTube channel.
The videos, like the guide, are aimed at secondary geography teachers to support the delivery of weather and climate lessons to 11–14+ year old students. They are not linked to any specific curriculum and should support teaching across all of the UK.
See the first video here:
 We have just updated and extended the ‘More for Teachers’ information associated with our award-winning Weather and Climate: a Teachers’ Guide. These information sheets are designed to provide CPD for teachers of geography who would like to improve or update their weather and climate subject knowledge.
The teachers’ guide and the accompanying online teaching resources, aim to give UK geography teachers all that they need to deliver relevant, engaging and thorough weather and climate lessons to 11–14+ year old students. They are not linked to any specific curriculum but should be easily adaptable to all.
There are 20 topics or chapters. Across these, there are three threads or paths which can be taken through the online resources, depending on the teaching time available:
Basic weather: Weather in our lives, weather measurements, weather and climate, global atmospheric circulation, global climate zones, air masses, pressure and wind and water in the atmosphere
Climate: Weather and climate, global atmospheric circulation, global climate zones, past climate change, polar climate, hot deserts, changing global climate, UK climate, changing UK climate, the climate crisis
Extending weather: Anticyclones, depressions, microclimates, urban weather, tropical cyclones.
The Royal Meteorological Society believes that:
To this end, we have embedded a climate change thread throughout the online resources, showing its relevance to both weather and climate. An understanding of weather and climate is fundamental to an understanding of climate change.
There is a progression of knowledge through the topics, supported by review and assessment activities. The resources also progressively develop key geographical skills such as data, mapwork, GIS, fieldwork and critical thinking.
We also include common misconceptions which should be challenged in the classroom.
Many of the online teaching resources are available with standard or easier versions, as well as extension or alternative activities.
Find the scheme of work, teaching resources, background information for teachers, as well as the Teachers’ Guide here.
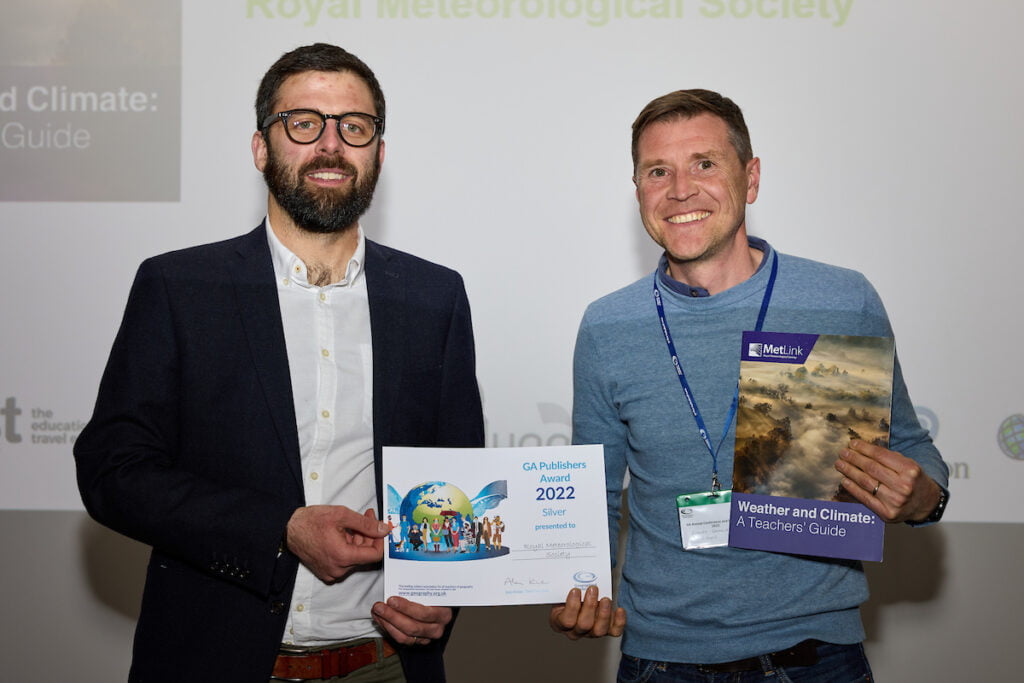
We were delighted that our Weather and Climate Teachers’ Guide/ scheme of work for 11-14 geography was awarded a ‘silver’ by the Geographical Association at their conference in April.
“This excellent – and free – resource, accompanied by differentiated PowerPoints, is well-structured, informative, and fits some complex weather and climate topics into a digestible format. The judges felt it is an accessible resource that provides support for subject specialist and non-specialist teachers alike. They liked the examples that the authors used and the way it makes connections from one lesson to another, building the learning along the way.”
Photo credit: Geographical Association/Shaun Flannery 2022


The Central England Temperature (CET) dataset is the longest instrumental record of temperature in the world, pre-dating the satellites and radar instruments which we now have to tell us about the state of the atmosphere.
The data represents the temperature in a roughly triangular area of the United Kingdom enclosed by Lancashire, London and Bristol.
The sources of the data include records kept by individuals around the country, all carefully combined and corrected for factors such as changing instruments over time etc. The precision of the data published for each year reflects the number, accuracy, reliability and geographical spread of the temperature records that were available for that year – so early in the record, the data may only have a precision of 1°C or 0.5°C, whereas more recent data has a precision of 0.1°C.
The mean monthly temperature record starts in 1659 (with daily data being available from 1772 and maximum and minimum daily and monthly data beginning in 1878).
The full dataset and references can be found at www.metoffice.gov.uk/hadobs/hadcet
The Royal Meteorological Society is delighted to have collaborated with CREATE Education to develop instructions to allow schools or individuals to 3D print sections of the Central England Temperature Record and use their models to learn about weather, climate, extreme weather and climate change.
These engaging, tactile resources allow students to get a hands-on experience of what climate is and how it can change, and how extreme weather relates to the climate.
Each three dimensional block shows 10 years’ worth of monthly temperature records. Printing off several blocks allows you to compare the changing weather and identify extreme weather events. The models have been designed to interlink, so students can create a series of models to represent larger timeframes.
Climate is usually defined as the average of 30 years’ weather. For easy comparison with the weather in any one year, you can 3D print an additional mini block which shows current (1981-2010) climate.
Once the 3D models have been created and 3D printed, there is a tactile resource that can be used in multiple ways in the classroom to visualise and study past weather and climate, and at how the climate of the UK has been changing over time.
The lesson resources specifically focus on
1. The difference between climate and weather
2. The current climate of the UK
3. The changing climate of the UK
4. Looking at past extreme weather events and researching their impacts on people in the UK.
Why is it so hard to predict the weather a week in advance, and how can scientists tell us what they think the climate will be like in 50 years’ time?
First of all, it’s important to understand that weather isn’t random, it’s chaotic. If the weather was random, it would mean there’s no possible way of knowing what it was going to do next. However, the weather does obey the laws of physics and every change in the weather has a cause. The problem is that since there are so many possible causes, we can’t know about them all.
You may have heard of the butterfly effect (first proposed by Ed Lorenz in the 1960s): A butterfly flapping its wings in the Amazon rainforest might, through a long line of unlikely but possible consequences, cause a storm over Texas. In a similar vein, if we don’t know what’s going on in the atmosphere and on the Earth’s surface down to the detail of a butterfly flapping its wings now, we can’t hope to know how that’ll affect the weather in a week’s time. The possible range of consequences grows with time – and the ability to accurately forecast the weather will decrease with time. Of course, some weather situations – such as High pressure, are much easier to predict than others – such as the snow showers which can be caused by Arctic maritime air, but in general tomorrow’s weather forecast is much more likely to be accurate than one for 10 days’ time.
Animation created by Ross Bannister
This animated double pendulum illustrates the chaotic nature of weather really well: The pendulum starts off in the same position, but with a slightly different rotation speed (400.0 degrees/ second v. 400.1 degrees/ second). Over time the difference in the way the double pendulum rotates grows, until the two are behaving completely differently.
Modern forecasting techniques try to capture the range of possible future weather by making an ‘ensemble’ of weather forecasts – rather than making one forecast with one set of starting conditions (the weather now) they make many forecasts, each with tiny differences in the weather now – trying to take into account the effects of all the possible ‘butterflies’ or other tiny details about the climate system that we can’t possibly measure. The ensemble of forecasts gives forecasters a range of possible weather forecasts, with some indication of what’s most likely, and what might happen.
The climate, unlike the weather, is not chaotic. Remembering that climate is ‘average weather’, if large scale factors which control the climate are known – the composition of the atmosphere, the location of the continents, the Earth’s position in relation to the Sun etc. then it’s possible to predict the climate.
In between weather forecasts and climate forecasts come seasonal forecasts – the ‘what will the weather be next winter’ type questions. As the weather is chaotic, this is very hard to do, but there is some skill to be found in looking at the large scale influences on the weather – for example, if there’s a strong El Niño occurring, then certain weather patterns are more likely to form than others.
The North Atlantic Oscillation (or NAO) is another of the many factors which can be looked at. Meteorologists look at the pressure difference between Iceland and the Azores. The pressure is always lower in Iceland than in the Azores because of the large scale circulation of the atmosphere, however the difference in pressure can vary. A large difference in the pressure (a positive NAO) leads to stronger westerlies, bringing moist air to Europe. Consequently, summers are cool and winters are mild and wet in Central and Western Europe. In contrast, if the pressure difference is small (a negative NAO), westerlies are suppressed, winters are cold and dry in northern European areas and the depressions track southwards toward the Mediterranean Sea, bringing increased storm activity and rainfall to southern Europe and North Africa.
In this teachers’ guide and the accompanying online teaching resources, we aim to give UK geography teachers all that they need to deliver relevant, engaging and thorough weather and climate lessons to 11–14+ year old students. They are not linked to any specific curriculum but should be easily adaptable to all.
The book is accompanied by high quality online background information/professional development resources for teachers.
The Royal Meteorological Society believes that:
To this end, we have embedded a climate change thread throughout the online resources, showing its relevance to both weather and climate. An understanding of weather and climate is fundamental to an understanding of climate change.
There is a progression of knowledge through the topics, supported by review and assessment activities. The resources also progressively develop key geographical skills such as data, mapwork, GIS, fieldwork and critical thinking.
In this guide, we include common misconceptions which should be challenged in the classroom.
There are 20 topics or chapters. Across these, there are three threads or paths which can be taken through the online resources, depending on the teaching time available:
Basic weather: Weather in our lives, weather measurements, weather and climate, global atmospheric circulation, global climate zones, air masses, pressure and wind and water in the atmosphere
Climate: Weather and climate, global atmospheric circulation, global climate zones, past climate change, polar climate, hot deserts, changing global climate, UK climate, changing UK climate, the climate crisis
Extending weather: Anticyclones, depressions, microclimates, urban weather, tropical cyclones.
Many of the online teaching resources are available with standard or easier versions, as well as extension or alternative activities.
Find the scheme of work, teaching resources, background information for teachers, as well as the Teachers’ Guide (copies of which may be printed on request), here.
All the online resources will be updated and revised regularly.
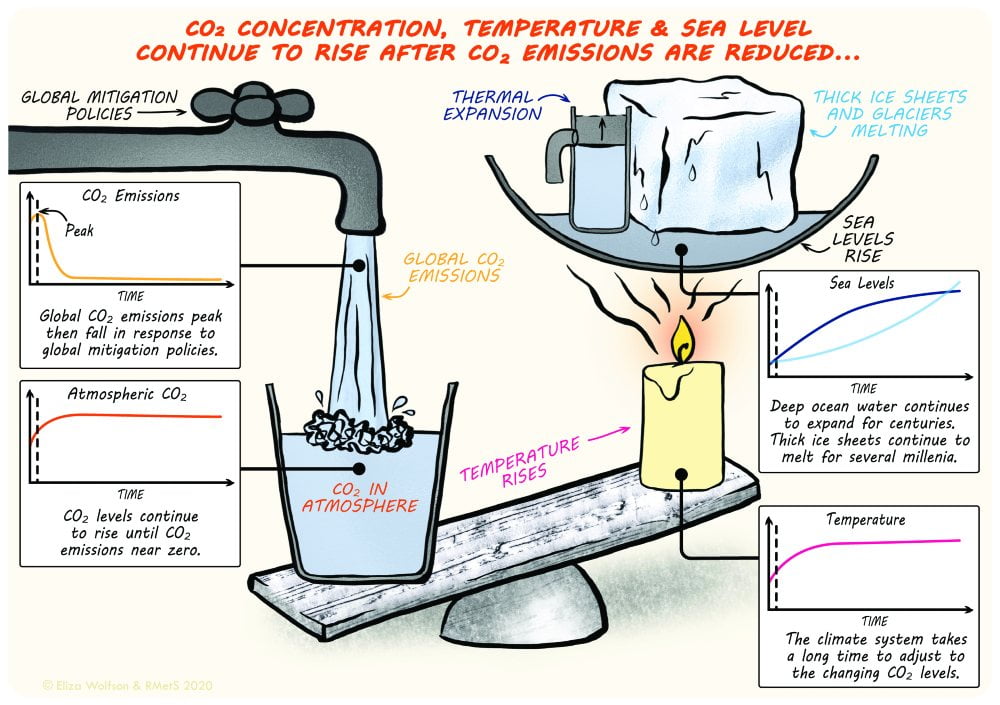
It is the concentration of greenhouse gases in the atmosphere, rather than the emissions at a particular moment in time, which determines the temperature of the Earth.
How the concentration of Carbon Dioxide changes is determined by the balance between the amount of carbon dioxide going in to the atmosphere, and the amount being taken out. Change the flow rate using the + and – buttons on the animation below, where the water level in the bath represents the concentration of greenhouse gases in the atmosphere.
In the furthest left position, there is less (no) carbon dioxide being added to the atmosphere than is being taken out by natural and human processes. The concentration of carbon dioxide in the atmosphere falls.
In the second position, the same amount of carbon dioxide is being added to the atmosphere than is being taken out by natural and human processes. The concentration of carbon dioxide in the atmosphere stays the same.
In the third position, there is slightly more carbon dioxide being added to the atmosphere than is being taken out by natural and human processes. The concentration of carbon dioxide in the atmosphere rises.
In the fourth position, there is much more carbon dioxide being added to the atmosphere than is being taken out by natural and human processes. The concentration of carbon dioxide in the atmosphere rises rapidly.
Even if emissions fall (position 3), as was the case briefly in 2020 when COVID19 related restrictions reduced global emissions, the concentration of greenhouse gases in the atmosphere continues to rise.
The relationship between emissions, concentrations, global temperature and sea level
Even before humans were around, there was a constantly evolving balance of greenhouse gases in the atmosphere. Natural sources, such as respiring animals, the decomposition of organic matter, volcanoes, rock weathering, freshwater outgassing and ocean-atmosphere exchange of gases are balanced by photosynthesis and ocean-atmosphere exchange of gases.
Humans have added additional sources and sinks, as are summarised by this diagram from the IPCC:
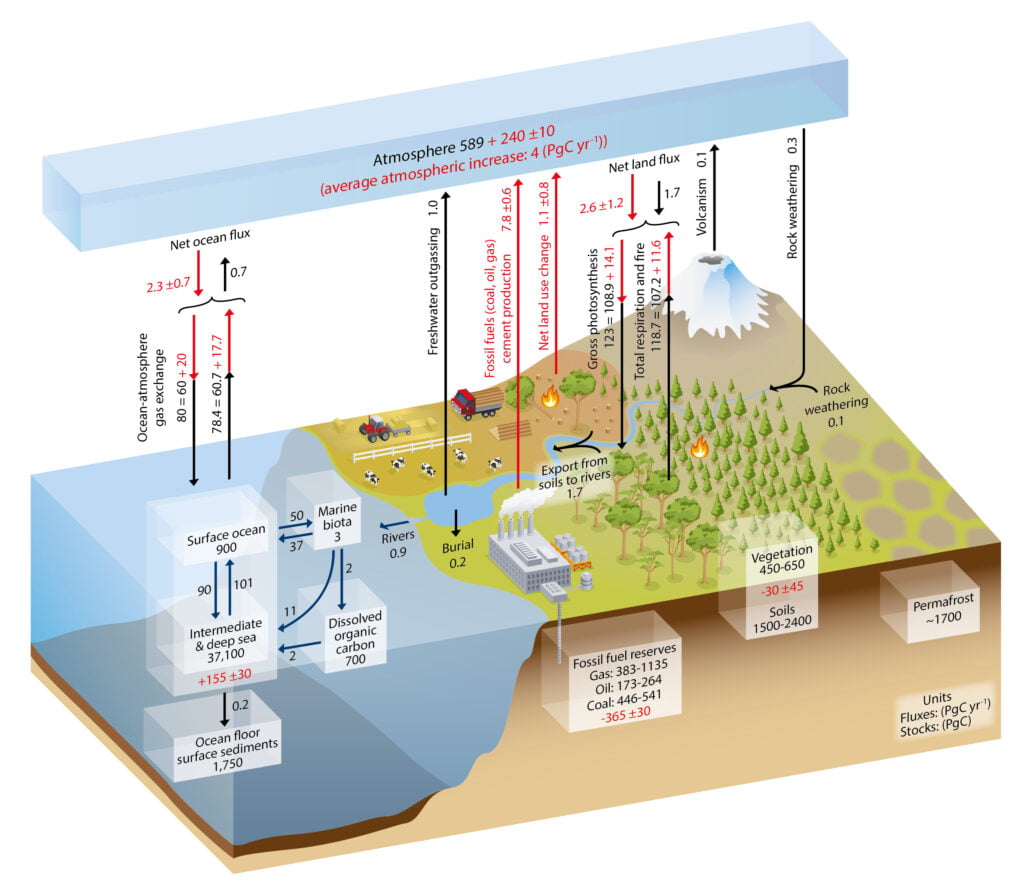
WG1 Chapter 6, figure 1. The numbers represent carbon reservoirs in Petagrams of Carbon (PgC; 1015gC) and the annual exchanges in PgC/year. The black numbers and arrows show the pre-Industrial reservoirs and fluxes. The red numbers and arrows show the additional fluxes caused by human activities averaged over 2000-2009, which include emissions due to the burning of fossil fuels, cement production and land use change (in total about 9 PgC/year). Some of this additional anthropogenic carbon is taken up by the land and the ocean (about 5 PgC/year) while the remainder is left in the atmosphere (4 PgC/year), explaining the rising atmospheric concentrations of CO2. The red numbers in the reservoirs show the cumulative changes in anthropogenic carbon from 1750-2011; a positive change indicates that the reservoir has gained carbon.
IPCC, 2013: Climate Change 2013: The Physical Science Basis. Working Group I Contribution to the Fifth Assessment Report of the Intergovernmental Panel on Climate Change, Cambridge University Press, Cambridge, United Kingdom and New York, NY, USA.
More processes could be added to this picture in the future, such as carbon capture and storage.
This animation was adapted from an infographic produced by the IPCC https://www.ipcc.ch/sr15/mulitimedia/worlds-apart/
Other related links
How does climate relate to the weather?
We like to talk about the weather, to complain about its variability and to blame the weather forecasters for getting it wrong. But what is ‘climate’, and how does the weather we experience on a day-to-day basis relate to climate change, a subject which is increasingly dominating our newspapers and television screens? Why is it that we can’t make a perfect weather forecast? How can we hope to predict the climate of the 21st century, when we can’t say what the weather will be doing in a week’s time? If the climate changes, how does the weather change?
Firstly, how does the climate relate to the weather we experience on a day-to-day basis? We know from experience that the weather can be very different from one day to the next, let alone from one year to the next, without any change in the climate.
Surprisingly, dice are a good way to think about the difference between weather and climate…
The animation below allows you to choose how many times to roll a dice and then see how often you get each of the six sides. Try a low number of rolls, then try some larger number of rolls and see what happens:
Throw the dice a few hundred times. What is the average (mean) of the scores? The more throws, the closer the average gets to 3.5. If you were to throw the dice one more time, you would not be able to predict the number that the dice would land on, as the probability of throwing each number is the same. However, you could be very confident that the mean would still be 3.5.
But what has this got to do with weather and climate?
What if we associate weather types (for example, cloud cover) with each number on the dice?
Try rolling the dice in the animation, again explore what happens as the number of rolls increases.
As when there were numbers on the sides of the die, you can’t predict what the weather will be on the next throw. Climate is defined as being the average of the weather over a long (typically 30 years) period of time. The ‘climate’ of this die is 50% cloud cover. A single throw of 0% or 100% cloud cover won’t affect the climate very much if you are taking the average of 100s of throws. In the same way we can have a very hot summer one year, and a very wet one the next, without the climate, the weather we expect to happen, necessarily changing.
“Climate is what we expect, weather is what we get“
So why do the weather forecasters never get it totally right? Mostly because the weather is a ‘chaotic’ system.
Very small changes to the starting conditions can lead to completely different weather patterns developing. This observation led Ed Lorenz to suggest that the flap of a butterfly’s wings in the Amazon rainforest could lead to a tornado in Texas. It is very unlikely, but it could.
This means that, to make a perfect weather forecast, we need to know what the atmosphere is doing currently, down to the scale of individual butterflies flapping their wings, which is obviously impossible!
So, since tiny changes in the starting conditions of a weather system can make significant differences to the outcome, when making a forecast we have to try to take into account what might be happening now, as well as what might happen in the future to affect the atmosphere. The best we can do is to produce a range of forecasts, with some indication of what is most likely, or least likely, to happen.
To help illustrate this, consider throwing two dice instead of one:
With two dice, the probability of throwing a combined score of a number between 2 and 12 is not the same. There is only one combination of number that would give you a 2 or a 12 (two 1s or two 6s respectively) but, for example, for a combined score of 4 you could throw a 3 and a 1, two 2s or a 1 and a 3 – so you are 3 times as likely to throw 4 as 2 or 12. There are most possible ways of throwing a combined score of 7, and no way at all of throwing a 1 or 13 or more.
Move the slider to pick a number and throw the dice a large number of times. Notice the shape of the graph that is produced – the middle numbers are rolled more often than the smallest or largest numbers.
This sort of shape of ‘bell shaped’ graph is very common. For example, temperature measurements will often show a similar distribution, although temperature can of course take any value, not just the numbers one to twelve.
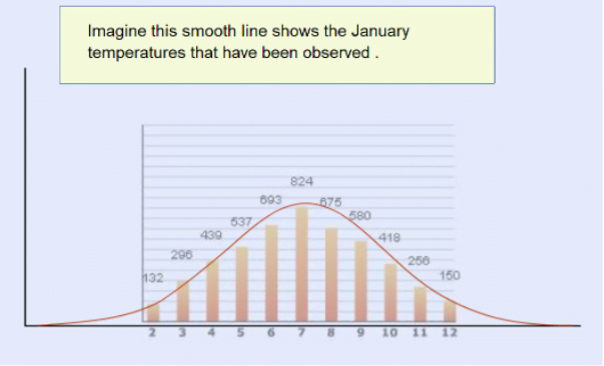
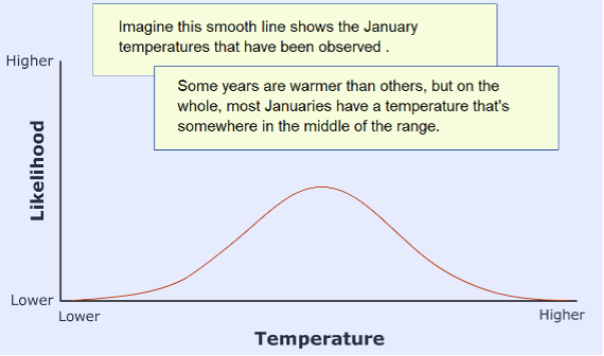
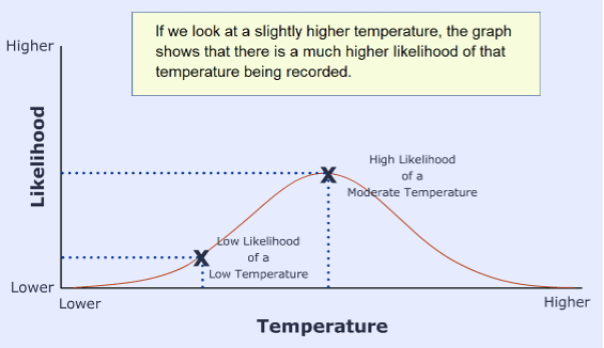

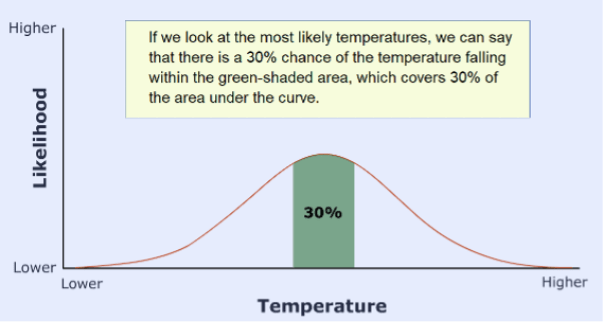
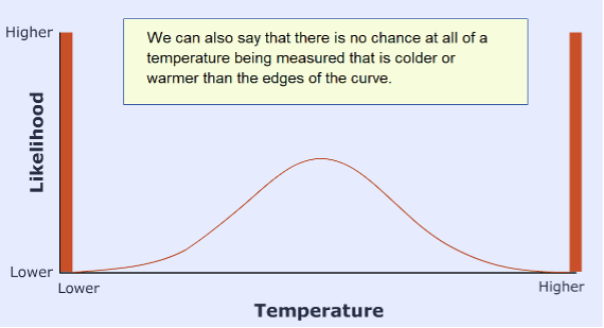
In this way, the results of many weather and climate forecasts can be combined to show what is most likely to happen, what is unlikely to happen and what almost definitely won’t happen.
But what about extreme events? How will the likelihood of an extreme event change as the climate warms? It is never possible to attribute one particular event to a particular cause. To go back to the dice example, you could load a die so that sixes occur twice as often as normal. But if you were to throw a six using this die, you could not blame it specifically on the fact that the dice had been loaded. Half of the sixes would have occurred anyway, even with a normal die. Loading the die just doubles the odds of throwing a 6.
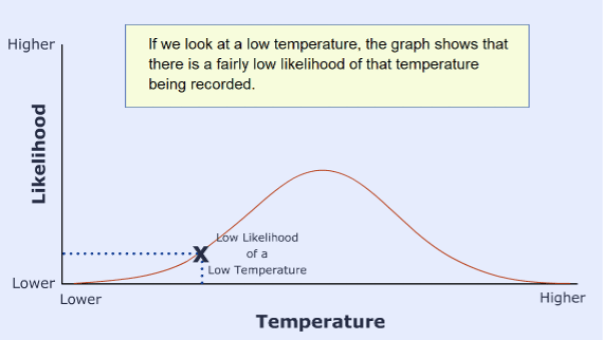
In general, if the climate warms, the whole bell-shaped curve of temperature for a particular place shifts to warmer temperatures:
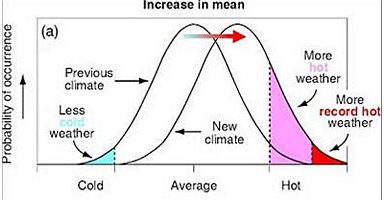
Taken from the Synthesis report on Climate Change, 2001, ipcc.ch
Record hot events are more likely in a warmer world, and record cold events are less likely.
So, for example, we can say that the hot summer of 2003, which killed 22,000 – 35,000 people in central Europe, is twice as likely because of the global warming that has resulted from the man-made emissions of greenhouse gases. By 2050, we can expect summers as hot as that every other year.
Similarly, in the U.K., we can expect the number of extremely rainy days, with associated flooding, to increase. Already, the kind of rainfall that you could have expected once every 30 years in the 19th century is happening once every 12 years now. By the end of the century, it could be expected every 4 years.
So, we can adapt the earlier phrase about weather and climate to
“Climate is what you affect, weather is what gets you“
So, to summarise:
The animations were originally developed by climateprediction.net and The University of Oxford Department for Continuing Education (Technology Assisted Life-long Learning Unit).
What affects the climate of the Earth? Why has the temperature of the Earth stayed approximately the same over very long periods of time, without varying by hundreds of degrees?
The temperature of the Earth can be represented by the level of water in a bucket which has a hole in the bottom and water flowing in from a tap at the top…
Click on the arrow to find out how it works.
The amount of water flowing out of the hole in the bucket is determined by the depth of water in the bucket – the higher the water level, the greater the pressure in the water and the more water is forced out of the hole. So, if you open the tap, the water level rises until the rate water leaves the bucket is again equal to the rate water is flowing in from the tap.
If you close the tap, the water level falls until the rate water leaves the bucket is again equal to the rate water is flowing in.
But how does this relate to the climate?
Our tap pouring water into a bucket with a hole is a simple way of looking at the temperature of the Earth.
The water flowing from the tap represents the energy from the Sun, the water escaping from the hole in the bucket represents the energy the Earth loses to space, and the water level in the bucket represents the temperature of the Earth.
The amount of energy the Earth loses to space is simply determined by the temperature of the Earth’s atmosphere. If the Earth were to get more energy from the Sun the temperature of the atmosphere would rise, just like the water level in the bucket, until the amount of energy it’s losing to space is again equal to the amount of energy it’s getting.
At its simplest level, whether or not the Earth is heating up or cooling down is determined by the difference between the amount of energy the Earth is getting from the Sun and the amount of energy it is losing to space.
Since the Industrial Revolution, the increasing amount of greenhouse gas in the atmosphere has been restricting the amount of energy the Earth is losing to space – as if the hole in the bucket were partially blocked. As a result, the Earth is heating up. If we were to stop increasing the amount of greenhouse gas in the atmosphere, the Earth would eventually (in a few decades) reach a new, constant, warmer, temperature.
It’s worth noting that if you were to leave the tap alone, but suddenly poured another load of water into the bucket in one go, the water level would rise abruptly. The water pressure would also increase abruptly, and so would the flow of water through the hole. As the water level fell back down to its original level, the flow of water through the hole would also slow until the water level stabilised at its original level.
In the same way, if something suddenly adds a lot of heat to the atmosphere (imagine a massive wildfire, maybe) then that heats the atmosphere locally, making it lose more energy to space. As the atmosphere slowly cools down, the energy lost to space also reduces, until the atmosphere returns to the temperature it had before the fire.
Adding heat to the atmosphere does not change the climate. Changing the composition of the atmosphere (for example by adding greenhouse gases), does.
The animations were originally developed by climateprediction.net and The University of Oxford Department for Continuing Education (Technology Assisted Life-long Learning Unit).