How does climate relate to the weather?
We like to talk about the weather, to complain about its variability and to blame the weather forecasters for getting it wrong. But what is ‘climate’, and how does the weather we experience on a day-to-day basis relate to climate change, a subject which is increasingly dominating our newspapers and television screens? Why is it that we can’t make a perfect weather forecast? How can we hope to predict the climate of the 21st century, when we can’t say what the weather will be doing in a week’s time? If the climate changes, how does the weather change?
Firstly, how does the climate relate to the weather we experience on a day-to-day basis? We know from experience that the weather can be very different from one day to the next, let alone from one year to the next, without any change in the climate.
Surprisingly, dice are a good way to think about the difference between weather and climate…
The animation below allows you to choose how many times to roll a dice and then see how often you get each of the six sides. Try a low number of rolls, then try some larger number of rolls and see what happens:
Throw the dice a few hundred times. What is the average (mean) of the scores? The more throws, the closer the average gets to 3.5. If you were to throw the dice one more time, you would not be able to predict the number that the dice would land on, as the probability of throwing each number is the same. However, you could be very confident that the mean would still be 3.5.
But what has this got to do with weather and climate?
What if we associate weather types (for example, cloud cover) with each number on the dice?
Try rolling the dice in the animation, again explore what happens as the number of rolls increases.
As when there were numbers on the sides of the die, you can’t predict what the weather will be on the next throw. Climate is defined as being the average of the weather over a long (typically 30 years) period of time. The ‘climate’ of this die is 50% cloud cover. A single throw of 0% or 100% cloud cover won’t affect the climate very much if you are taking the average of 100s of throws. In the same way we can have a very hot summer one year, and a very wet one the next, without the climate, the weather we expect to happen, necessarily changing.
“Climate is what we expect, weather is what we get“
So why do the weather forecasters never get it totally right? Mostly because the weather is a ‘chaotic’ system.
Very small changes to the starting conditions can lead to completely different weather patterns developing. This observation led Ed Lorenz to suggest that the flap of a butterfly’s wings in the Amazon rainforest could lead to a tornado in Texas. It is very unlikely, but it could.
This means that, to make a perfect weather forecast, we need to know what the atmosphere is doing currently, down to the scale of individual butterflies flapping their wings, which is obviously impossible!
So, since tiny changes in the starting conditions of a weather system can make significant differences to the outcome, when making a forecast we have to try to take into account what might be happening now, as well as what might happen in the future to affect the atmosphere. The best we can do is to produce a range of forecasts, with some indication of what is most likely, or least likely, to happen.
To help illustrate this, consider throwing two dice instead of one:
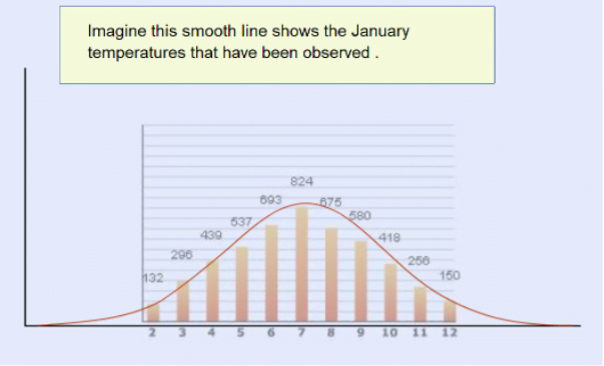
With two dice, the probability of throwing a combined score of a number between 2 and 12 is not the same. There is only one combination of number that would give you a 2 or a 12 (two 1s or two 6s respectively) but, for example, for a combined score of 4 you could throw a 3 and a 1, two 2s or a 1 and a 3 – so you are 3 times as likely to throw 4 as 2 or 12. There are most possible ways of throwing a combined score of 7, and no way at all of throwing a 1 or 13 or more.
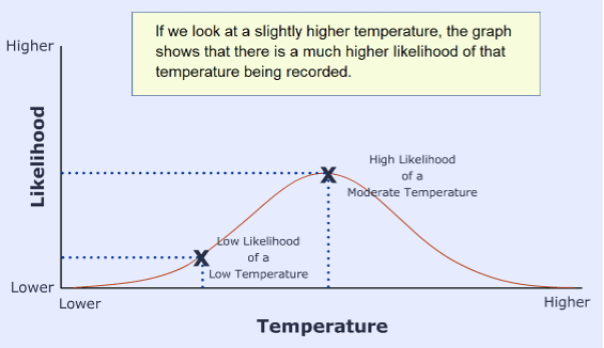
Move the slider to pick a number and throw the dice a large number of times. Notice the shape of the graph that is produced – the middle numbers are rolled more often than the smallest or largest numbers.
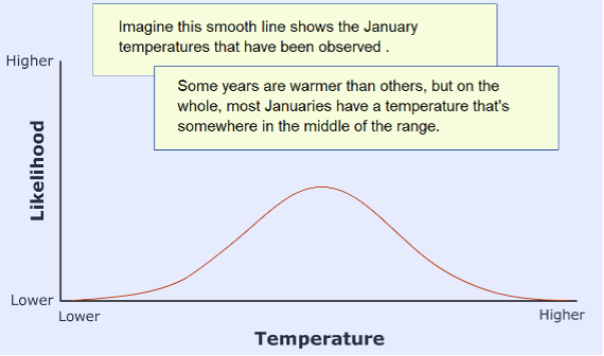
This sort of shape of ‘bell shaped’ graph is very common. For example, temperature measurements will often show a similar distribution, although temperature can of course take any value, not just the numbers one to twelve.

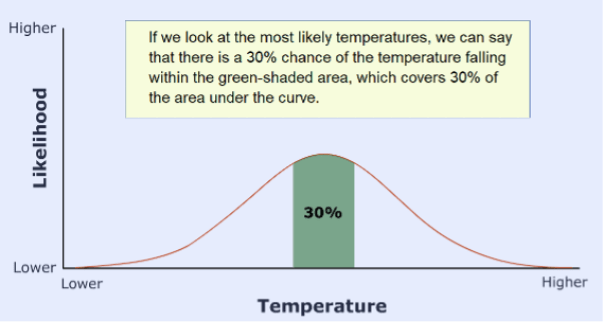
In this way, the results of many weather and climate forecasts can be combined to show what is most likely to happen, what is unlikely to happen and what almost definitely won’t happen.
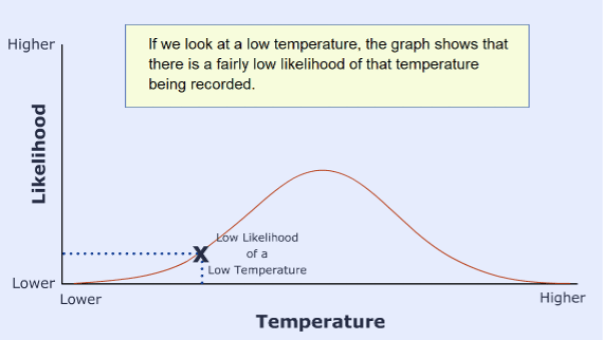
But what about extreme events? How will the likelihood of an extreme event change as the climate warms? It is never possible to attribute one particular event to a particular cause. To go back to the dice example, you could load a die so that sixes occur twice as often as normal. But if you were to throw a six using this die, you could not blame it specifically on the fact that the dice had been loaded. Half of the sixes would have occurred anyway, even with a normal die. Loading the die just doubles the odds of throwing a 6.
In general, if the climate warms, the whole bell-shaped curve of temperature for a particular place shifts to warmer temperatures:
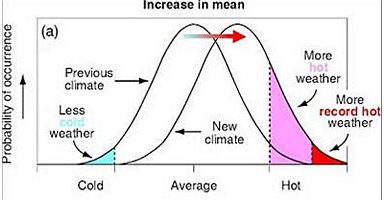
Taken from the Synthesis report on Climate Change, 2001, ipcc.ch
Record hot events are more likely in a warmer world, and record cold events are less likely.
So, for example, we can say that the hot summer of 2003, which killed 22,000 – 35,000 people in central Europe, is twice as likely because of the global warming that has resulted from the man-made emissions of greenhouse gases. By 2050, we can expect summers as hot as that every other year.
Similarly, in the U.K., we can expect the number of extremely rainy days, with associated flooding, to increase. Already, the kind of rainfall that you could have expected once every 30 years in the 19th century is happening once every 12 years now. By the end of the century, it could be expected every 4 years.
So, we can adapt the earlier phrase about weather and climate to
“Climate is what you affect, weather is what gets you“
So, to summarise:
- Even with perfect forecasting techniques, we could never say exactly what the climate will do over the next century. This is because:
- weather is chaotic
- we don’t know how the world will develop and how much greenhouse gas will be emitted
- We don’t know what other, natural, factors may affect the climate in the future – volcanic eruptions, changes in solar activity etc.
- We can, at best, say what the climate is most likely to do, and what it probably won’t do.
- The longer into the future a forecast is made, the less certain you can be about what will happen.
- We can expect extreme events – such as abnormally hot seasons and storms, to become more frequent in a warmer world.
The animations were originally developed by climateprediction.net and The University of Oxford Department for Continuing Education (Technology Assisted Life-long Learning Unit).