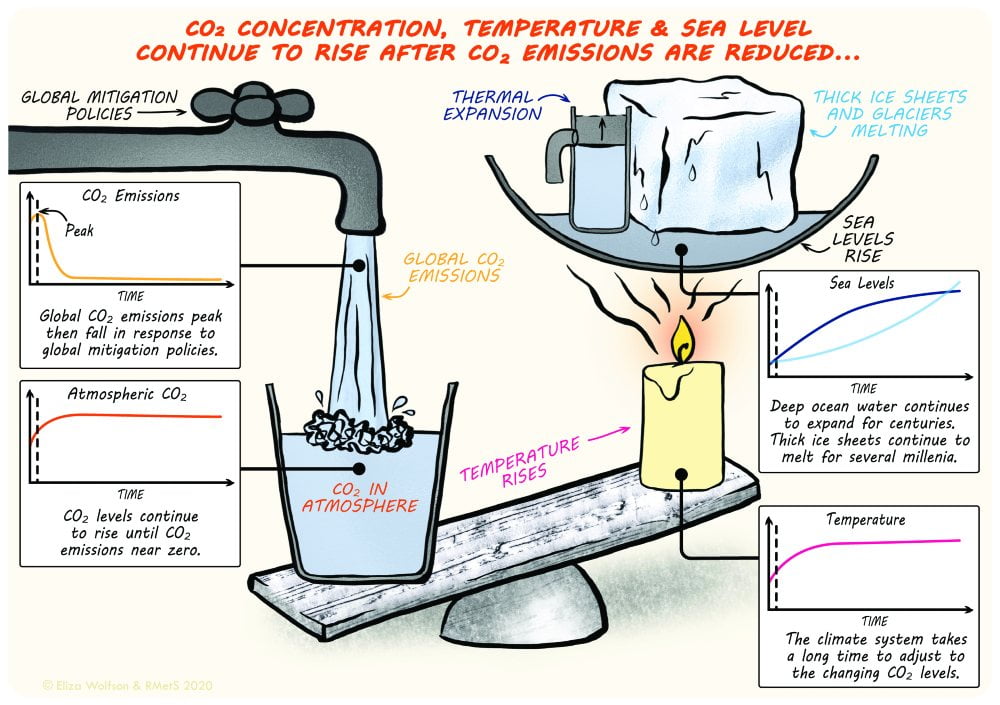
It is the concentration of greenhouse gases in the atmosphere, rather than the emissions at a particular moment in time, which determines the temperature of the Earth.
How the concentration of Carbon Dioxide changes is determined by the balance between the amount of carbon dioxide going in to the atmosphere, and the amount being taken out. Change the flow rate using the + and – buttons on the animation below, where the water level in the bath represents the concentration of greenhouse gases in the atmosphere.
In the furthest left position, there is less (no) carbon dioxide being added to the atmosphere than is being taken out by natural and human processes. The concentration of carbon dioxide in the atmosphere falls.
In the second position, the same amount of carbon dioxide is being added to the atmosphere than is being taken out by natural and human processes. The concentration of carbon dioxide in the atmosphere stays the same.
In the third position, there is slightly more carbon dioxide being added to the atmosphere than is being taken out by natural and human processes. The concentration of carbon dioxide in the atmosphere rises.
In the fourth position, there is much more carbon dioxide being added to the atmosphere than is being taken out by natural and human processes. The concentration of carbon dioxide in the atmosphere rises rapidly.
Even if emissions fall (position 3), as was the case briefly in 2020 when COVID19 related restrictions reduced global emissions, the concentration of greenhouse gases in the atmosphere continues to rise.
The relationship between emissions, concentrations, global temperature and sea level

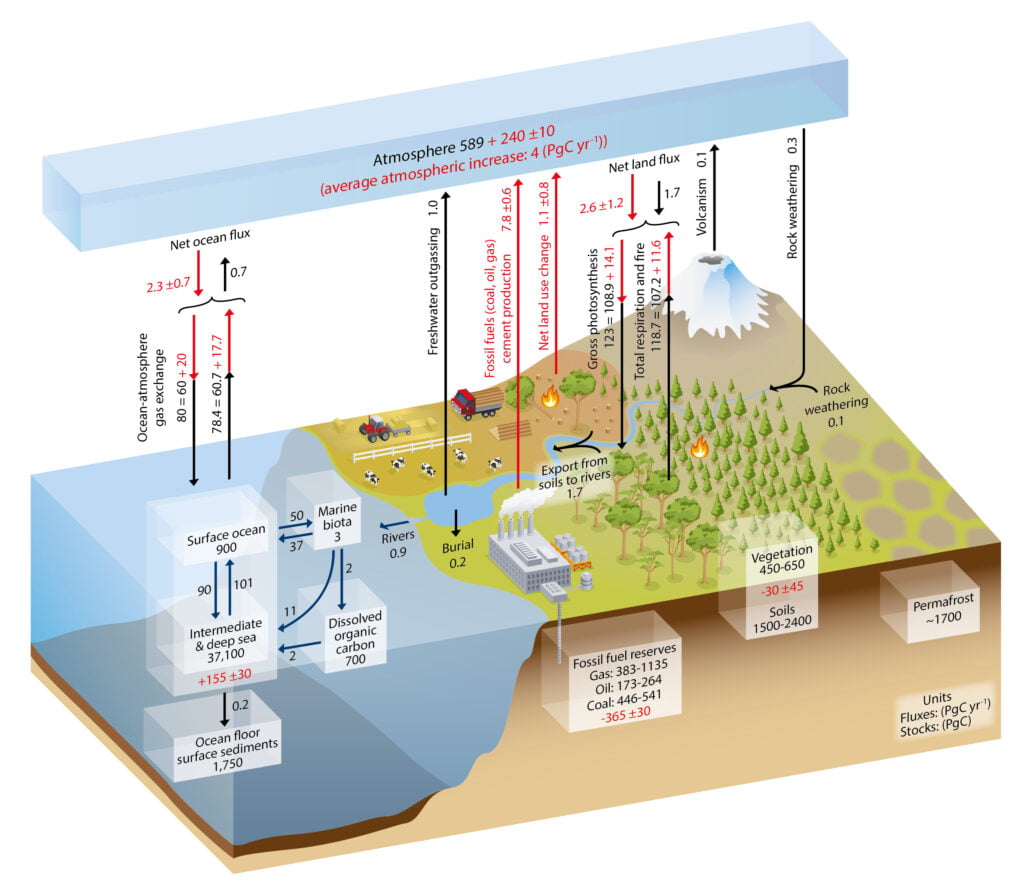
Even before humans were around, there was a constantly evolving balance of greenhouse gases in the atmosphere. Natural sources, such as respiring animals, the decomposition of organic matter, volcanoes, rock weathering, freshwater outgassing and ocean-atmosphere exchange of gases are balanced by photosynthesis and ocean-atmosphere exchange of gases.
Humans have added additional sources and sinks, as are summarised by this diagram from the IPCC:

WG1 Chapter 6, figure 1. The numbers represent carbon reservoirs in Petagrams of Carbon (PgC; 1015gC) and the annual exchanges in PgC/year. The black numbers and arrows show the pre-Industrial reservoirs and fluxes. The red numbers and arrows show the additional fluxes caused by human activities averaged over 2000-2009, which include emissions due to the burning of fossil fuels, cement production and land use change (in total about 9 PgC/year). Some of this additional anthropogenic carbon is taken up by the land and the ocean (about 5 PgC/year) while the remainder is left in the atmosphere (4 PgC/year), explaining the rising atmospheric concentrations of CO2. The red numbers in the reservoirs show the cumulative changes in anthropogenic carbon from 1750-2011; a positive change indicates that the reservoir has gained carbon.
IPCC, 2013: Climate Change 2013: The Physical Science Basis. Working Group I Contribution to the Fifth Assessment Report of the Intergovernmental Panel on Climate Change, Cambridge University Press, Cambridge, United Kingdom and New York, NY, USA.
More processes could be added to this picture in the future, such as carbon capture and storage.
This animation was adapted from an infographic produced by the IPCC https://www.ipcc.ch/sr15/mulitimedia/worlds-apart/
Other related links


