Download editable worksheet.
This can be used to create a case study of a named depression in the UK. Below, we have given an example of how the worksheet could be used to create a case study of Storm Eunice.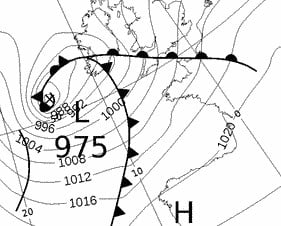
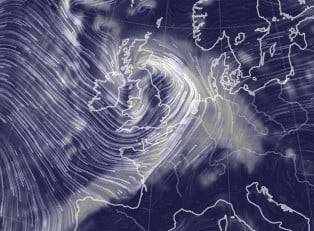
In the UK, storms have been given names since 2015. A storm is named if it is likely to have a significant impact on the UK or Ireland.
- Write down the names of any recent storms you can remember. Eunice
- Use the Met Office storm centre index to discover the date that one of those storms had an impact on the UK/ Ireland (if your storm isn’t in the current year, scroll to the bottom of the page to the Related Links section for previous years).
Storm Name: Eunice Date: 18th February 2022
Now download the weather charts for the storm.
In the bottom left of the page, where is says ‘Archiv – Basistermin, enter the date of the storm in the format day – month – year
3) Copy and paste the weather map onto this document.
4) Put a red circle around the centre of the storm. This is marked by a cross and the pressure value at the centre of the storm is given.
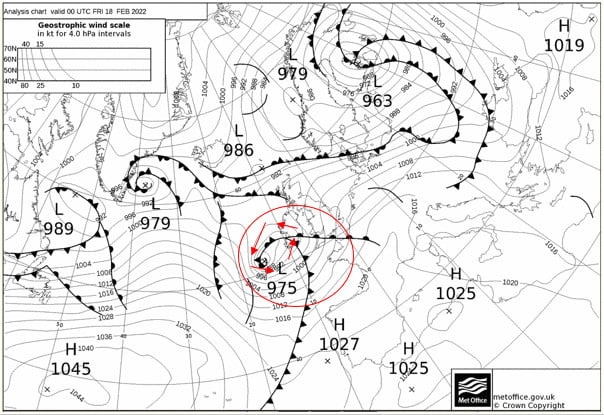
Now use the single forward arrow to advance the chart by 6 hours.
5) Copy and paste the weather map onto this document.
6) Put a red circle around the centre of the storm
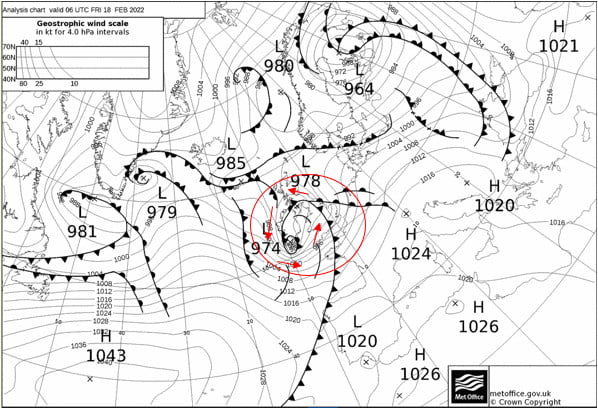
Now use the single forward arrow to advance the chart by 6 hours.
7) Copy and paste the weather map onto this document.
8) Put a red circle around the centre of the storm
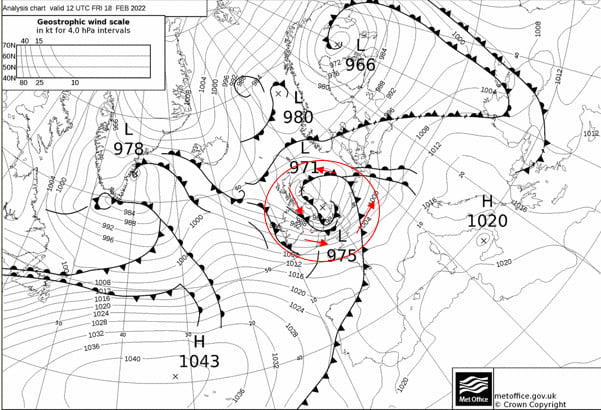
9) Now complete the table using information from your three weather maps:

Winds rotate around a depression in an anticlockwise direction, following the pressure contours.
10) Use ‘insert’ and ‘shapes’ to add arrows showing the wind direction around the storm to the first of your weather maps.
In addition to naming storms, sometimes colour coded weather warnings are given. The colour of the warning depends on a combination of how much damage the storm is expected to do, and how likely that damage is. So a storm that is very likely to cause a lot of damage is given a red warning, but a yellow warning could mean that a storm is either very likely to cause a bit of damage, or unlikely to cause a lot of damage.
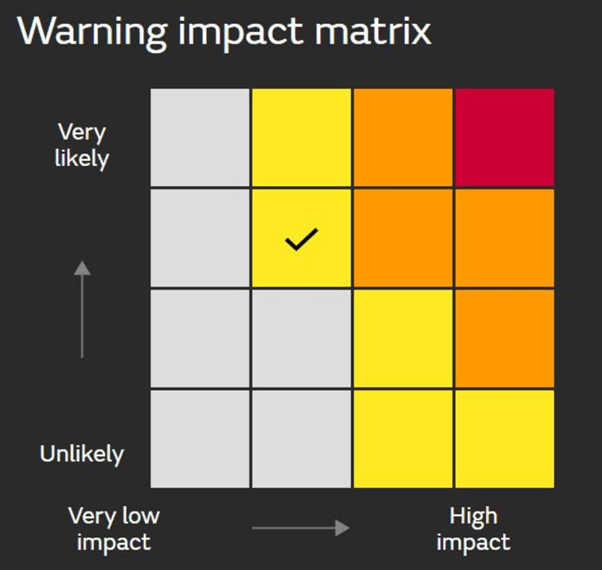
11) Go back to the Met Office storm centre https://www.metoffice.gov.uk/weather/warnings-and-advice/uk-storm-centre/index and click on your storm’s name – this should give you a summary sheet about your storm. Scroll through it – were any weather warnings issued? List them below, or write ‘none’.

Extension
Use the Met Office summary sheet you just opened, or BBC news https://www.bbc.co.uk/news to write a paragraph about the impacts of your storm.
Storm Eunice had significant impacts, including four fatalities and significant wind damage. However, with weather warnings issued almost a week in advance, the precautionary measures people were able to take, for example closing schools, meant that damage was minimised.
