Fronts
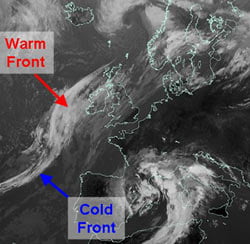
A front is the boundary between two different types of air mass. In our latitudes a front usually separates warm, moist air from the tropics and cold, relatively dry air from polar regions.
Fronts move with the wind, so in the UK this is normally from west to east because our prevailing winds are from the west or southwest. At a front, the heavier cold air undercuts the less dense warm air, causing the warm air to rise up over the wedge of cold air.
As the air rises there is cooling and condensation, thus leading to the formation of clouds and rainfall. Consequently, fronts tend to be associated with cloud and rain. Three types of front can be identified; warm fronts, cold fronts and occluded fronts.
Warm front
A warm front marks the leading edge of a warm air mass. The presence of a warm front means that the warm air is advancing and rising up over the cold air. This is because the warm air is ‘lighter’ or less dense, than the colder air. Warm air is thus replacing cold air at the surface.
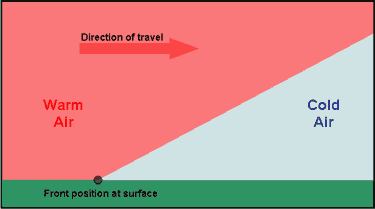
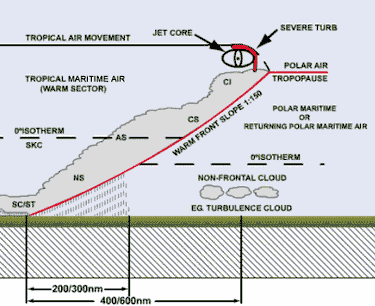
Cloud extends well ahead of the front, becoming thicker as the front approaches, accompanied by falling pressure. Rain then starts to fall, usually becoming heaviest on the front itself.
The passage of the front is followed by a rise in temperature and humidity and a veer in the wind, while the pressure also stops falling. Although the rain dies out, it often stays cloudy.
On windward coasts and hills, the cloud base may be low enough to give fog and thick enough to produce drizzle. Inland and to the lee of hills, the cloud may break, allowing for some warm sunshine.
Cold front
This marks the leading edge of colder air. The presence of a cold front means that cold air is advancing and pushing underneath warmer air. This is because the cold air is ‘heavier’ or denser, than the warmer air. Cold air is therefore replacing warmer air at the surface.
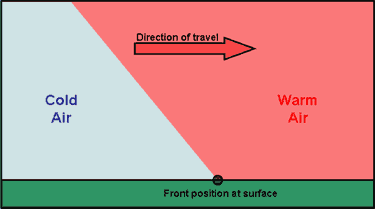
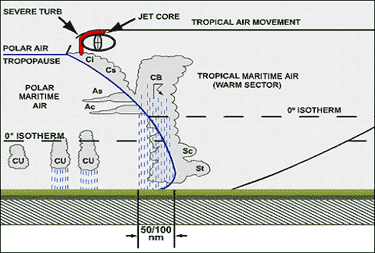
Pressure begins to fall increasingly rapidly as the front approaches and rain usually starts not long before it arrives, becoming heavy for a short time. This is often accompanied by an increase in and a backing of the wind. In some cases, there may also be hail and thunder.
The passage of the front is usually marked by a sharp change from falling to rising pressure and a veer in the wind.
As the rain dies away, the cloud lifts and breaks and, although there is sunshine, the air temperature falls.
After a time, cumulus clouds begin to form, often bringing showers. Sometimes the showers may become heavy, perhaps even accompanied by hail and thunder. On the other hand, in some cases, pressure will rise rapidly after a cold front has passed and this causes there to be few, if any, showers.
Occluded front or occlusion
Occlusions are slightly more complex than warm or cold fronts. They occur because cold fronts travel more quickly than warm fronts and eventually this results in the cold front ‘catching up’ with the warm front.
This causes the warm air to be undercut and lifted up from the surface.
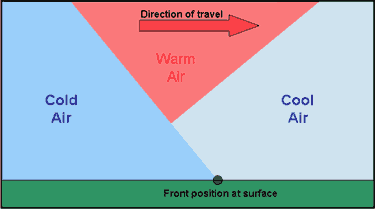
The characteristics of an occlusion are similar to those of a cold front in that the rain belt is narrow.
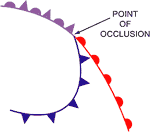
Cloud lifts and breaks after the front has moved through and there may be a change in temperature and a veer in the wind, though these tend to be small.
Trough
Whereas fronts separate air masses, which are different in temperature, troughs generally develop in cold air and are characterised by an increase in the frequency and intensity of showers. Pressure begins to fall as the trough approaches and often rises sharply once it has passed. As with fronts, the wind tends to back ahead of the trough and to veer immediately behind it. There are also particularly strong gusts of wind in the showers
- Fronts form as the result of ‘conflict’ between warm and cold air
- Fronts are the boundary between two air masses
- The most significant weather occurs on fronts, since that is where the air is rising fastest
Frontal Depressions
Introduction
Development of a depression
Weather associated with a classic depression
Introduction
A depression is an area of low pressure and is associated with unsettled weather. This is due to the fact that the air within the depression is rising, causing it to cool and the water vapour within it to condense into clouds. This rising air within a depression causes an area of low pressure at the surface. The deeper the depression (or low), the more unsettled the weather.
Consequently, the weather associated with a depression is often cloudy, wet and windy. However, weather is not uniformly distributed around a depression. Different parts of it have very different types of weather, which also vary through its lifetime. The most significant weather (cloud and precipitation) occurs in discrete lines or fronts. In the northern hemisphere winds blow anticlockwise around areas of low pressure; this is reversed in the southern hemisphere.
Development of a depression
Stage 1 – Origin and infancy
The depression usually starts life as a wave, shown on a chart by ‘buckling’ on a front. At this stage, the air is warm to the south of the front and relatively cold to the north of it. The weather in the warm air can vary from fine and sunny to cloudy, sometimes with drizzle and perhaps even with fog. The type of cloud is layered or stratiform and is not very thick. In the cold air, there is usually some cloud, but it tends to be more broken, appearing as discrete speckles on a satellite image. The cloud is cumuliform and can often be large enough to produce showers. Figure 7 shows an example of a ‘wave’ on a synoptic chart, whilst Figure 8 shows the infrared satellite image for the same time.
- In warm air, the weather can vary from warm and sunny to dull and drizzly
- Colder air is more showery, but with some sunshine too.
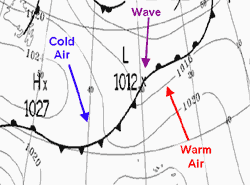
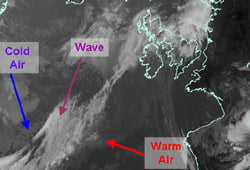
Stage 2 – Maturity
As the depression develops, the pressure around it falls, leading to more tightly packed isobars. This causes winds to be stronger and, at the same time, the buckle in the front becomes much more marked (see Figure 9), with distinct warm and cold fronts being formed. Warm air is pushed towards the north while colder air drives southwards. The region between the warm and cold front is called the warm sector. The cloud near the fronts thickens and the frontal zone becomes broader, which means that rain is more prolonged, becoming heavier nearer the front. However, it is often the case that one front is more active than the other. At this stage, the heaviest rain occurs near the centre of the low. Figure 9 shows an example of a mature ‘depression’ on a synoptic chart, whilst Figure 10 shows the infrared satellite image for the same time.
- The weather on or near a front is usually cloudy, with precipitation that may vary from virtually nothing on a weak front to a torrential downpour on a particularly active one
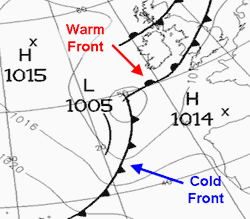
Stage 3 – Occlusion
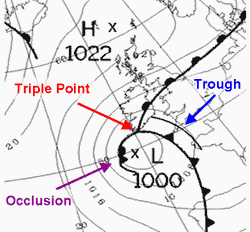
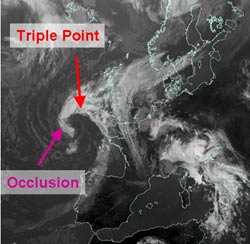
The fronts move at a speed indicated by the separation between the isobars along them, although the speed of the warm front is about two-thirds of this. Consequently, the cold front is usually faster than the warm front. Cold air is denser than warm air, which it replaces at the surface, causing the warm air to lift and the warm sector to become progressively smaller. The cold air increasingly undercuts the warm air, initially from near the centre of the low, leading to the development of an occluded front, or occlusion (see Figure 11).
The rainfall usually becomes more sporadic on an occlusion, with the heaviest rain occurring near the triple point (see Figure 11), where all three types of front meet. By this stage, a depression is now in its mature stage, the pressure of its centre stops falling and starts to rise. Cold air has been brought well to the south, often over areas with higher surface temperatures. This can lead to particularly heavy showers, some of which may be thundery. Showers sometimes become organised into lines, which can be indicated on the weather chart by troughs (see Figure 11). Figure 11 shows an example of an occluded depression on a synoptic chart, whilst Figure 12 shows the infrared satellite image for the corresponding time.
- Troughs are organised lines of precipitation, which can often be quite heavy
Stage 4 – Death
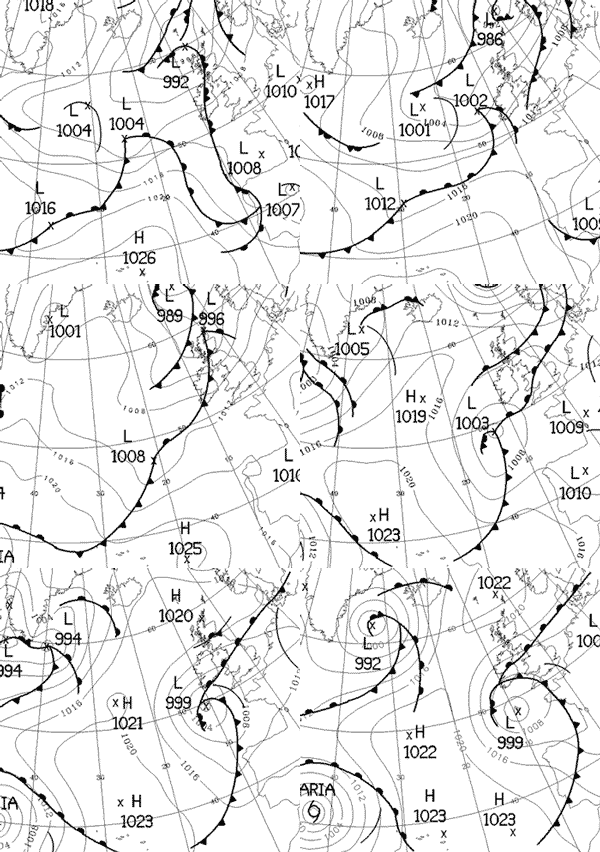
Eventually the frontal system dies as all the warm air has been pushed up from the surface and all that remains is cold air. The occlusion dies out as temperatures are similar on both sides of the front.
Weather associated with a classic depression
Every depression is different and hence the weather associated with each depression is also unique. However the weather associated with the passage of a classic depression does follow some general trends. Table 1 details the changes associated with the passage of both warm and cold fronts, whilst Figure 14 shows a cross section through a mature depression.
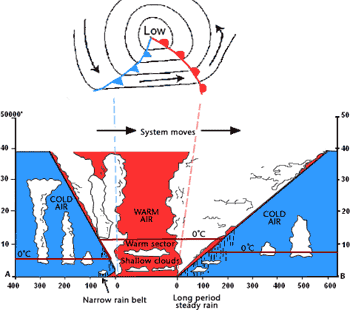
| TABLE 1: WEATHER ASSOCIATED WITH THE PASSAGE OF A CLASSIC DEPRESSION | |||||
|---|---|---|---|---|---|
| AHEAD OF THE WARM FRONT | PASSAGE OF THE WARM FRONT | WARM SECTOR | PASSAGE OF THE COLD FRONT | COLD SECTOR | |
| Pressure | starts to fall steadily | continues to fall | steadies | starts to rise | continues to rise |
| Temperature | quite cold, starts to rise | continues to rise | quite mild | sudden drop | remains cold |
| Cloud cover | cloud base drops and thickens (cirrus and altostratus) | cloud base is low and thick (nimbostratus) | cloud may thin and break | clouds thicken (sometimes with large cumulonimbus) | clouds thin with some cumulus |
| Wind speed and direction | speeds increase and direction backs | veers and becomes blustery with strong gusts | remain steady, backs slightly | speeds increase, sometimes to gale force, sharp veer | winds are squally |
| Precipitation | none at first, rain closer to front, sometimes snow on leading edge | continues, and sometimes heavy rainfall | rain turns to drizzle or stops | heavy rain, sometimes with hail, thunder or sleet | showers |
For more background information about mid-latitude weather systems and their associated weather, watch our weather systems video.
Other types of depression (or low)
Polar lows
Thundery lows
Lee lows
Polar lows
Polar lows form in cold air, mainly in winter or spring, and tend to be quite small. They usually originate from eddies that form to the lee of high ground. They produce showers that are wintry in nature and which sometimes become aligned into troughs. When they come across land, they can produce quite large amounts of snowfall. Figure 15 shows an example of a polar low on a synoptic chart, whilst Figure 16 shows the infrared satellite image for the corresponding time.
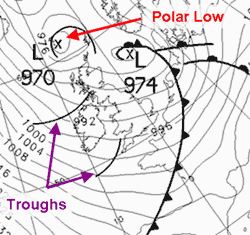
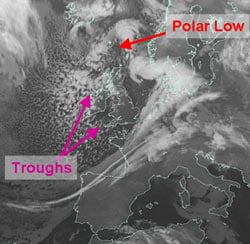
Thundery lows
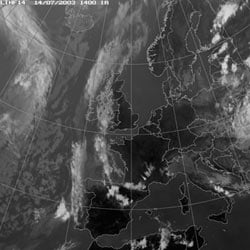
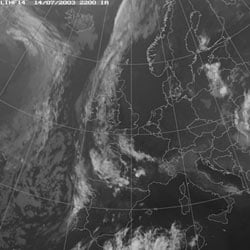
Thundery lows form over hot land in summer and can produce a large number of thunderstorms. These thunderstorms can also become aligned into troughs, giving spells of particularly intense downpours with hail, occasionally accompanied by tornadoes or waterspouts.
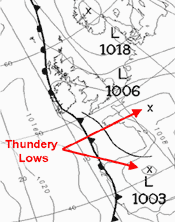
Figure 17 shows an example of thundery lows over France and Spain on a synoptic chart. Figures 18 and 19 show satellite images for the same day, showing the development of thunderstorms during the day.
Lee lows
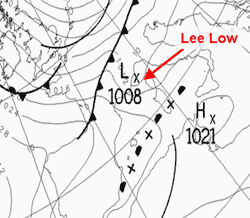
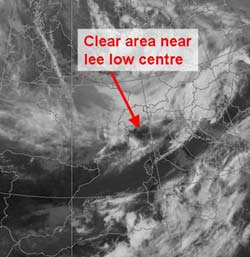
Lee lows form to the lee of high ground when strong winds are blowing directly against a ridge. They don’t produce any particular type of weather, but winds around them can be very unpredictable in both speed and direction. Figures 20 and 21 show an example of a lee low over the Gulf of Genoa on both a synoptic chart and satellite image.
Anticyclones
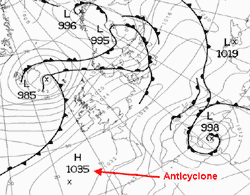
An anticyclone is a region of high pressure. This is the result of the air in the atmosphere subsiding towards the earth’s surface. This subsidence, or sinking motion, leads to the air becoming drier and warmer. In the northern hemisphere winds blow clockwise around areas of high pressure, this is reversed in the southern hemisphere.
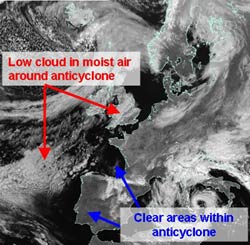
When anticyclones form over land, the skies above are often clear of cloud. During the summer, this means long, sunny days and clear nights. In winter, the longer nights mean that temperatures fall lower, with frost often forming, which may persist all day. The falls in temperature overnight and light winds can lead to fog forming.
When anticyclones are over the sea, the weather can vary from fine and sunny to overcast cloud. This cloud may be thick enough to give drizzle and may fall low enough to produce fog. This happens most often during spring and is least frequent in autumn. If the anticyclone extends over both land and sea, cloud and fog can spread across coastal regions, sometimes reaching quite far inland.
- In summer over land, days are warm or hot and sunny, nights are clear.
- Over the sea, it is sometimes quite cloudy. Drizzle, mist or fog are most likely early in the summer.
- In winter over land, days are often dull and misty, perhaps even foggy. Sunny days tend also to be cold and dry. Nights can be clear and frosty, or become foggy or cloudy.
- Over the sea, the winter weather is much the same as during the summer. Drizzle, mist or fog become more likely as spring approaches.
Now why not have a go at answering some questions about the weather shown on a weather chart.
Web page reproduced with the kind permission of the Met Office.
