3D Print the Weather

The RMetS is delighted to have collaborated with CREATE Education to develop instructions to allow schools to 3D print sections of the Central England Temperature Record and use their models to learn about weather, climate, extreme weather and climate change.

These engaging, tactile resources allow students to get a hands-on experience of what climate is and how it can change, and how extreme weather relates to the climate.

The Central England Temperature (CET) data record is the longest instrument record of temperature in the world, with average monthly temperature each month from January 1659 to December 2018.

This project and the accompanying resources allow you to create 3D models that will represent 10 years of temperature data. The models have been designed to interlink, so students can create a series of models to represent larger timeframes. Once the 3D models have been created and 3D printed, there is a tactile resource that can be used in multiple ways in the classroom to visualise and study past weather and climate, and at how the climate of the UK has been changing over time.

The lesson resources specifically focus on

1. The difference between climate and weather

2. The current climate of the UK

3. The changing climate of the UK

4. Looking at past extreme weather events and researching their impacts on people in the UK.

3D model

Further resources to teach weather, climate, correlation, photosynthesis, regression, the carbon cycle, isotopes and more.

Further resources past climate change teaching resources for secondary geography.

Depressions – Identifying Features

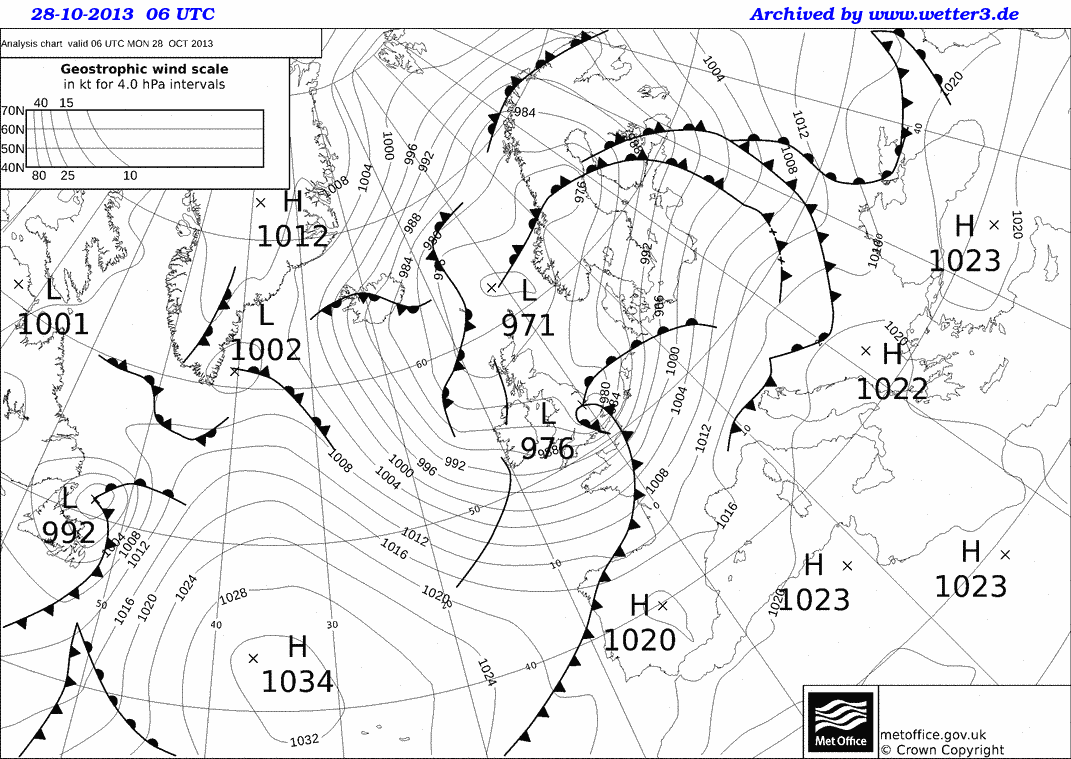
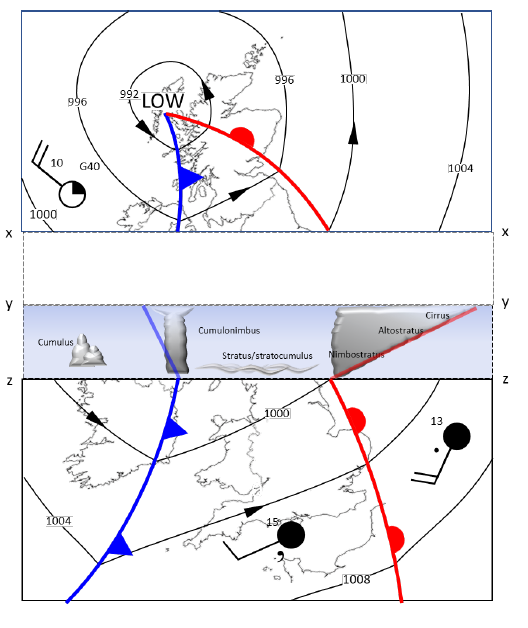
Identify the weather features on the synoptic (weather) chart below:

Cold Front

Warm Front

Highest pressure

Depression

Anticyclone

Isobar

Occluded Front

Strong Wind

Light Wind

Lowest Pressure


Advanced

Northerly Wind

Northwesterly Wind

Southwesterly Wind


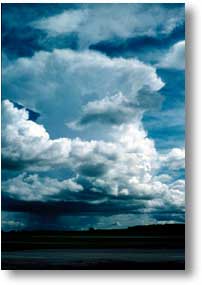
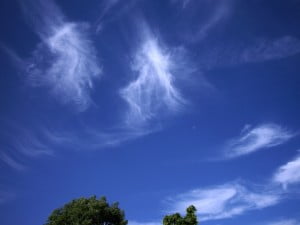
(hint the clouds in the images below are cirrus, cumulonimbus, cumulus and nimbostratus)

cirrus
cumulus
Cumulonimbus
synoptic chart extract

Pop-up Depression

Print, cut-out and fold along the lines to make a 3D model of a depression. 

pop up depression

Drawing Pressure and Temperature Contours (Intermediate)

Drawing Temperature and Pressure Contours

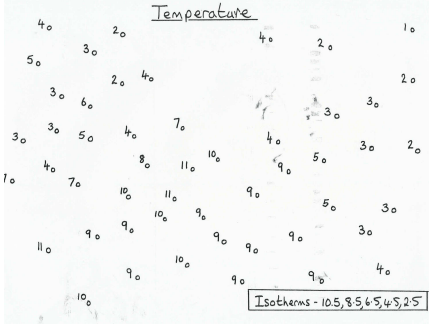
Lines of equal temperature – temperature contours, are called isotherms.

In this exercise, the task is to draw the 8.5°C, 6.5°C and 2.5°C isotherms. The 10.5°C and 4.5°C isotherms have already been drawn to help.

Start with the 8.5°C isotherm. This is the line which has everything warmer than 8.5°C on one side of it, and everything colder than 8.5°C on the other side. You could use a coloured pencil to colour in the dots for everywhere that is warmer than 8.5°C. Your isotherm is then the line which separates your coloured dots from the uncoloured ones.

Next, try the 2.5°C isotherm. For this, you could use a different colour to shade the dots for everywhere that is colder than 2.5°C.

Lastly, draw the 6.5°C isotherm. This will be very close to the 4.5°C isotherm in places, so be careful! To help with this, you could use a 3rd colour to shade the places where the temperature is 7 or 8°C, and a 4th colour to shade the places where the temperature is 5 or 6°C. Your line will divide the two.

Remember, contours can never touch or cross each other (it can’t be 8.5°C and 6.5°C at the same place!). The line should start and finish at an edge of the page.

Drawing of isotherms

Lines of equal pressure – pressure contours, are called isobars.

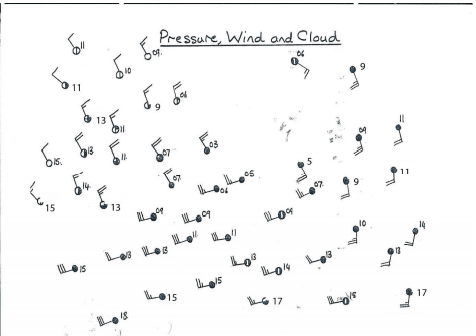
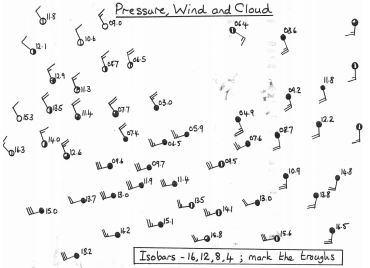
In this exercise, the task is to draw the 1016, 1012, 1008 and 1004mb isobars. However, to save space on the map, the pressure values have been recorded in shorthand – so 9 or 09 is short for 1009, 11 is short for 1011 etc.

On this map, we have some extra clues – these weather observations indicate the wind speed by the tail on the symbol. The wind is blowing from the tail of the arrow to the centre (the bars on the tail of the arrow tell you the wind speed) so –o is a wind blowing from the west to the east, or o—is a wind blowing from the east to the west. The wind tends to blow along the pressure contours, so your contours need to be roughly parallel to the tails on the closest weather symbols.

Start with the 1016mb contour. Where on the map are there places where the pressure is higher than that? If it helps, colour in those symbols where the value is greater than 16. Your pressure contour needs to divide those symbols from the others.

Now use a different colour to shade the symbols where the pressure value is 13, 14 or 15. Can you now draw the 1012mb isobar?

Again, use a different colour to shade the symbols where the pressure value is 9, 10 or 11. Can you now draw the 1008mbar contour?

Lastly, is there anywhere where the pressure is under 1004mb? If so, draw the 1004mb contour to separate off that observation from the others.

Drawing of isobars

These two maps both correspond to the same weather situation. Can you work out what is going on?

Clues:

– Where is the pressure lowest?

– How is the wind direction changing across the map?

– In general, where is the temperature lower and where is it higher?

– Where is the temperature changing most rapidly? Remember that a front is where cold and warm air meets. You can use the wind information on the second map to see where the cold air is pushing into the warm air (a cold front) or whether the warm air is pushing into cold air (a warm front).

Drawing Pressure and Temperature Contours (Harder)

Drawing Isobars

Isobars are lines of constant pressure. Drawing the isobars reveals features (eg highs, lows, ridges and troughs) which help us understand the weather.

When trying to draw isobars, remember the following

– You are trying to draw the isobars of pressure for the values below the
graph

– The symbols on the map give the observed pressure and wind speed and
direction. Remember that the wind is blowing from the tail of the arrow
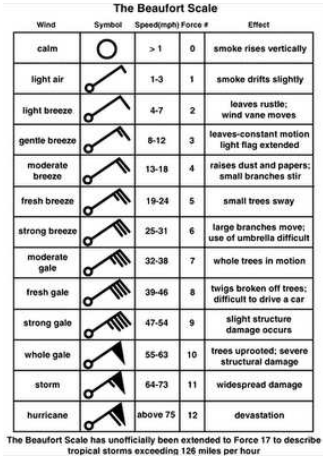
to the centre. The bars on the tail of the arrow tell you the wind speed:

– The wind blows almost parallel to the isobars (they are usually blow
slightly more towards the centre of the low pressure area). If you stand
with your back to the wind in the northern hemisphere the pressure is
lower on your left than on your right.

– Isobars tend to be parallel to each other, don’t wiggle and never cross.

– The closer the isobars are to each other, the stronger the wind. You can
use the bars on the tail of the weather station symbol to give you the
Beaufort force of the wind. Look at the scale at the top of the map (this is
called the ‘geostrophic scale’). The distance from the left hand edge of
the scale to the force at the symbol gives you the spacing between 2mbar
isobars at that point.

Beaufort scale

Draw the 1004, 1008, 1012 and 1016 isobars (noting that they have been recorded in shorthand, such that 1004 becomes 04 etc.) remembering that the wind tends to blow parallel to the isobars. Can they see what sort of a weather system it is, and where the fronts might be?

Drawing of isobars

Draw the 2.5, 4.5, 6.5, 8.5 and 10.5 isotherms (lines of equal temperature), remembering that sometimes, if there isn’t any data in a particular place, you have to make an educated guess about what the contour might look like. Is it more obvious now what the structure of the weather system is?

Drawing of isotherms

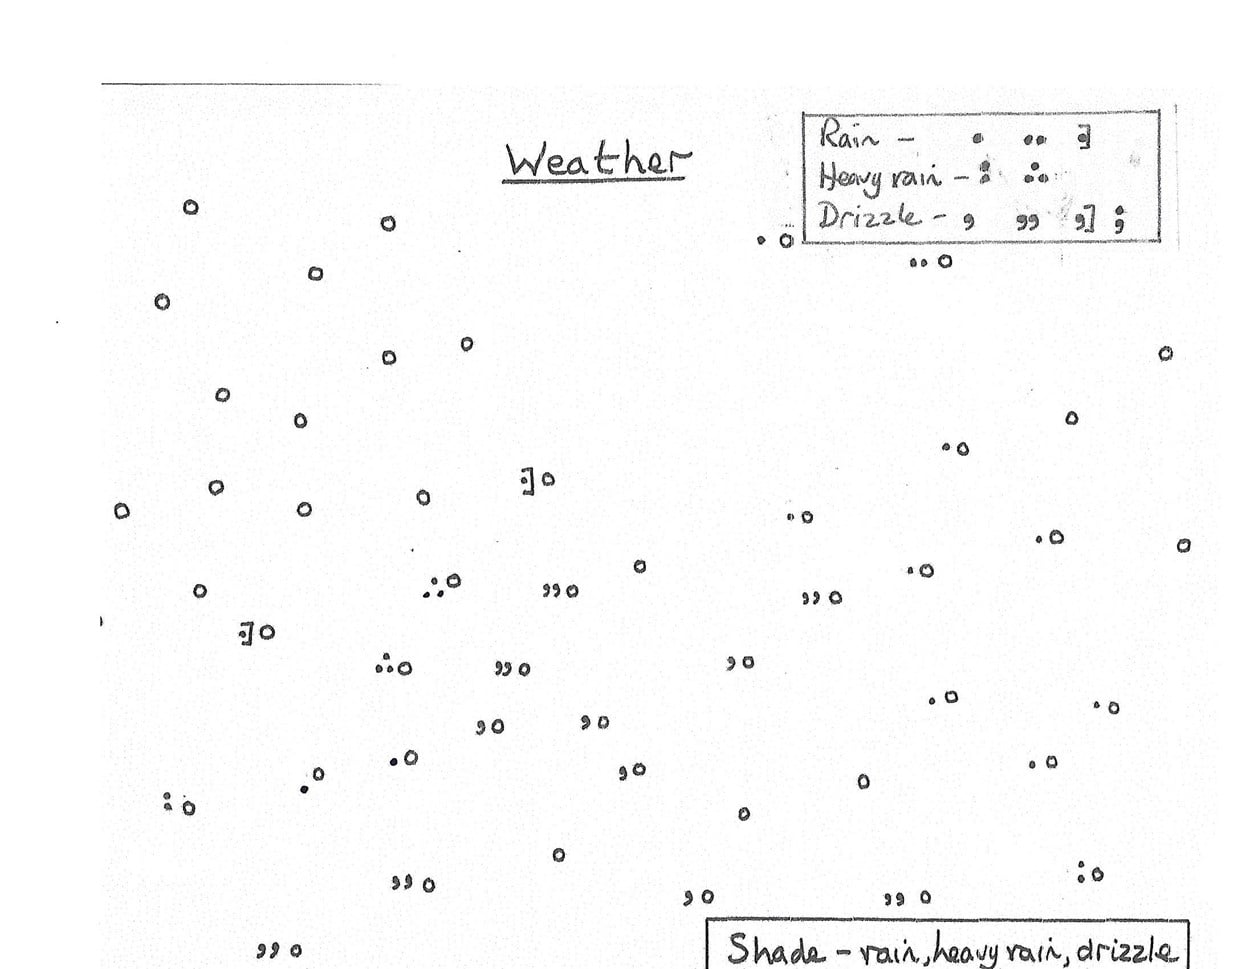
Shade the areas of rain, heavy rain and drizzle in the map below. Is it more obvious now what the structure of the weather system is?Weather map

Eva – A Case Study of a Depression

A Case Study of a Weather System using WOW data

Go to the WOW website wow.metoffice.gov.uk

Use the pop up calendar to select 24th December 2015 and the drop down box to choose 0600 to 0659 in the morning.

Use the Layers menu on the right to select wind speed/ direction.

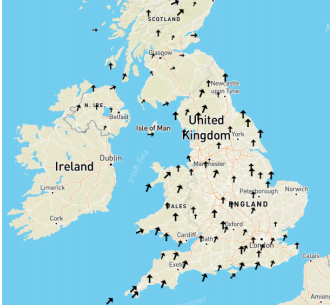
Use the Filters menu to select only official observations.Map of the UK showing wind direction

Where is the wind coming from?

Is the wind weak or strong?

Change the time to 0800-0859. How does the wind look now?

Change the time to 1200-1259. How does the wind look now?

Capture the image, stick it into a work book

NOW USE THE LAYERS MENU TO LOOK AT TEMPERATURE.

At 0600-0659, what are the temperatures across the U.K.? (You may need to click on some dots to work out exactly what the temperature is)

Capture the image, stick it into a work book at draw a line roughly dividing colder and warmer temperatures. What is a line dividing cold and warm temperatures called?

Now look at the temperature between 0800-0859. What is the pattern of temperatures?

Now look at the temperature between 1200-1259. What is the pattern of temperatures?

Capture the image, stick it into a work book at draw a line dividing colder and warmer temperatures.

Now compare this image and the line you have drawn on it with the wind image you captured earlier. What do you notice?

CHALLENGE YOURSELF:

Find the Met Office Weather Station in Glasgow/ Bishopton, and click on it. Click on ‘View Full Observation’ and use the Graph view and the calendars to select from
23/12/15 to 25/12/15. How does the air temperature change?

NOW USE THE LAYERS MENU TO SELECT RAINFALL RATE AT 0600-0659

You’ll also need to add ‘WOW observations’ from the Filter menu because the official observations don’t include rainfall. Where is it raining?

Go back in time, hour by hour, what happens to where the rain is?

NOW USE THE LAYERS MENU TO SELECT ‘PRESSURE’.

Investigate how that changes through the day.

CHALLENGE YOURSELF:

Find the Met Office Weather Station in Glasgow/ Bishopton again, and click on it. Click on ‘View Full Observation’ and use the Graph view and the calendars to select from 23/12/15 to 25/12/15. How does the mean sea level pressure change?

CHALLENGE YOURSELF:

Capture the pressure image from 1200-1259 on 24th December 2015.
Can you sketch pressure contours for 992, 996, 1000, 1004, 1008 and 1012hPa?

Summarise what you think is going on with the weather on the 24th December 2015.

Red Sky – Teachers

Red Sky at Night, Shepherd’s Delight

“Red sky at night, shepherd’s delight. Red sky in the morning, shepherd’s warning” (or sailors rather than shepherds, depending on where in the country you are).

Is there any truth in this saying and, if so, why?


COMMON MISCONCEPTION: SOMETIMES THERE IS CONFUSION ABOUT THIS SAYING. IT IS TRUE THAT WHEN THE AIR IS ‘DIRTY’ – EITHER WITH POLLUTANTS FROM INDUSTRY, VEHICLES ETC OR WITH VOLCANIC ASH, SUNSETS AND SUNRISES TEND TO BE MORE SPECTACULAR. THESE CONDITIONS ARE ENHANCED BY HIGH PRESSURE, WHICH WE ASSOCIATE WITH CLEAR SKIES AND THEREFORE WARM, SUNNY WEATHER IN THE SUMMER, COLD, CRISP WEATHER IN THE WINTER (AND GLOOMY OVERCAST WEATHER IN THE LATE WINTER AND SPRING). HOWEVER, THIS IS NOT THE EXPLANATION OF THIS SAYING, BECAUSE HIGH PRESSURE TENDS TO LAST FOR SEVERAL DAYS.


You can find the Students’ Worksheet here.

Low pressure weather systems (depressions) bring us rain, strong winds and sometimes snow on high ground. Sometimes, they also bring thunder, lightning and even tornadoes to the UK. Neither shepherds nor sailors like this sort of weather.

1) Red sky at night

Imagine you are standing on the ground with the Sun setting (remember the Sun rises in the east and sets in the west).

Diagram red sky

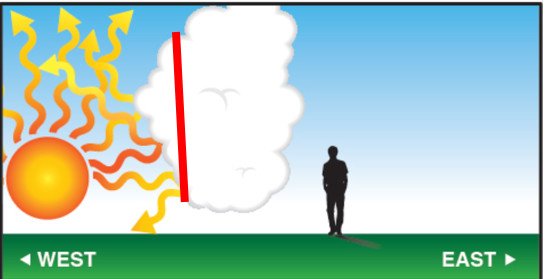
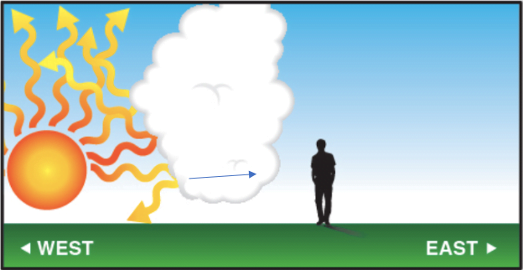
Our weather tends to come from the west. Let’s consider a weather system which has already passed us first, moving from west to east – the diagram shows the clouds associated with the weather system and the direction they are moving.

The wiggly red lines represent the Sun’s light – if the light can reach you, then you can see the Sun. At sunset and sunrise the Sun appears red.

a) Looking at the diagram, are you going to be able to see the sunset? ___Yes______________

b) Why? _Light can get from the Sun to you_____________

Light is reflected by the water droplets in a cloud. This means that some of the light heading towards the cloud is reflected back in the direction it came from. If this light can reach you, then you’ll see the cloud lit up by the setting Sun.

c) Looking at the diagram, are you going see the cloud lit up by the setting Sun? ___Yes____________

d) Why? ____The sunlight will reflect back from the cloud to you______

e) Shade the side of the cloud which will appear red.

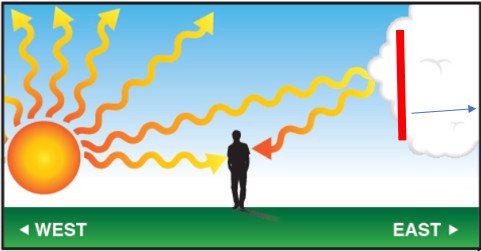
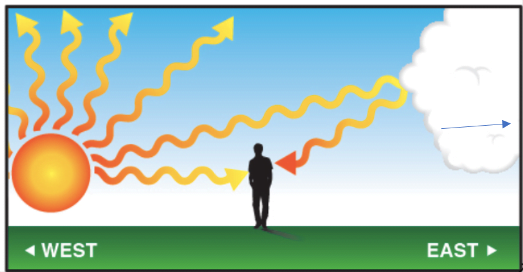
Now consider a weather system which hasn’t reached us yet:

Diagram of weather system that has not reached us yet

f) Looking at the diagram, are you going to be able to see the sunset? ____No______________

g) Why? __The cloud is in the way – sunlight can’t reach you________

h) Looking at the diagram, are you going see the cloud lit up by the setting Sun? ___No_____

i) Why? ___The side of the cloud lid up by the Sun is on the further side, which you cant see.____

j) Shade the side of the cloud which will appear red.

Weather systems are usually a few days apart – if a weather system has just passed us, we probably won’t get another one the same day. If a weather system is in sight, it will probably bring bad weather to us shortly.

In your own words, explain how these diagrams explain “red sky at night, shepherd’s delight”.

__If a storm has just passed, you’ll be able to see the sunset and the cloud illuminated by the sun, giving a red sky. If a storm has just passed, it’s unlikely that there will be another one tomorrow, so the weather is likely to be good. On the other hand, if you can’t see the setting sun or the illuminated side of the cloud, the sky won’t look red at sunset – this is the case when the cloud from an approaching storm is between you and the Sun, and bad weather is on the way.___

Red Sky Worksheet

“Red sky at night, shepherd’s delight. Red sky in the morning, shepherd’s warning” (or sailors rather than shepherds, depending on where in the country you are).

Is there any truth in this saying and, if so, why?

Low pressure weather systems (depressions) bring us rain, strong winds and sometimes snow on high ground. Sometimes, they also bring thunder, lightning and even tornadoes to the UK. Neither shepherds nor sailors like this sort of weather.

1) Red sky at night

Imagine you are standing on the ground with the Sun setting (remember the Sun rises in the east and sets in the west).

Red sky and weather systems

Our weather tends to come from the west. Let’s consider a weather system which has already passed us first, moving from west to east – the diagram shows the clouds associated with the weather system and the direction they are moving.

The wiggly red lines represent the Sun’s light – if the light can reach you, then you can see the Sun. At sunset and sunrise the Sun appears red.

a) Looking at the diagram, are you going to be able to see the sunset? ______________________

b) Why? ____________________________________________________

Light is reflected by the water droplets in a cloud. This means that some of the light heading towards the cloud is reflected back in the direction it came from. If this light can reach you, then you’ll see the cloud lit up by the setting Sun.

c) Looking at the diagram, are you going see the cloud lit up by the setting Sun? _______________

d) Why? ____________________________________________________

e) Shade the side of the cloud which will appear red.

Now consider a weather system which hasn’t reached us yet:

Weather system that has not reached us yet

f) Looking at the diagram, are you going to be able to see the sunset?


g) Why?


h) Looking at the diagram, are you going see the cloud lit up by the setting Sun?


i) Why?


j) Shade the side of the cloud which will appear red.

Weather systems are usually a few days apart – if a weather system has just passed us, we probably won’t get another one the same day. If a weather system is in sight, it will probably bring bad weather to us shortly.

k) In your own words, explain how these diagrams explain “red sky at night, shepherd’s delight”.


2) Red sky in the morning

Going through the same thinking as above, complete the following diagrams to show

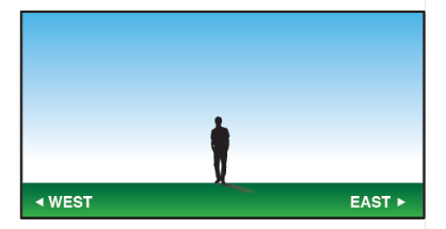
a) A Sunrise with a weather system which has already gone passed us.

– First draw the Sun rising in the East

– Next draw the cloud and the arrow showing which way it is moving

– Next draw lines showing light coming from the Sun and reflecting from the cloud.Diagram for drawing on

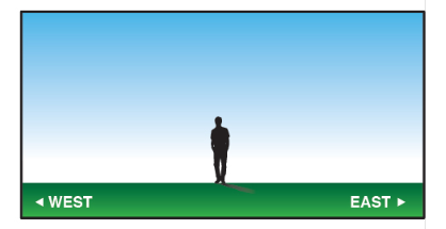
b) A Sunrise with a weather system which is about to reach us.

– First draw the Sun rising in the East

– Next draw the cloud

– Next draw lines showing light coming from the Sun and reflecting from the cloud.Second diagram for drawing on

In your own words, explain how these diagrams explain “red sky in the morning, shepherd’s warning”.


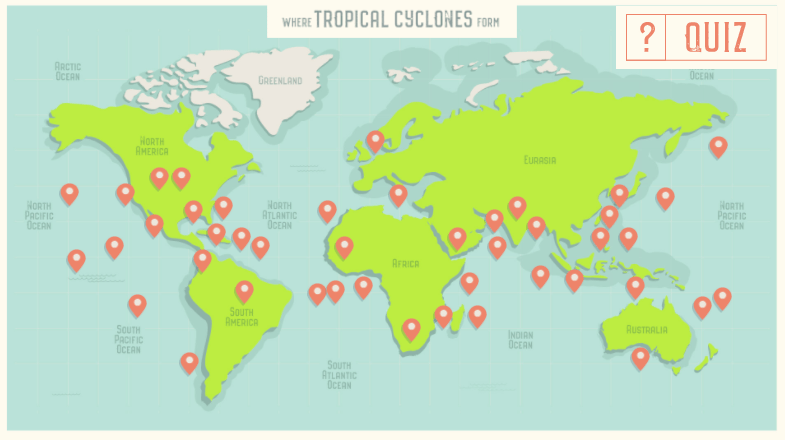
Tropical Cyclone Challenge

Tropical Cyclone Teaching Resources

Overview document for teachers – START HERE.

At the bottom of the page, you will also find some further reading/ background information for teachers, if you would like to deepen your understanding of Tropical Cyclones.

Introduction to Tropical Cyclones

Resources for Teachers

Tropical cyclones – the basics PowerPoint.

What do you call a tropical cyclone – physical basemap

What do you call a tropical cyclone – cumulative hurricanes basemap.

Teacher resource – Tropical Cyclone basics answers.

Worksheets and Resources for Students

What do you call a tropical cyclone? (cumulative hurricanes or physical basemap)

What kind of storm?

Where, Why and How do they Form?

Our Tropical Cyclone Challenge– use the online interactive resource with accompanying worksheet to discover the recipe for a Tropical Cyclone.

Resources for Teachers

Tropical cyclones: where, why, how PowerPoint.

Thunderstorm recipe (teacher).

Worksheets and Resources for Students

Thunderstorm recipe

Making things spin.

SST exercise.

Homework task:

A long time ago

Tracking Tropical Cyclones

Resources for Teachers

Tracking tropical cyclones PowerPoint

Worksheets and Resources for Students

Category 6 hurricanes? a DME

Japan Decision Making Exercise

Hazards

Resources for Teachers

Tropical cyclones – hazards PowerPoint.

Hurricane Harvey Links

Storm surge worksheet- answers.

Hazard posters.

Worksheets and Resources for Students

Tropical cyclone hazards worksheet.

Storm surge worksheet.

Case study: Hurricane Harvey and worksheet.

Homework task:

Option 1: Hurricane Harvey case study and Hunting Hazards.

Option 2: Tropical cyclones worksheet

Option 3: GIS hurricane task.

Impacts

Resources for Teachers

Tropical cyclones – Impacts PowerPoint.

Cyclone Idai Links

The many ways a tropical cyclone can kill you (teacher).

Worksheets and Resources for Students

The many ways a tropical cyclone can kill you.

The other effects a tropical cyclone may have.

Personas.

Case studyCyclone Idai.

Extra: Tracking hurricane Irma.

Responses

Resources for Teachers

Tropical cyclones – responses PowerPoint.

Super Typhoon Haiyan/ Yolanda Links.

Worksheets and Resources for Students

Case study – Haiyan.

Response Decision Making Exercise.

Typhoon Haiyan disaster response.

Homework task: GDACS mapping exercise and maps.

Assessment Resource: Cyclone Fani Decision Making Exercise; Cyclone Fani DME resource booklet.

Background Information for Teachers

MetLink - Royal Meteorological Society
We use cookies on this site to enhance your user experienceBy clicking any link on this page you are giving your consent for us to set cookies. More info

By clicking any link on this page you are giving your consent for us to set cookies. More info