Home » Teaching Resources » Pop-up Depression Pop-up Depression Facebook Twitter Pinterest Print 
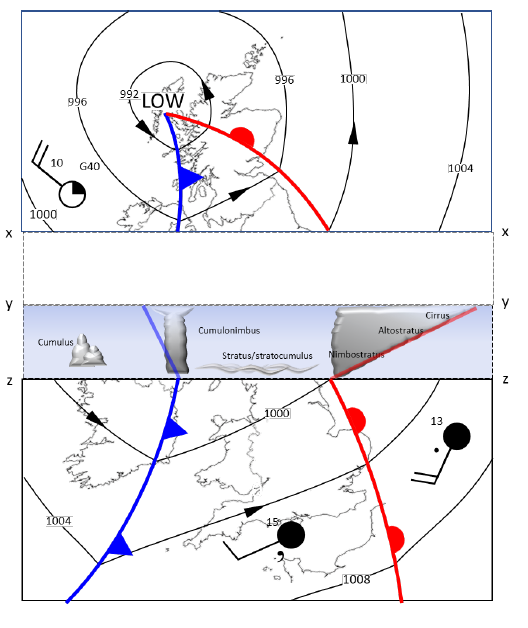
Print, cut-out and fold along the lines to make a 3D model of a depression. Depressions, Anticyclones and Fronts Start exploring Search Resources All Levels Primary Secondary Geography Secondary Maths Secondary Science Choose a topic All Topics Air Masses Anticyclones Carbon Cycle Climate Climate Change Climate Zones Clouds Contour Coriolis Depressions El Nino Extreme Weather Flooding Front GIS Global Atmospheric Circulation Hydrological Cycle Microclimates Past Climate Snow Synoptic Charts Tropical Cyclones Urban Heat Island Water Cycle Weather Weather Forecast Weather Map Weather System All Climate Change 1.5 degree target Adaptation Afforestation Agriculture air quality aircraft Albedo Anthropocene anthropogenic Arctic/ Antarctic attribution Biodiversity Biosphere Carbon cycle Carbon dioxide removal/ sequestration Carbon footprint Carbon sinks Causes Climate Climate Crisis/ Emergency Climate justice Climate literacy climate stripes/ visualisation Climate zone shift clouds CO2/ carbon dioxide emissions Communication COP Cryosphere Deforestation Desertification Disaster risk management Drought Ecosystems Electric vehicles Energy Equity Evidence Extreme weather Feedback loops Fire weather Flood defences Flooding/ flood risk Fossil fuels Fuel security Global energy budget/ balance Green climate fund Greenhouse effect Greenhouse gas concentrations Heatwaves/ extreme heat Hydroelectric power Ice sheets Impacts IPCC Keeling curve Mitigation Modelling Nationally Determined Contributions (NDCs) Natural variability Nature based solutions Negotiations Net zero Nuclear power Observations Ocean acidification Ocean warming Per capita emissions Proxy records Regional climate change Renewable/ non fossil fuel energy Scenarios Schools Strike for Climate Society Solar energy Solutions Storms Sustainable Development Goals (SDGs) Temperature/ global warming Tipping points Transport Tropical cyclones Uneven impacts UNFCCC/ governance Urban green infrastructure Urban heat Urbanisation Water cycle Water security Water vapour (H2O) concentrations Weather Wild fires Wind power Choose an age range All ages Primary 0 to 7 7 to 11 Secondary 11 to 14 14 to 16 16 to 18 Latest from blog Celebrating David Attenborough RMetS work recognised Climate Education in the Science Curriculum Ten-point plan to deliver climate education Related resources … Secondary Geography 3D Print the Weather The RMetS is delighted to have collaborated with CREATE Education to develop instructions to allow schools to 3D print sections of the Central England Primary, Secondary Geography Drought What is a drought? Droughts are not very easy to define. A drought is not just a lack of water for a period of Secondary Geography IPCC 2021 – Changing Polar Climate Investigate climate change in the Arctic and Antarctic Secondary Geography How will the UK’s Temperature Change Seasonally (Summer)? June, July, August Temperatures in the 2030’s, 60’s and 90’s 2030 2060 2090 These 3 maps show projected June, July and August (JJA) temperatures
Secondary Geography 3D Print the Weather The RMetS is delighted to have collaborated with CREATE Education to develop instructions to allow schools to 3D print sections of the Central England
Primary, Secondary Geography Drought What is a drought? Droughts are not very easy to define. A drought is not just a lack of water for a period of
Secondary Geography IPCC 2021 – Changing Polar Climate Investigate climate change in the Arctic and Antarctic
Secondary Geography How will the UK’s Temperature Change Seasonally (Summer)? June, July, August Temperatures in the 2030’s, 60’s and 90’s 2030 2060 2090 These 3 maps show projected June, July and August (JJA) temperatures