


If you’ve ever looked at an Ordnance Survey Map, you’ll have seen the contours – lines joining places which are the same height above sea level. You can spot high places, low places and places where the slopes are steep. The contours are drawn at equal intervals – there might be one every 5m or 10m.
But contour maps are useful for many things other than height. In meteorology, isobars link places where the atmospheric pressure is the same, we use isotherms for temperature, isotachs for wind speed and isohyets for rainfall.
How do you go about creating a contour map from a set of observations?
Here are a few practise resources:
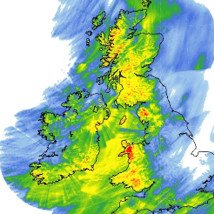
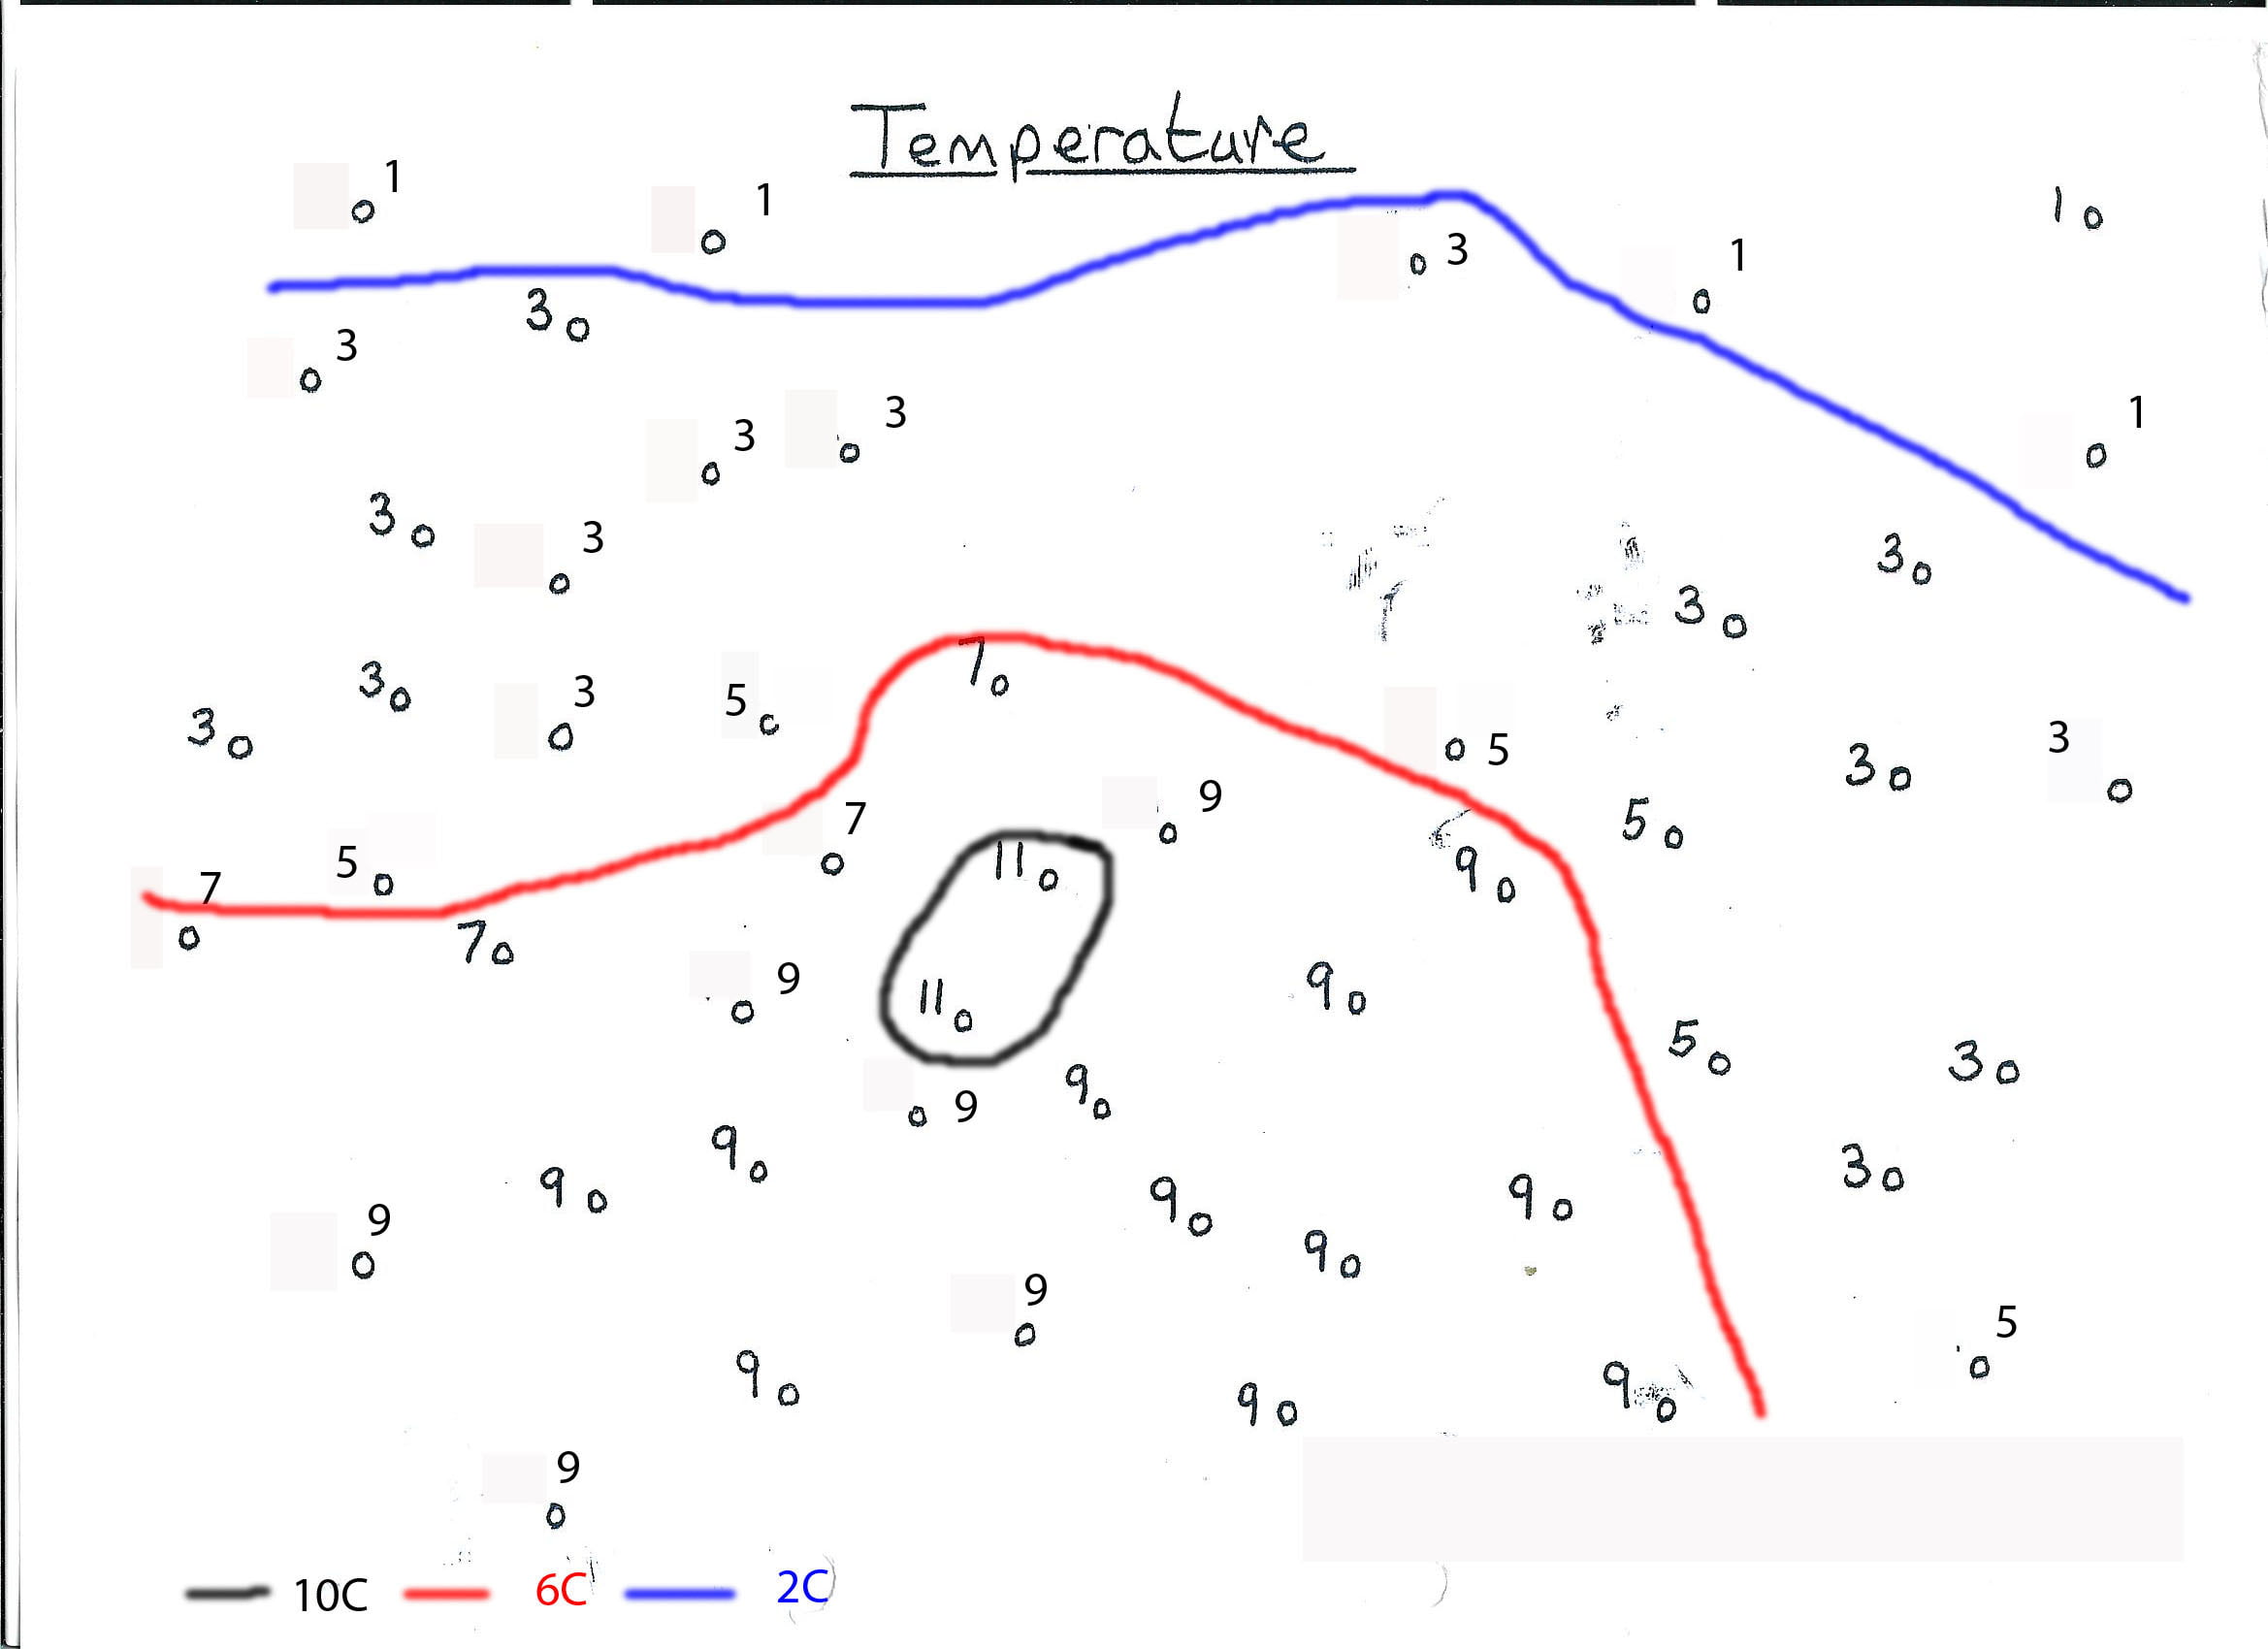
Isotherm and Isobar drawing exercise based on a depression: student worksheet. A simpler version of the T/ isotherm map can be found here or a complete depression based exercise where students draw contours of temperature, pressure and precipitation to work out what the system looks like: Student worksheets and
notes for teachers.
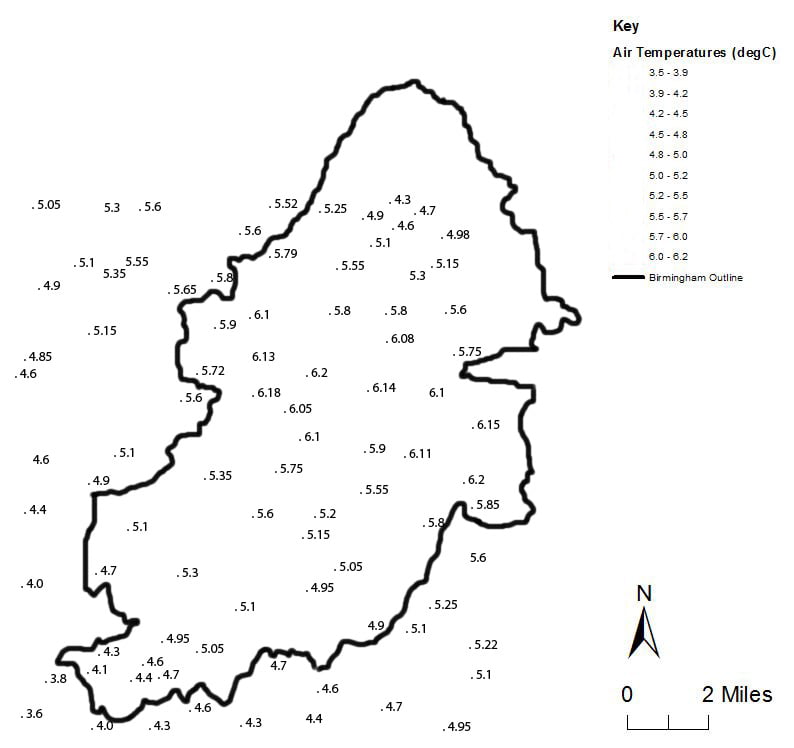
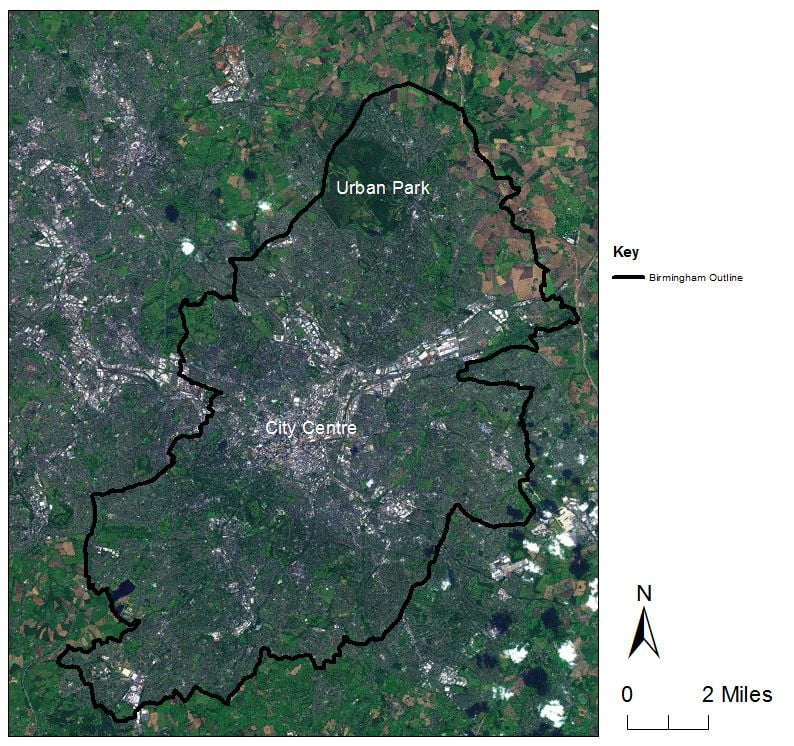
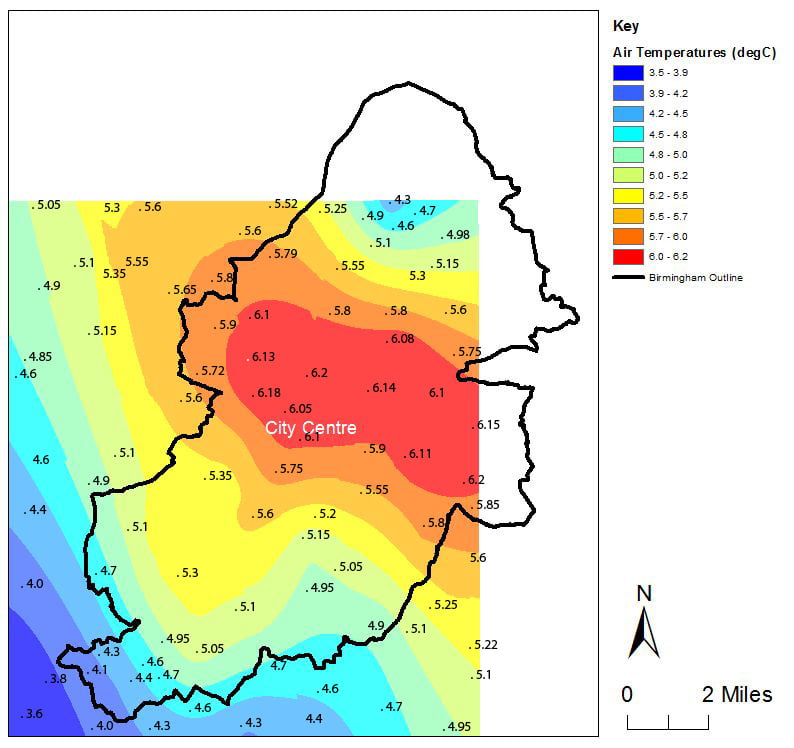
Urban heat island isotherm drawing exercise:notes for teachers, idealised weather station data for isotherm drawing, satellite image of Birmingham and solution for teachers.
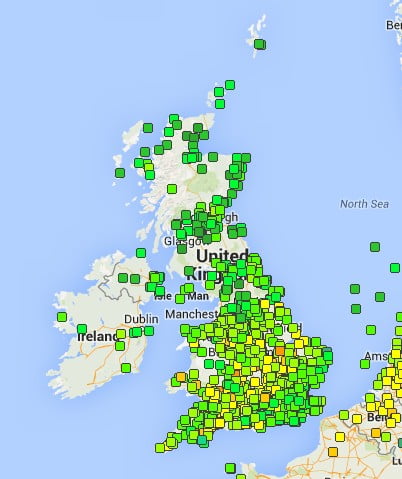
Drawing isolines on WOW data from depression EVA
A beginners Guide from the Ordnance Survey.

© 2024 Royal Meteorological Society
RMetS is a registered charity No. 208222
