A Case Study of a Weather System using WOW data
Go to the WOW website wow.metoffice.gov.uk
Use the pop up calendar to select 24th December 2015 and the drop down box to choose 0600 to 0659 in the morning.
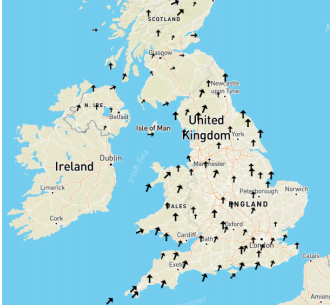
Use the Layers menu on the right to select wind speed/ direction.
Where is the wind coming from?
Is the wind weak or strong?
Change the time to 0800-0859. How does the wind look now?
Change the time to 1200-1259. How does the wind look now?
Capture the image, stick it into a work book
NOW USE THE LAYERS MENU TO LOOK AT TEMPERATURE.
At 0600-0659, what are the temperatures across the U.K.? (You may need to click on some dots to work out exactly what the temperature is)
Capture the image, stick it into a work book at draw a line roughly dividing colder and warmer temperatures. What is a line dividing cold and warm temperatures called?
Now look at the temperature between 0800-0859. What is the pattern of temperatures?
Now look at the temperature between 1200-1259. What is the pattern of temperatures?
Capture the image, stick it into a work book at draw a line dividing colder and warmer temperatures.
Now compare this image and the line you have drawn on it with the wind image you captured earlier. What do you notice?
CHALLENGE YOURSELF:
Find the Met Office Weather Station in Glasgow/ Bishopton, and click on it. Click on ‘View Full Observation’ and use the Graph view and the calendars to select from
23/12/15 to 25/12/15. How does the air temperature change?
NOW USE THE LAYERS MENU TO SELECT RAINFALL RATE AT 0600-0659
You’ll also need to add ‘WOW observations’ from the Filter menu because the official observations don’t include rainfall. Where is it raining?
Go back in time, hour by hour, what happens to where the rain is?
NOW USE THE LAYERS MENU TO SELECT ‘PRESSURE’.
Investigate how that changes through the day.
CHALLENGE YOURSELF:
Find the Met Office Weather Station in Glasgow/ Bishopton again, and click on it. Click on ‘View Full Observation’ and use the Graph view and the calendars to select from 23/12/15 to 25/12/15. How does the mean sea level pressure change?
CHALLENGE YOURSELF:
Capture the pressure image from 1200-1259 on 24th December 2015.
Can you sketch pressure contours for 992, 996, 1000, 1004, 1008 and 1012hPa?
Summarise what you think is going on with the weather on the 24th December 2015.


