


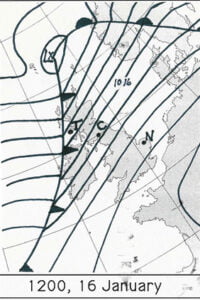
Identify the weather features on the synoptic (weather) chart below:
Cold Front
Warm Front
Highest pressure
Depression
Anticyclone
Isobar
Occluded Front
Strong Wind
Light Wind
Lowest Pressure
Advanced
Northerly Wind
Northwesterly Wind
Southwesterly Wind
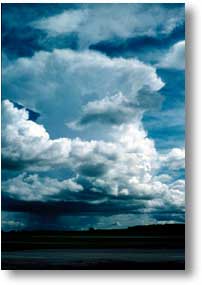
(hint the clouds in the images below are cirrus, cumulonimbus, cumulus and nimbostratus)

In this series Pete Inness explains what weather systems are, why they happen and how we can understand weather systems.


How will the United Kingdoms Frequency of Hot Nights Change? 2060 2090 Hot days will occur on 9-25% of days by 2060s and 14-35% of