Home » Teaching Resources » UK Synoptic Charts: Pressure and Wind Skills Exercise

UK Synoptic Charts: Pressure and Wind Skills Exercise

Facebook
Twitter
Pinterest
Print

Skills Exercise


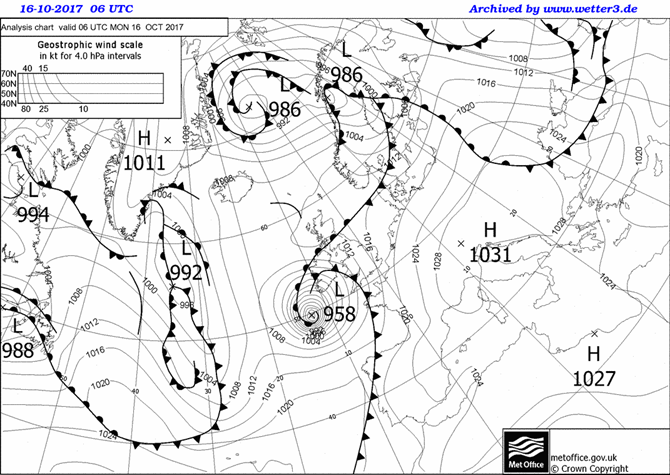
You will need an Atlas for these activities

  1. Identify on the map a country experiencing HIGH pressure.                                                
  2. What type of air pressure is arriving in the UK?                                                                                            
  3. What is the lowest value of pressure shown on the map?                                                                           
  4. What is the air pressure over Greenland?                                                                                                     
  5. What is the air pressure over Northern Africa?                                                                                
  6. Identify an area that would have STRONG winds (the isobars will be close together)                                                                                                                    
  7. Identify an area that would have WEAK winds (the isobars will be far apart)                                 


EXTENSION– can you draw simple arrows to show the pattern of wind over the UK on the small inset map? (recall that wind moves from high to low and is deflected to the left in the Northern hemisphere) 


Start exploring

Latest from blog

Related resources …
Secondary Geography
Are we experiencing more weather extremes as a result of climate change?
Secondary Geography
Climate is average weather and its variability over a period of time, ranging from months to millions of years.
Secondary Geography
Adaptation to climate change needs to be addressed in all urban policies. Discuss.