

Worksheet to accompany the animation.
Depressions from our Weather and Climate teacher’s guide
Cold and Warm fronts activities for differentiation and revision
Finding weather features on a simple synoptic chart
Red sky at Night, Shepherd’s Delight worksheet and Teacher’s Notes – a resource looking at how our prevailing wind direction means this saying is largely true.
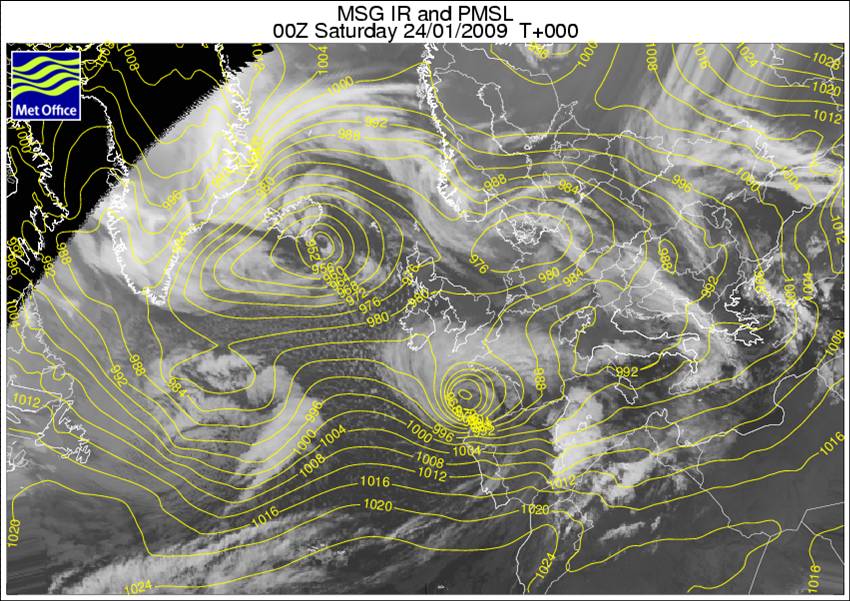
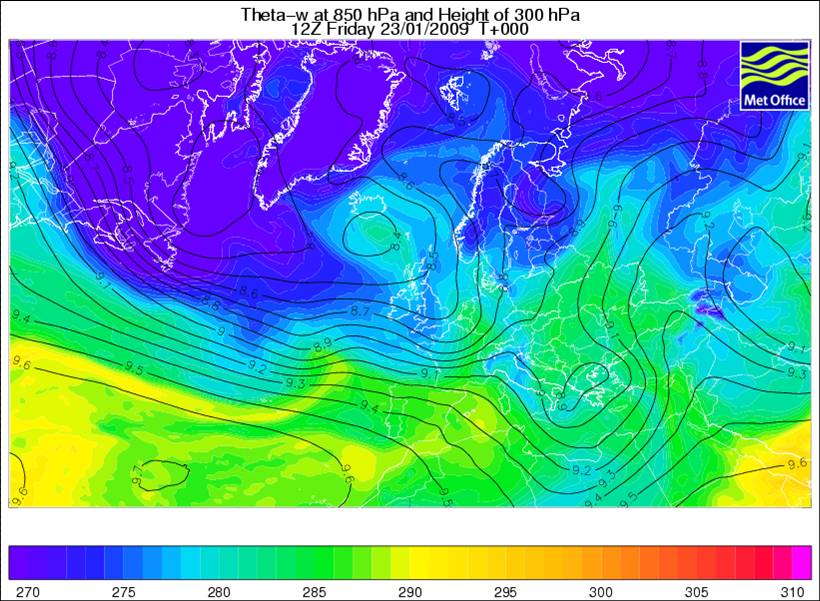
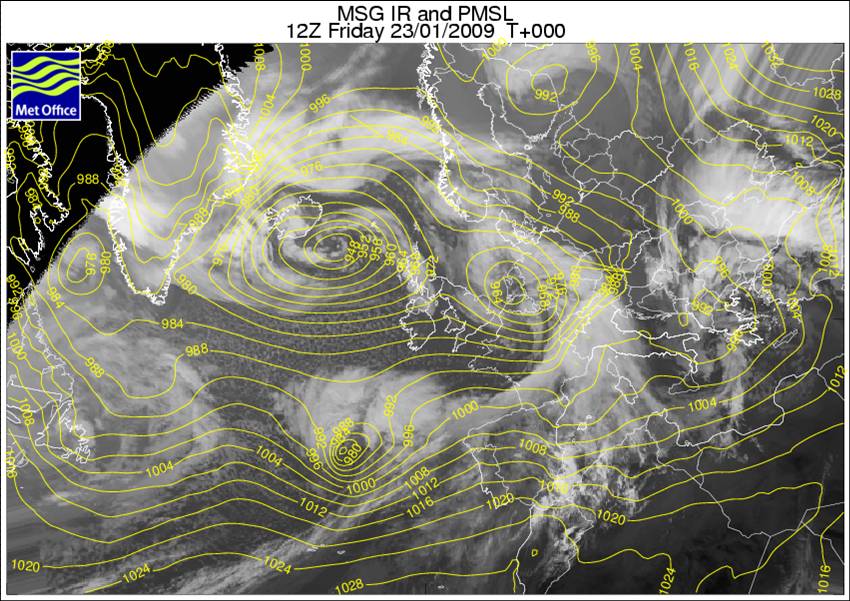
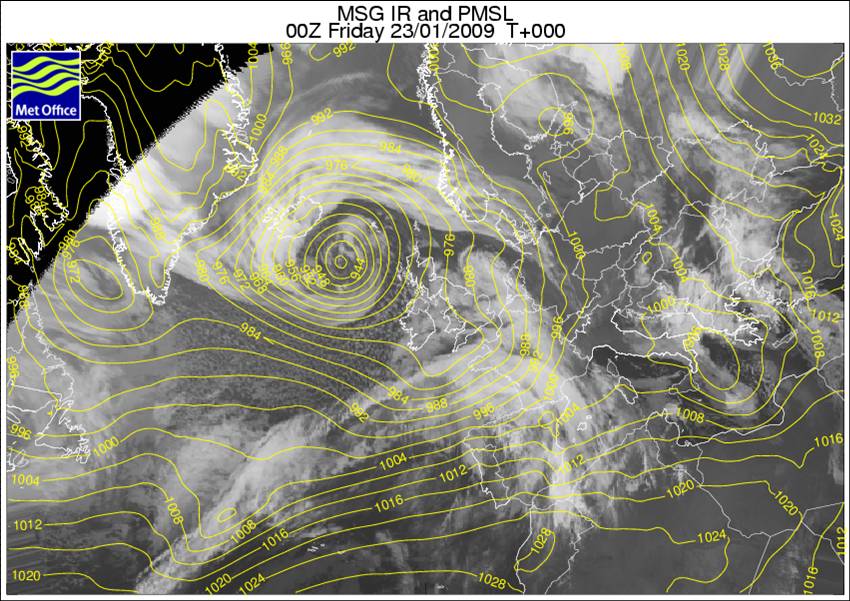
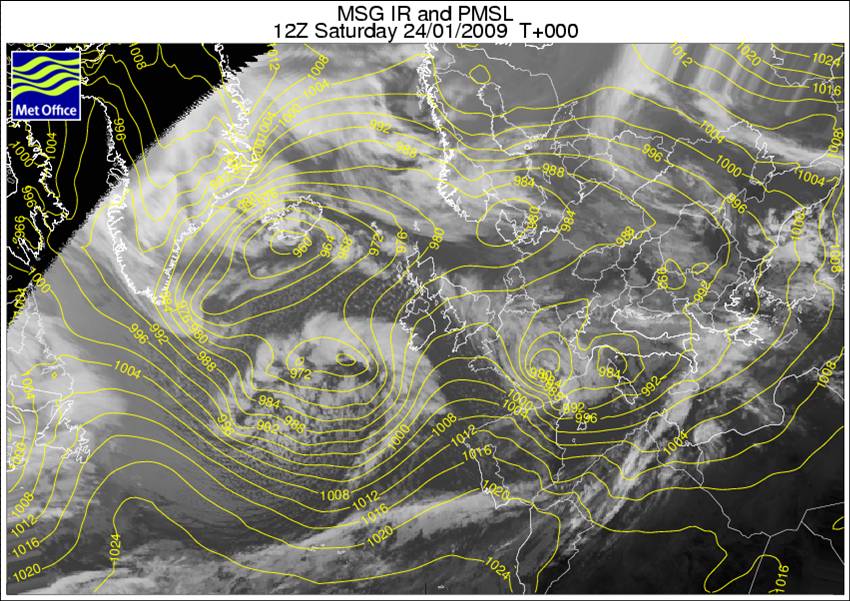
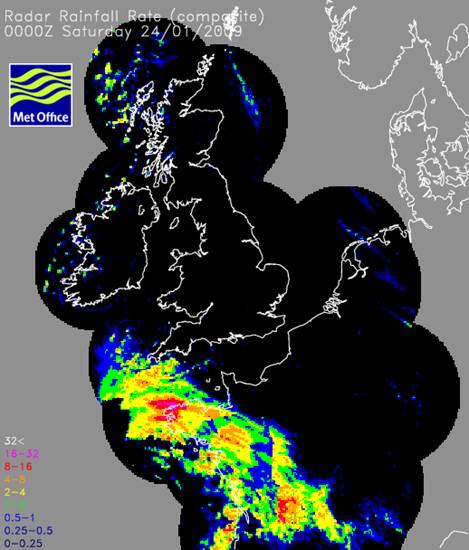
Depressions case study template and example of Storm Eunice – collect and annotate weather charts for a named storm, weather warnings and impacts of the storm.
Weather systems PowerPoints and cross section practice
Using WOW data to investigate a depression passing across the UK with worksheets for students including isoline drawing practice.
Anticyclones, depressions and fronts with student worksheets
Depressions and anticyclones with a synoptic chart exercise
A case study of orographic rainfall in Scotland.
What is the weather? Work out what the weather is like at several UK locations based on some simplified weather maps.
Interpreting weather charts basic information on synoptic charts, with Isotherm map exercise and Synoptic chart exercise.
Isotherm and Isobar drawing exercise based on a depression on our contour resources page.
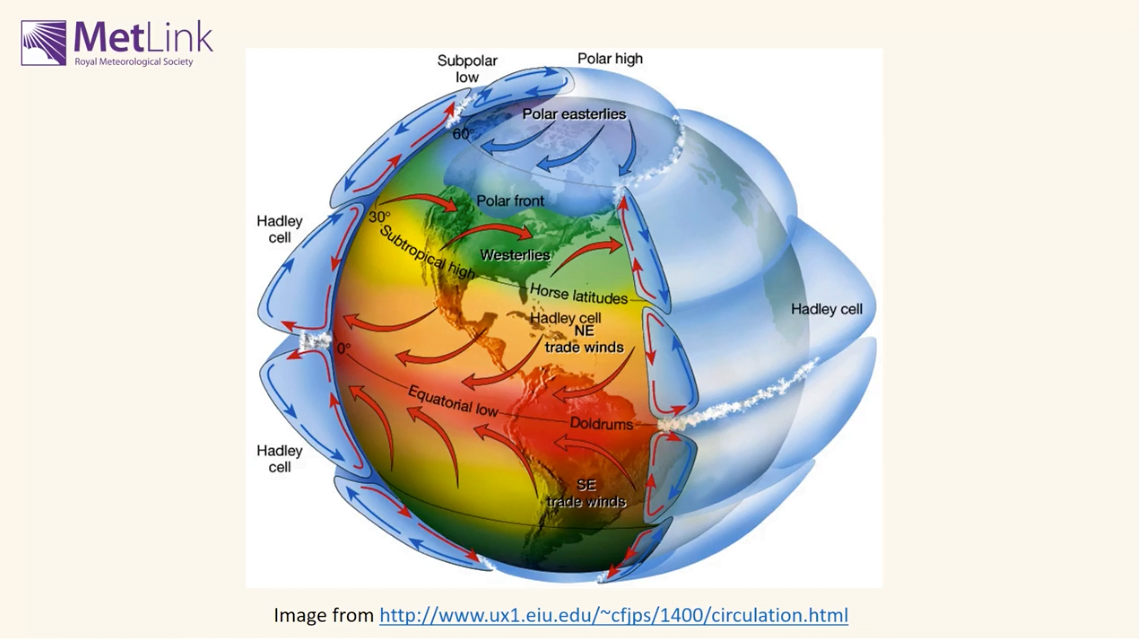
Use this Global Atmospheric Circulation practice exercise.
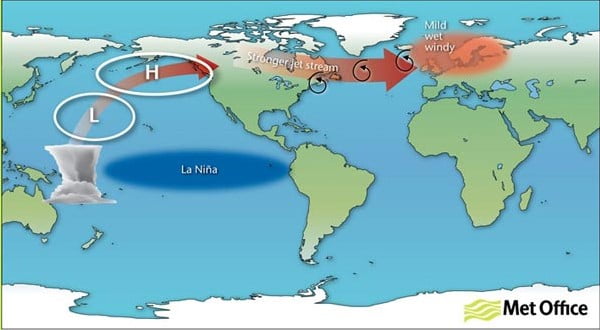
Changes to the Global Atmospheric Circulation as the climate changes.
Other Useful Links

Pathway: Extending Weather
Air Masses – Pressure and Wind – Water in the Atmosphere – Anticyclones
Lesson overview: In this lesson we look at the weather associated with anticyclones in summer and winter and its potential impacts.
Anticyclones are high-pressure weather systems caused by descending air. They rotate clockwise as outflowing air at ground level is deflected by the Coriolis effect and bring light winds and warm sunny days in the summer, but also crisp winter days and endless gloom in spring. Large high-pressure systems can sit in place for long periods of time and deflect low-pressure weather around the UK. This can lead to protracted periods of stable weather with little precipitation.
Learning objectives:
To understand what an anticyclone is.
To be able to distinguish between the weather in a winter and summer anticyclone.
To be able to explain why we get high pressure in an anticyclone.
To understand the positive and negative impacts of anticyclones in summer and winter
Key Teaching Resources
Anticyclones PowerPoint
Anticyclones PowerPoint (easier)
Anticyclones Worksheet
Anticyclones Worksheet (easier)
Anticyclones Homework
Teacher CPD/ Extended Reading
Read Anticyclones_More for Teachers
Or watch
Alternative or Extension Resources
Further resources for teaching about anticyclones, depressions and fronts.
Pathway: Climate
Climate Zones – Past Climate Change – Polar Climate – Hot Deserts
Lesson overview: In this lesson we look at the characteristics and locations of hot deserts and the adaptations of animals and vegetation found there.
Hot deserts have less than 250mm precipitation per year and daytime temperatures that may approach 50oC. Hot deserts cover 14.2% of the Earth’s surface, their distribution largely determined by the global atmospheric circulation. Physical factors such as altitude or latitude determine deserts with the most extreme values of precipitation/temperature. Their characteristics and distribution will change over long periods of time due to the Milankovitch cycles and Continental Drift. Climate change is projected to have complex effects and the size of arid regions is expected to grow. The plants and animals that live in the deserts around the world have adapted to cope with the extreme climate.
Learning objectives:
To be able to describe the characteristics and location of at least one hot desert.
To understand why hot deserts are hot and dry.
To be able to draw and interpret a climate graph of a hot desert.
To understand animal and plant adaptations to the hot desert climate.
Key Teaching Resources
Hot Deserts PowerPoint
Hot Deserts PowerPoint (easier)
Hot Deserts Worksheet
Hot Deserts Making Plants and Animals
Hot Deserts Making Plants and Animals – Info sheet
Hot Deserts homework
Teacher CPD/ Extended Reading
Read
Or watch
Alternative or Extension Resources
Using GIS to investigate temperature extremes
Pathway: Climate
Atmospheric and Oceanic Circulation – Climate Zones – Past Climate Change – Polar Climate
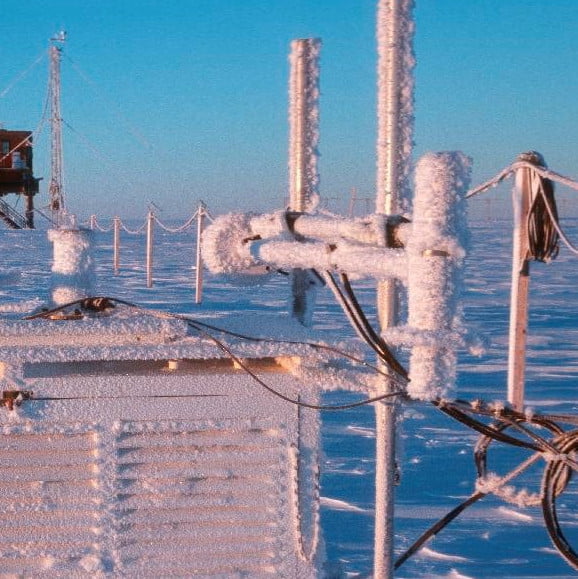
Lesson overview: In this lesson we investigate why polar climates are so extreme and how it can be too cold to snow in Antarctica.
The extremes of Polar weather – the lowest temperatures on Earth and little precipitation – vary significantly throughout the year. Antarctica has the harshest conditions, recording an annual mean low of nearly -60oC due to its elevation and distance from the sea. Low levels of precipitation define Polar regions as deserts and it can be too dry to snow. The effects of climate change are amplified in these regions through feedback mechanisms which in turn affect global climate.
Learning objectives:
To understand why it is cold in Polar regions.
To understand why our Polar regions are classified as deserts.
To be able to calculate mean temperature and total precipitation and interpret a climate graph
Key Teaching Resources
Polar Climate PowerPoint
Polar Climate PowerPoint (easier)
Polar Climate Worksheet
Polar Climate Worksheet (easier)
Beast from the East homework
Teacher CPD/ Extended Reading
Read
Polar Climate – More for Teachers
or Watch
Alternative or Extension Resources
Using GIS to investigate temperature extremes
Drawing polar climate graphs to look for evidence of climate change
Changing polar climate (advanced)
Impacts of polar climate change (advanced)
Comparing Arctic and global temperatures – data skills exercise – worksheet or Excel

Weather systems
Fronts
Relationship between isobars and wind
Understanding station plots on a weather map
Plotting a station plot
Weather charts consist of curved lines drawn on a geographical map in such a way as to indicate weather features. These features are best shown by charts of atmospheric pressure, which consist of isobars (lines of equal pressure) drawn around depressions (or lows) and anticyclones (or highs). Other features on a weather chart are fronts and troughs. These are drawn to highlight the areas of most significant weather, but that does not mean that there is nothing of significance elsewhere on the chart.
Anticyclones are areas of high pressure, whose centres are often less well defined than depressions, and are associated with quiet, settled weather. Winds blow in a clockwise direction around anticyclones in the northern hemisphere, this is reversed in the southern hemisphere.
Depressions are areas of low pressure, usually with a well-defined centre, and are associated with unsettled weather. Winds blow in an anticlockwise direction around depressions in the northern hemisphere, this is reversed in the southern hemisphere.
Early weather charts consisted simply of station plots and isobars, with the weather being written as comments, like ‘Rain, heavy at times’. During the 1920s, a group of Scandinavian meteorologists, known collectively as the Bergen School, developed the concept of representing the atmosphere in terms of air masses. Since the air masses could be considered as being in conflict with each other, the term ‘front’ was used to describe the boundary between them. Three types of front were identified which depend on the relative movement of the air masses.
A cold front marks the leading edge of an advancing cold air mass. On a synoptic chart a cold front appear as a blue line with triangles. The direction in which the triangles point is the direction in which the front is moving.
![]()
A warm front marks the leading edge of an advancing warm air mass. On a synoptic chart a warm front appears as a red line with semi-circles. The direction in which the semi-circles point is the direction in which the front is moving.
![]()
Occlusions form when the cold front of a depression catches up with the warm front, lifting the warm air between the fronts into a narrow wedge above the surface. On a synoptic chart an occluded front appears as a purple line with a combination of triangles and semi-circles. The direction in which the symbols point is the direction in which the front is moving.
![]()
Fronts describe thermal characteristics. They also happen to be where there is significant precipitation. However, precipitation is not confined to fronts. Drizzle in warm sectors or showers in cold air occur fairly randomly, but occasionally, lines of more organised precipitation can develop. These are called troughs.
![]()
Isobars are lines joining places with equal mean sea-level pressures (MSLP).
![]()
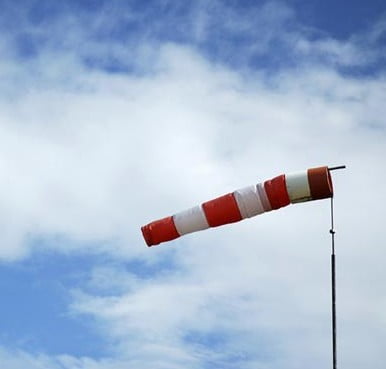
Wind is a significant feature of the weather (see Figure 4). A fine, sunny day with light winds can be very pleasant.
Stronger winds can become inconvenient and, in extreme cases, winds can be powerful enough to cause widespread destruction. The wind can easily be assessed when looking at a weather map by remembering that:
Good quality observations are one of the basic ‘tools of the trade’ for a weather forecaster.
The weather conditions at each individual station can be represented on a surface chart by means of station plot.
This means that information which would take up a lot of space if written on to a chart can be displayed in a quick easy to understand format.
Figure 5 shows an example of a plotted chart.
The land station plot can represent all the elements reported from that station, these typically include:
|
|
Traditionally station plots for manned observing sites were based around a central station circle. However, increasingly, automatic weather observations are replacing these and being plotted on weather charts. To differentiate between the two, automatic observations are plotted around a station triangle. Each element of the observation, with the exception of wind, is plotted in a fixed position around the station circle or triangle so that individual elements can be easily identified.
Total cloud amount
The total amount of the sky covered by cloud is expressed in oktas (eighths) and is plotted within the station circle for manned observations or station triangle for automatic stations, by the amount of shading.
The symbols used for both manual and automatic observations are shown below.
The surface wind direction is indicated on the station plot by an arrow flying with the wind. Direction is measured in degrees from true North. Therefore a wind direction of 180 is blowing from the south. The wind speed is given by the number of ‘feathers’ on the arrow. Half feathers represent 5 knots whilst whole feathers indicate 10 knots. A wind speed of 50 knots is indicated by a triangle. Combinations of these can be used to report wind speed to the nearest 5 knots. The symbols used are as follows.
Air temperature is plotted to the nearest whole degree Celsius, i.e. 23 would indicate 23 degrees Celsius.
Dew point temperature is plotted to the nearest whole degree Celsius, i.e. 18 would indicate a dew point of 18 degrees Celsius.
Pressure is recorded in millibars and tenths and the last three digits are plotted. Therefore 1003.1 would be plotted as 031 and 987.1 would be plotted as 871.
In total the Met Office has 100 codes for recording the current weather at the time of the observation. Different types of weather are represented using different weather symbols, a key to which can be found below.


A simplified version of the present weather plots is used to indicate past weather.
Pressure trend shows how the pressure has changed during the past three hours, i.e rising or falling, and pressure tendency shows by how much it has changed. The tendency is given in tenths of a millibar, therefore ’20’ would indicate a change of two millibars in the last three hours. Pressure tendency is indicated by the following symbols.
Visibility, which is how far we can see, is given in coded format, in either meters or kilometres. Visibilities below five kilometres are recorded to the nearest 100 metres, whilst those above five kilometres are given to the nearest kilometre.
For visibilities equal to and less than five km:
|
For visibilities greater than five km:
|
The type of low cloud present is provided in coded format, using the symbols below.

The type of medium cloud present is provided in coded format, using the symbols below.
The type of high cloud present is provided in coded format, using the symbols below.
Cloud heights are measured in hundreds or thousands of feet. The way these are plotted varies depending on whether the station is an automatic or manned observing site.
For automatic stations, indicated by a station triangle, the following codes are used.
|
For manned stations, indicated by a station circle, the following codes are used.
|
Gust speeds are measured in knots and proceeded by the letter G. Gust speeds are normally only recorded if they exceed 25 knots and are plotted as whole knots, i.e. G35 indicates a gust of 35 knots.
The decode of this station plot is as follows:
Type of observation: | Manned |
Total cloud amount: | 8 oktas |
Wind Speed: | 28-32 knots |
Wind direction: | South-westerly |
Air temperature: | 23 degrees Celsius |
Dew point temperature: | 18 degrees Celsius |
Pressure: | 1004.2 millibars |
Present weather: | Continuous moderate rain |
Past weather: | Rain |
Pressure tendency: | Falling 0.5 millibars in the past three hours |
Visibility: | 6km |
Low cloud type: | Stratus |
Low cloud amount: | 6 oktas |
Low cloud height: | 1000 feet |
Medium cloud type: | Altostratus |
High cloud type: | Cirrus |
Gust speed: | 45 knots |
Why not try decoding the following observational plots.
Web page reproduced with the kind permission of the Met Office
In this series Pete Inness explains what weather systems are, why they happen and how we can understand weather systems.
By the end of the lesson, you will be able to:
Part A – Isobars, pressure and wind
Part B – Identifying pressure systems and fronts
Part C – Plotted weather charts
Computers with Internet access would be desirable. Alternatively if Internet access is not available, printed copies of student sheets and worksheets should be made.
Prior knowledge required
A basic background of weather and climate.
Teaching activities
Students can visit the following pages to gain a basic background into the topics covered:
Weather charts
Interpreting Weather Maps
The information on the student sheets can be delivered by the teacher and activities completed individually. Alternatively students can work through the whole lesson themselves.
Three worksheets with exercises are provided to consolidate learning.
A series of additional exercises are provided for more able students, or those who have already studied pressure systems and fronts in more detail prior to this lesson.
Suggestions for homework
 Any of the worksheet activities can be completed. Alternatively students can collect weather charts from the Internet or a newspaper and repeat the exercises using these.
Part A – Isobars, pressure and wind
Isobars are lines joining points of equal pressure, similar to contours, which are shown on weather charts. Charts showing isobars are useful because they can help to identify anticyclones and depressions. Pressure is measured in millibars and isobars are normally drawn at intervals of 4 millibars. Pressure values are corrected to Mean Sea Level Pressure (MSLP) before being plotted on a map, this ensures that altitude does not affect the mapping.

Isobars are also helpful because the help us to understand the direction and strength of the wind in a particular area. Where isobars are very close together, for example near a depression, they indicate strong winds. Where the isobars are more widely spaced, near an anticyclone for example, they indicate light winds.
The wind will blow almost parallel to the isobars. Around an anticyclone the winds will blow slightly across the isobars, away from the centre of the anticyclone. In depressions, the wind will blow slightly across the isobars towards the centre of the low pressure.
Buys’ Ballot’s Law states that if you stand with you back to the wind in the northern Hemisphere, low pressure will be on your left. This means that you can work out the wind direction at different locations on a weather chart.
What to do next
Using this information on isobars you should now be able to complete worksheet 1.
Then you can complete extension exercise 1 or go on to Part B – Identifying pressure systems and fronts.
An anticyclone, also known as a ‘high’ can be identified on a weather chart as an often large area of widely spaced isobars, where pressure is higher than surrounding areas. In the Northern Hemisphere winds blow in a clockwise direction around high pressure. The highest pressure occurs at the centre and is known as the ‘high pressure centre’. Anticyclones can bring warm and sunny weather in summer, but cold and foggy weather in winter.
A depression, also known as a ‘low’ can be recognised on a weather chart by an area of closely spaced isobars, often in a roughly circular shape, where pressure is lower than surrounding areas. They are often accompanied by fronts. In the Northern Hemisphere winds blow around depressions in an anticlockwise direction. The lowest pressure occurs at the middle of a depression, this is known as the ‘low pressure centre’. Depressions are often associated with strong winds and heavy rain and are nearly always accompanied by fronts.

 Troughs are elongated extensions of areas of low pressure. They bring similar weather to that associated with depressions.
 Ridges are elongated extensions of areas of high pressure. They bring similar weather to that associated with anticyclones.
A col can be identified as an area of slack pressure between two anticyclones and two depressions.
The following diagram summarises the appearance on a weather chart of the main types of pressure systems.
Cold fronts can be identified on weather charts as bold lines with triangles. These are blue when displayed on colour charts. The points of the triangle indicate the direction in which the front is moving. A cold front indicates a change in air mass, where warmer air is being replaced by colder air. They often bring short spells of heavy rainfall in the form of showers and squally winds, and are accompanied by a decrease in temperature, a veer in wind direction and a change to brighter showery conditions.
Warm fronts can be identified on weather charts as bold lines with semi-circles or humps. These are coloured red when displayed on colour charts. The direction of the humps indicates the direction in which the front is moving. A warm front indicates a change from a colder to a warmer air mass. They often bring spells of prolonged and sometimes heavy rainfall, with strong winds.

Occluded fronts can be identified on weather charts as bold lines with sets of triangles and semi-circles. These are coloured purple on coloured weather charts. The direction in which the symbols face indicates the direction in which the front is travelling. Occlusions are formed when the cold front overtakes the warm front, therefore they have similar characteristics to a cold front, but less intense.
Warm Sector
The warm sector of a depression is located behind the warm front and ahead of the cold front. It often brings mild temperatures but the weather can be overcast with drizzle.
What to do next
Using this information you should now be able to complete worksheet 2.
Then you can complete extension exercise 2 or go on to Part C.
The following image is an example of a UK plotted weather chart.
Plotted surface charts are made up of individual ‘station circles’. Each individual stations observation is put into graphical format so that it is simple to understand, can be put on a chart and be compared to its neighbours.
 The diagram opposite shows the basic station circle, including temperature, pressure, weather, cloud cover, wind speed and direction. Some elements, e.g. weather and cloud cover, are put into a graphical code to make them more obvious. The Met Office uses a much more complex station circle but the one below is a simplified version using the main weather elements.
On the end of the wind direction line are ‘feathers’, these indicate the wind speed. Half feathers represent 5 knots whilst whole feathers indicate 10 knots. A wind speed of 50 knots is indicated by a triangle. Combinations of these can be used to report wind speed to the nearest 5 knots.
The table below shows the symbols used to indicate different wind speeds.
Cloud cover is indicated by the shading of the centre of the station circle. The table below shows the meanings of the different symbols.
Temperature is plotted to the nearest degree and is located in the top left-hand corner of the station plot.
Pressure is plotted in the top right-hand corner of the station plot.
In total the Met Office has 99 codes for recording the current weather at the time of the observation. However these can be simplified down. Different types of weather are represented using different weather symbols, a key to which can be found below.
What to do next
Using this information you should now be able to complete worksheet 3.
Then you can complete extension exercise 3 .
The image below is an extract from a surface pressure chart, on which isobars, fronts and pressure systems have already been drawn. Download a copy of the worksheet here. If working on a PC, print out a copy of this page. Then study the chart, and complete the table below, by entering the approximate pressure at each of the labelled locations.

The image below shows a surface pressure chart, on which isobars, fronts and pressure systems have already been drawn. Download a copy of the worksheet here. Then study the chart, and identify and label the following items:
|
If you need help refer back to Part B – Identifying pressure systems and fronts.
The following three questions contain examples of plotted station circles. Download a copy of the worksheet here. Then study each of these plots and complete the tables below with details of the temperature, weather, pressure, cloud cover, wind speed and wind direction.
 |
 |
 |
|
 |
|
The following three questions contain tables of weather data. Study each of these tables and plot the details of the temperature, weather, pressure, cloud cover, wind speed and wind direction on to the station circle provided.
 |
 |
|
 |
|
 |
If you need help refer back to Part C – Plotted weather charts.
The following diagram shows a series of plotted pressure values. Download a copy of the worksheet here. Complete the diagram by drawing isobars at intervals of 4 millibars, including 992, 996, 1000, 1004 and 1008.
Study the chart below. This chart is for mid-November. Download a copy of the worksheet here. Then using your knowledge of the characteristics of anticyclones, depressions and fronts in winter, complete the table below with approximate readings.
There is no one correct answer. Your values should simply indicate the typical values and the variations between each location. For example, should location A be warmer or colder than location B? Should location E have stronger or lighter winds than location D?
Study the chart below. This chart is for mid November. Download a copy of the worksheet here. Then using your knowledge of the characteristics of anticyclones, depressions and fronts in winter, construct a station circle for each of the locations marked on the chart.
There is no one correct answer. You values should simply indicate the typical values and the variations between each location. For example should location A be warmer or colder than location B? Should E have stronger or lighter winds than location D?
If you have already completed extension exercise 2, you will simply need to convert your table of results into station circle plots.

|
Location A
|
|
Location B
|
|
|
Location C
|
|
Location D
|
|
|
Location E
|
|
Location F
|
|
|
Location G
|
|
Location H
|
|
Web page reproduced with the kind permission of the Met Office

Air masses are parcels of air that bring distinctive weather features to the country. An air mass is a body or ‘mass’ of air in which changes in temperature and humidity within them are relatively slight. That is to say the air making up the mass is very uniform. in temperature and humidity.
An air mass is separated from an adjacent body of air by a weather front. An air mass may cover several millions of square kilometres and extend vertically throughout the troposphere.
A thin layer of mixed gases which covers the Earth and helps it from becoming too hot or too cold. Its circulation, the heat (terrestrial radiation) and light (solar radiation) which pass through it, and the processes which go on in it, all affect the climate. The atmosphere is about 800 km (500 miles) deep and is made up of 21% oxygen, 78% nitrogen, 0.037% carbon dioxide, and other gases including hydrogen, helium, neon, argon, krypton, xenon, and water vapour.

A classification of clouds was introduced by Luke Howard (1772-1864) who used Latin words to describe their characteristics.
There are now ten basic cloud types with names based on combinations of these words (the word ‘alto’, meaning high but now used to denote medium-level cloud, is also used).
Clouds form when moist air is cooled to such an extent it becomes saturated. The main mechanism for cooling air is to force it to rise. As air rises it expands – because the pressure decreases with height in the atmosphere – and this causes it to cool. Eventually it may become saturated and the water vapour then condenses into tiny water droplets, similar in size to those found in fog, and forms cloud. If the temperature falls below about minus 20 °C, many of the cloud droplets will have frozen so that the cloud is mainly composed of ice crystals.
The ten main types of cloud can be separated into three broad categories according to the height of their base above the ground: high clouds, medium clouds and low clouds.
High clouds are usually composed solely of ice crystals and have a base between 18,000 and 45,000 feet (5,500 and 14,000 metres).
Medium clouds are usually composed of water droplets or a mixture of water droplets and ice crystals, and have a base between 6,500 and 18,000 feet (2,000 and 5,500 metres).
Low clouds are usually composed of water droplets — though cumulonimbus clouds include ice crystals – and have a base below 6,500 feet (2,000 metres).
The tropical Pacific Ocean has a warming and cooling cycle. This cycle is a completely natural event and usually lasts between three to seven years. When the waters become warmer it is called El Niño, and when they become cooler it is called La Niña. During the cycle, the temperature of the ocean can change by around 3 °C between the warmest and coolest times.
Fishermen off the South American coast have known about this natural event for hundreds of years. When it happens, they see a huge fall in the numbers of fish caught. But scientists are only just beginning to understand how the event affects Earth’s weather and climate.
In an anticyclone (also referred to as a ‘high’) the winds tend to be light and blow in a clockwise direction. Also the air is descending, which inhibits the formation of cloud. The light winds and clear skies can lead to overnight fog or frost. If an anticyclone persists over northern Europe in winter, then much of the British Isles can be affected by very cold east winds from Siberia. However, in summer an anticyclone in the vicinity of the British Isles often brings fine, warm weather.
In a depression (also referred to as a ‘low’), air is rising. As it rises and cools, water vapour condenses to form clouds and perhaps precipitation. Consequently, the weather in a depression is often cloudy, wet and windy (with winds blowing in an anticlockwise direction around the depression). There are usually frontal systems associated with depressions.
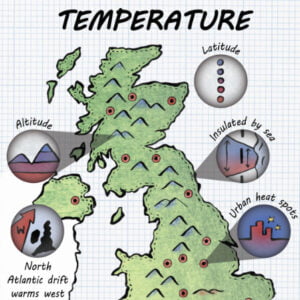
Temperature affects other weather elements including air pressure, cloud formation, humidity and precipitation.
Factors affecting temperature:
A weather front is simply the boundary between two air masses.
There are three different types of weather front. These are:
Cold front
This is the boundary between warm air and cold air and is indicative of cold air replacing warm air at a point on the Earth’s surface
On a synoptic chart a cold front appears blue
![]()
The presence of a cold front means cold air is advancing and pushing underneath warmer air. This is because the cold air is ‘heavier’ or denser, than the warmer air. Cold air is thus replacing warm air at the surface. The symbols on the front indicate the direction the front is moving.
The passage of a cold front is normally marked at the earth’s surface by a rise of pressure, a fall of temperature and dew-point, and a veer of wind (in the northern hemisphere). Rain occurs in association with most cold fronts and may extend some 100 to 200 km ahead of or behind the front. Some cold fronts give only a shower at the front, while others give no precipitation. Thunder may occur at a cold front.
Warm front
This is the boundary between cold air and warm air and is indicative of warm air replacing cold air at a point on the Earth’s surface
On a synoptic chart a warm front appears red
![]()
The presence of a warm front means warm air is advancing and rising up over cold air. This is because the warm air is ‘lighter’ or less dense, than the colder air. Warm air is thus replacing cold air at the surface. The symbols on the front indicate the direction the front is moving.
As a warm front approaches, temperature and dew-point within the cold air gradually rise and pressure falls at an increasing rate. Precipitation usually occurs within a wide belt some 400 km in advance of the front. Passage of the front is usually marked by a steadying of the barometer, a jump in temperature and dew-point, a veer of wind (in the northern hemisphere), and a cessation or near cessation of precipitation.
Occluded front
These are more complex than cold or warm fronts. An occlusion is formed when a cold front catches up with a warm front
When a cold front catches up with a warm front the warm air in the warm sector is forced up from the surface
On a synoptic chart an occluded front appears purple
![]()
Weather can change on a daily basis especially at middle to high latitudes where it is controlled by weather systems, depressions and anticyclones.
On a weather chart, lines joining places with equal sea-level pressures are called isobars. Charts showing isobars are useful because they identify features such as anticyclones (areas of high pressure), depressions (areas of low pressure), troughs and ridges which are associated with particular kinds of weather.
The movement of air around the earth from high pressure to low pressure is what brings about winds. The direction given for the wind refers to the direction from which it comes. For example, a westerly wind is blowing from the west towards the east.
Measurements of wind strength are made at 10 metres (33 feet) above the ground. A specified height has to be used because the wind speed decreases towards the ground. In this country winds are measured in knots (nautical miles per hour). However, forecast winds are often given in miles per hour (where 1 knot is equivalent to 1.15 mph) or in terms of the Beaufort Scale.
There are rapid variations in the wind – these are referred to as gusts. Gusts are higher inland than over the sea or windward coasts, although the mean wind speeds tend to be lower inland. Typically, gusts can be 60% higher than the mean speed, although in the middle of cities this can reach 100%. Northerly winds tend to be gustier than southerly ones. In general, the weather is strongly influenced by the wind direction, so information about the wind provides an indication of the type of weather likely to be experienced.
Web page reproduced with the kind permission of the Met Office


