
The 30th United Nations Climate Change Conference, or Conference of the Parties of the UNFCCC, COP30, will be taking place in Brazil this year.
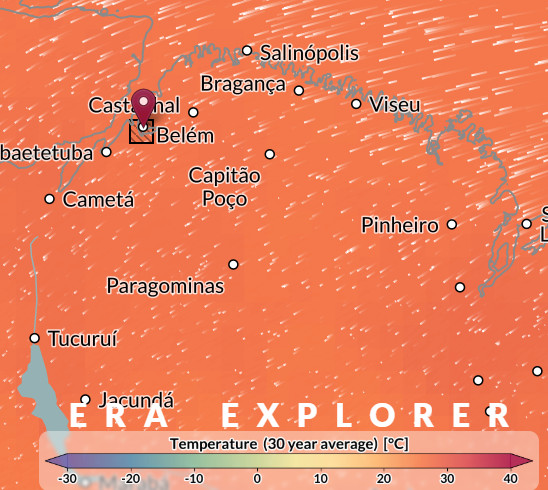
In this resource, students will use climate graphs taken from Copernicus’ ERA explorer, to determine which climate zone three cities in Brazil are in; Belém, Quixeramobim and Porto Alegre.
The cities have been chosen to represent Tropical, Dry and Temperate climate zones respectively.
The worksheet is adaptable so that you can choose which parts are appropriate for your class.
Learning Objectives include:

Image: Adam Peterson Wikipedia
Köppen climate types of Brazil CC BY-SA 4.0


COP29 will take place in Azerbaijan in November 2024.
Adapt these ideas to support your teaching in the weeks leading up to and during the conference to engage your students with the negotiations and where they are taking place:
Priorities for COP29 include:

Data sources: Google Earth, https://weatherandclimate.com/ and https://en.climate-data.org/ November mean temperatures (°C)
Explore the Global Carbon Atlas (some sample screenshots are below)
Graphical/ Numerical skills:

Source: Global Carbon Atlas

Source: Global Carbon Atlas
Use https://showyourstripes.info/ or the IPCC’s Interactive Atlas to see how the climate of Azerbaijan is changing relative to the whole world or to the UK.

Source: Showyourstripes.info Ed Hawkins/ University of Reading
Explore https://climateknowledgeportal.worldbank.org/country/azerbaijan/heat-risk and https://drmkc.jrc.ec.europa.eu/inform-index/INFORM-Climate-Change/INFORM-Climate-Change-Tool
https://drmkc.jrc.ec.europa.eu/inform-index/INFORM-Climate-Change/Results-and-data
Also
https://drmkc.jrc.ec.europa.eu/inform-index/INFORM-Risk/Country-Risk-Profile
https://drmkc.jrc.ec.europa.eu/inform-index/INFORM-Risk/Risk-Facts-Figures
How vulnerable is Azerbaijan to climate change? What impact of climate change (sea level change, river flooding, drought, disease or conflict) poses the greatest risk to Azerbaijan?

Source EU/ Inform Climate Change Tool
Climate justice recognises the fact that the people and countries most vulnerable to climate change are often not the ones who have done the most to cause it.
Thinking about Azerbaijan’s greenhouse gas emissions, GDP and vulnerability to climate change, write a paragraph to justify this definition of climate justice.
Possible extension – Azerbaijan’s climate mitigation action is rated ‘critically insufficient’ by the Climate Action Tracker. How does this relate to the concept of climate justice?
Other useful sources of information:
https://www.adb.org/publications/climate-risk-country-profile-azerbaijan
https://unfccc.int/sites/default/files/NDC/2023-10/Second%20NDC_Azerbaijan_ENG_Final%20%281%29.pdf
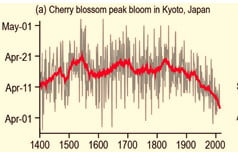
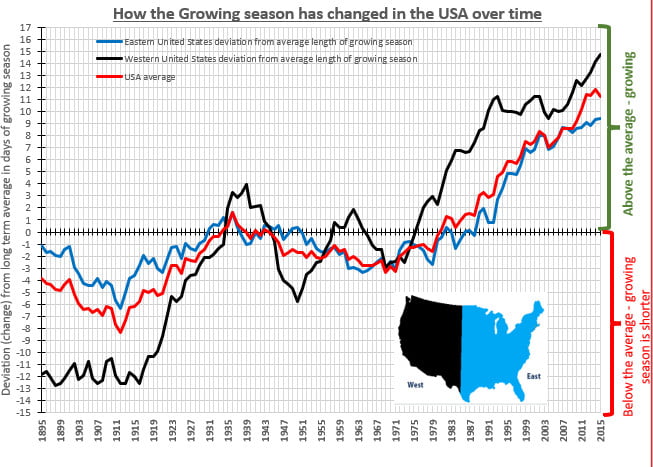
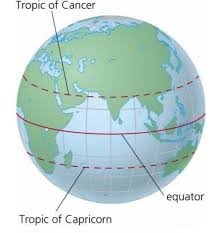
According to the IPCC report for Policymakers “Changes in the land biosphere since 1970 are consistent with global warming: climate zones have shifted poleward in both hemispheres, and the growing season has on average lengthened by up to two days per decade since the 1950s North of the Tropic of Cancer”1
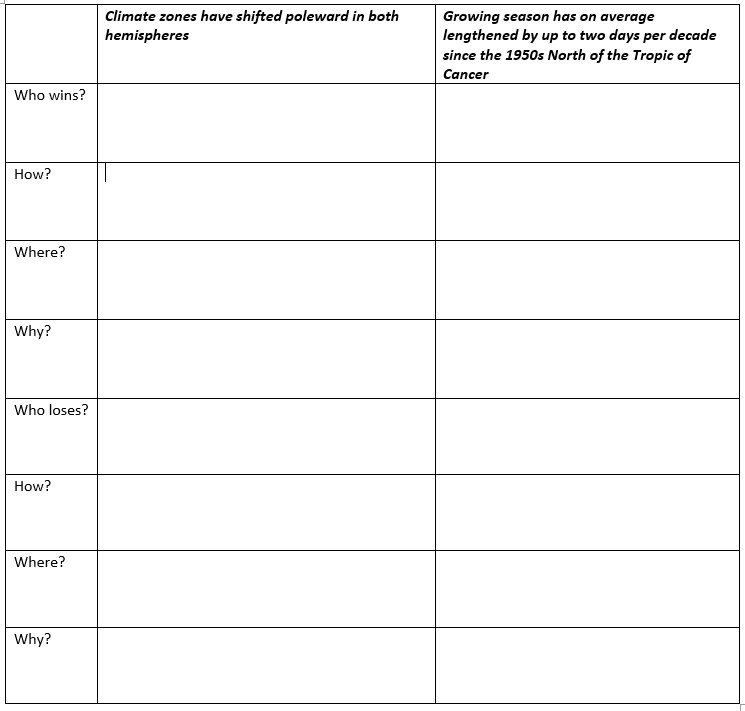
Summary of changes to the Biosphere from the report2
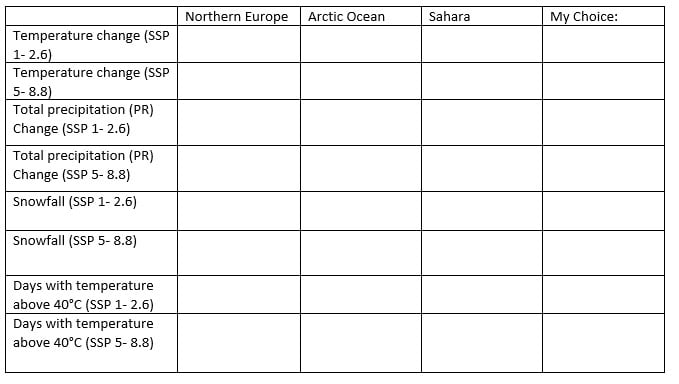
2. Map the changes listed above on the appropriate regions on the world map below:
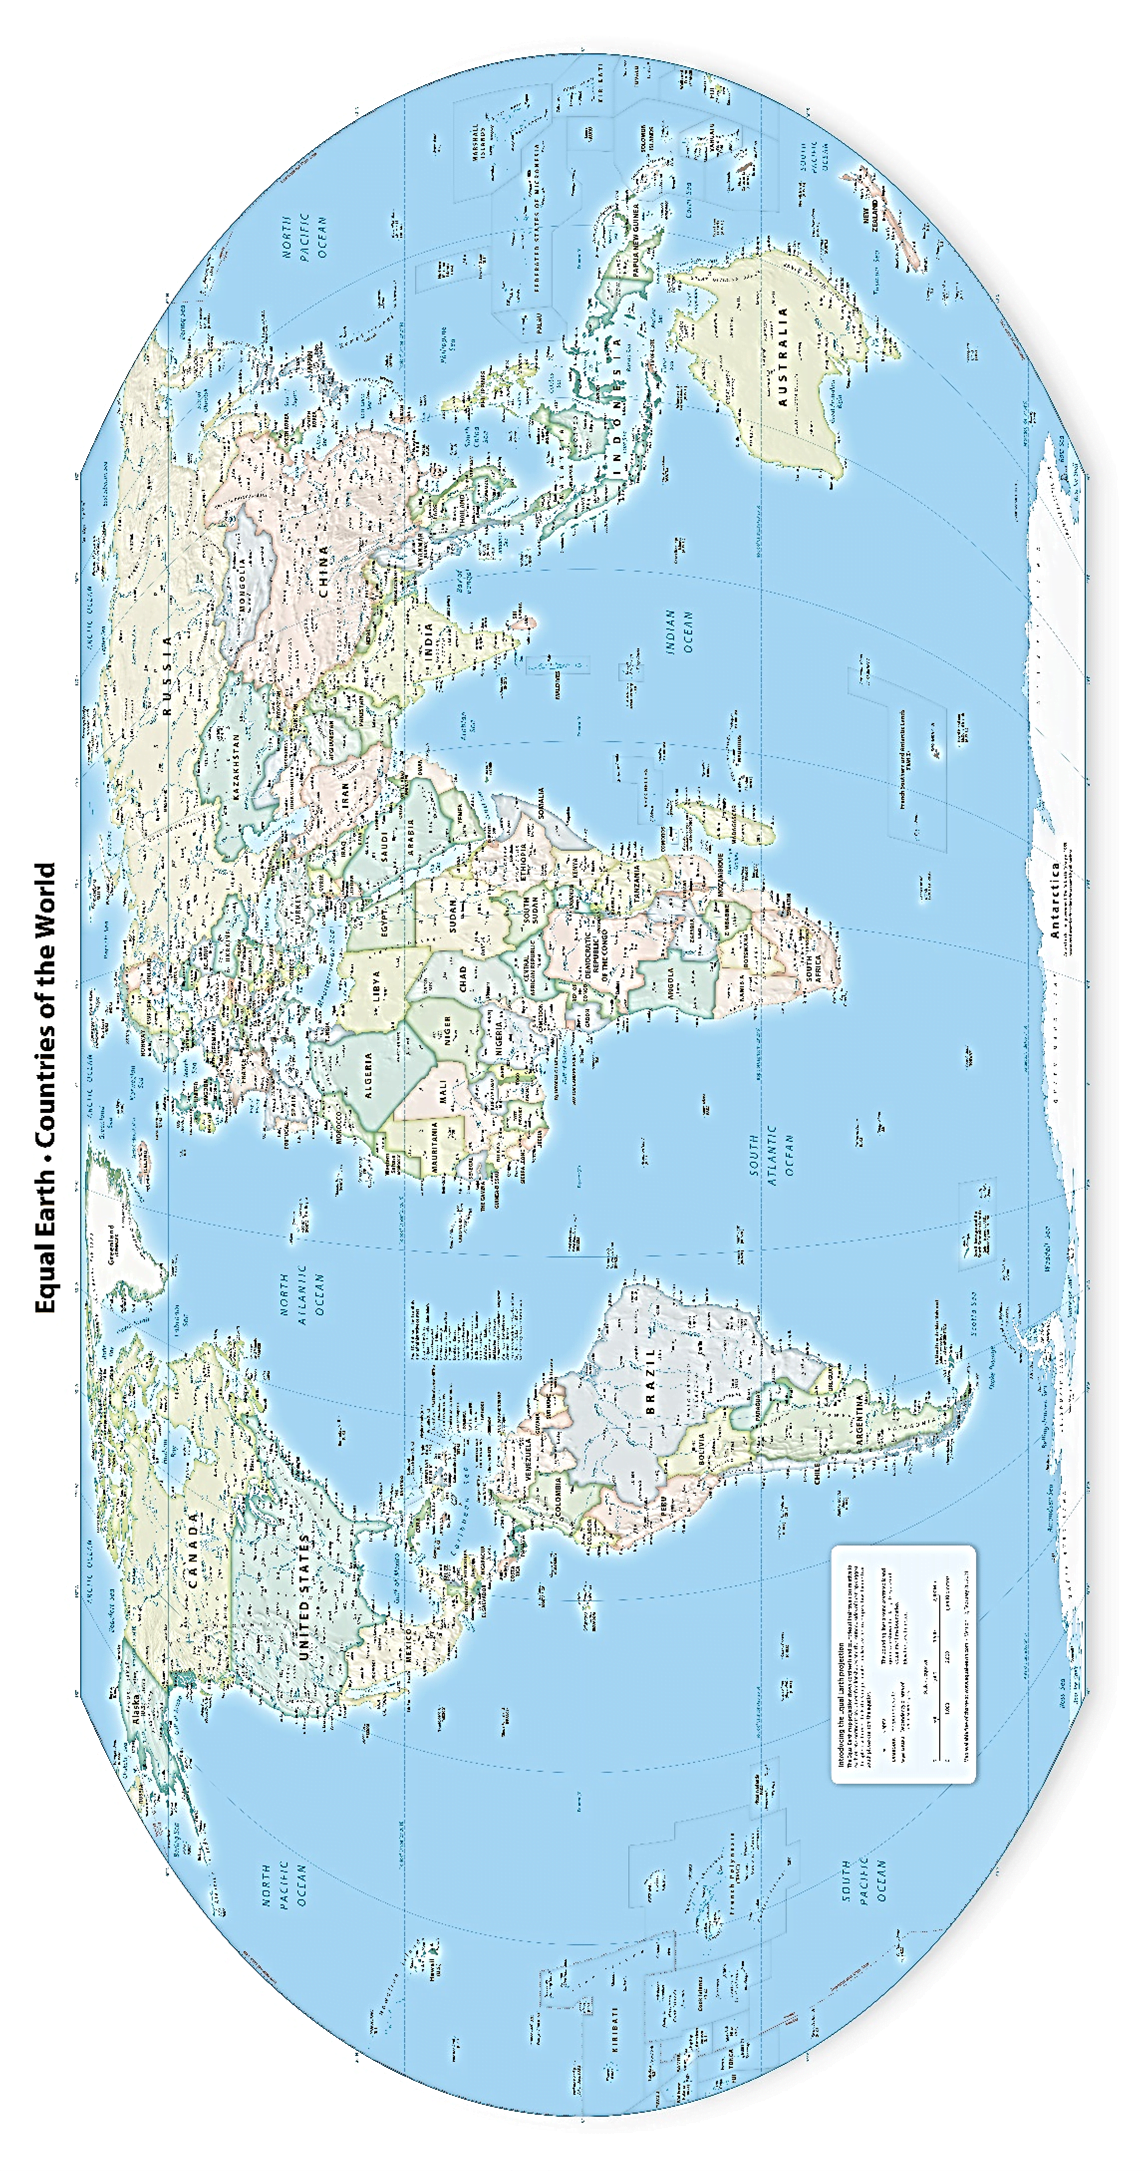
Source – https://equal-earth.com/
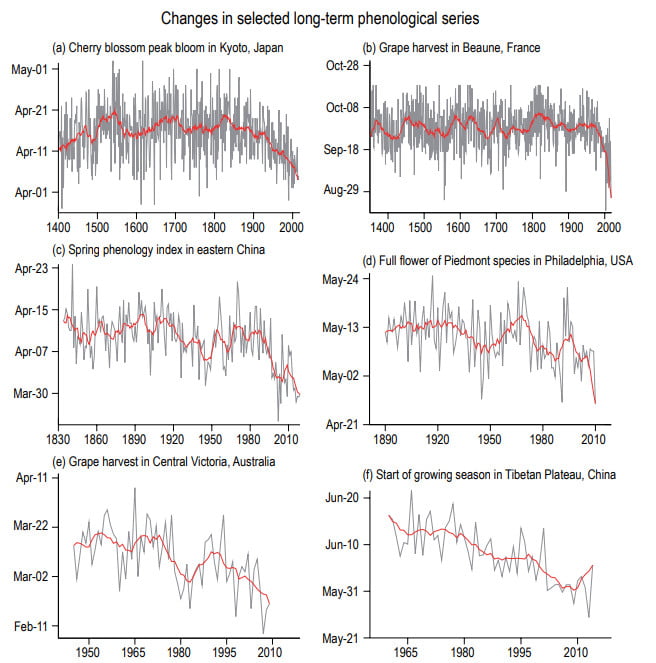
Image source: Adjusted from IPCC 1
Study the graph5 below:

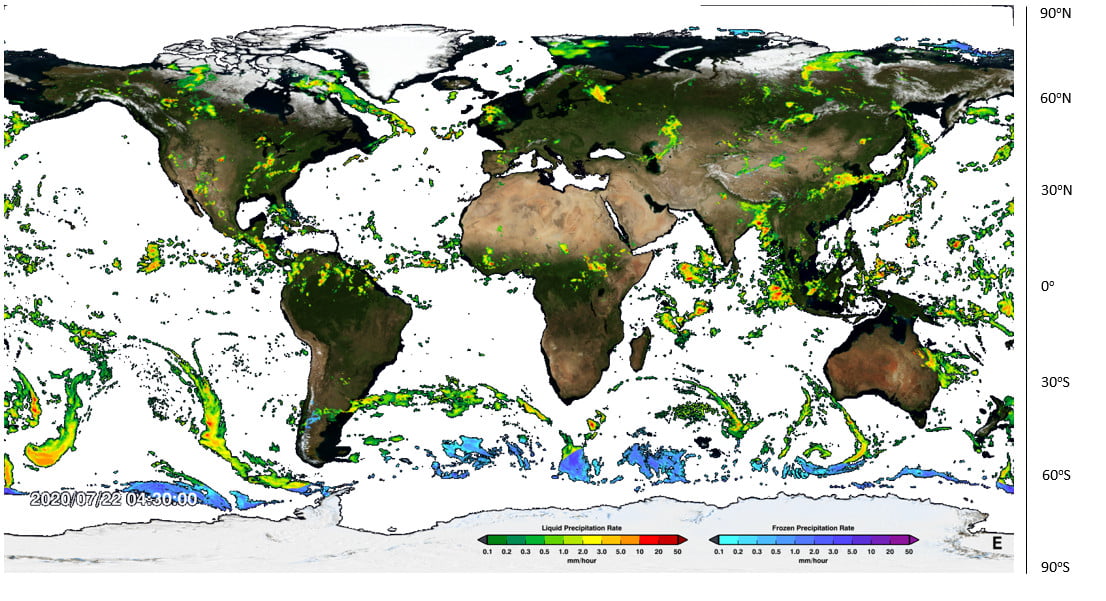

3. What is the type of land is below these rainfall patterns? (Green is forest, brown is desert).
4. In what latitude bands are these rainfall patterns?
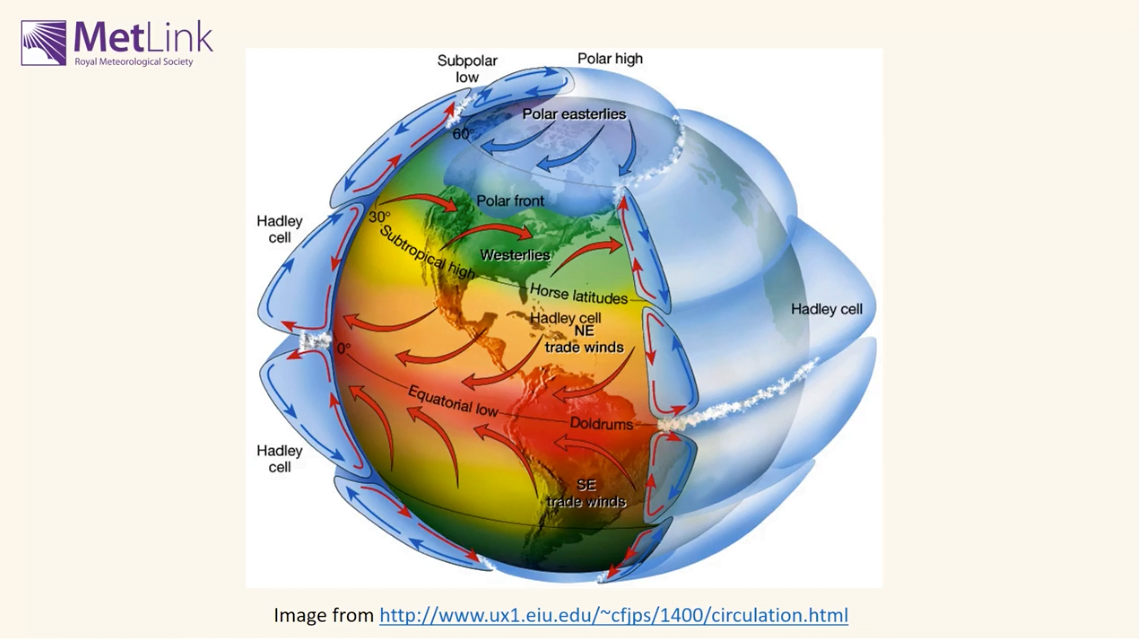
Use these terms to fill in the blanks below for Questions 5-8: Hadley, cloud, humid, Sun, cloud, rainfall, low, ground, Ferrel, fronts, Equator, Hadley, poles, rainfall.
5. Rainfall occurs when ______ air cools down. Air cools when it rises, or when it moves away from the _______.
6. The Atmospheric Circulation is driven by the _____. In the Tropics, the Sun warms the _____ which in turn warms the air above. hot air rises, leading to _____ and _______. This drives the ________ cells.
7. Colder air sinks at the poleward edge of the _______ cells and over the __________. Sinking air has no _______ or __________.
8. In the _______ Cells, rainfall is mainly associated with ____ pressure systems (depressions). Rainfall is mainly on the ________.
9. Complete the following table (Look at the map for help):
Tropics | Sub Tropics | Poles | |
Skies | Clear/ Cloudy | Clear/ Cloudy | Clear/ Cloudy |
Rain (or snow)-fall | Dry/ Wet | Dry/ Wet | Dry/ Wet |
Pressure | High/ Low | High/ Low | High/ Low |
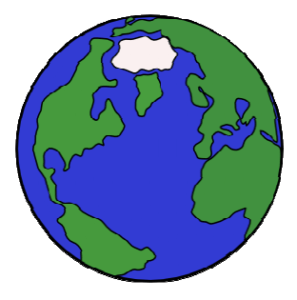
10. Sketch what you think the Hadley Cell looks like in December and June by the images of the Earth below. Hint: the Equator and Tropics of Cancer and Capricorn are shown on the map.
Visit https://earth.nullschool.net/#current/wind/surface/level/overlay=precip_3hr/orthographic to see today’s rainfall patterns. Click on ‘Earth’ and then choose in the Overlay settings ‘3HPA’ to see the rainfall patterns together with surface wind speeds. Change in the settings the ‘Control’ to change the date and see rainfall patterns over time. Compare January and July rainfall patterns.
11. In the Tropics, how does the latitude of highest rainfall change between January and July? ___________________________________
12. How does this relate to the sketches you drew above? ___________________________________________________________________________________________________________________________________________________________________________________________________________________________________________________
Extension question: Why do you think you are asked to look at rainfall in January and July, rather than December and June? ___________________________________________________________________________________________________________________________________________________________________________________________________________________________________________________

Our planet has several climatic zones; their classification is based on the temperature and precipitation over the seasons. The climatic zones can be simplified into:
Polar and Mountains – very cold and dry all year
Cool Temperate – cold winters and mild summers
Warm Temperate – mild winters, dry hot summers
Arid or Desert – dry, hot all year
Tropical – hot and wet all year
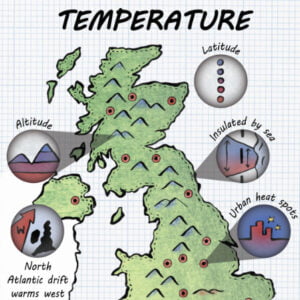
The climate of an area is affected by several factors: latitude (distance to the Equator), terrain, altitude (height) and how far from the sea or ocean it is.
Coloured pencils
Plasticine (white, blue, green and black)
A small ball
A lamp
Discuss the idea of different regions of the world experiencing different climates. Make a mind map using ideas from pupils about climate zones and the factors that may affect the climate of a region.
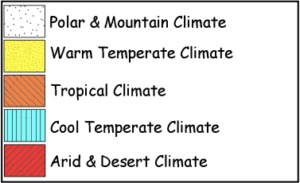
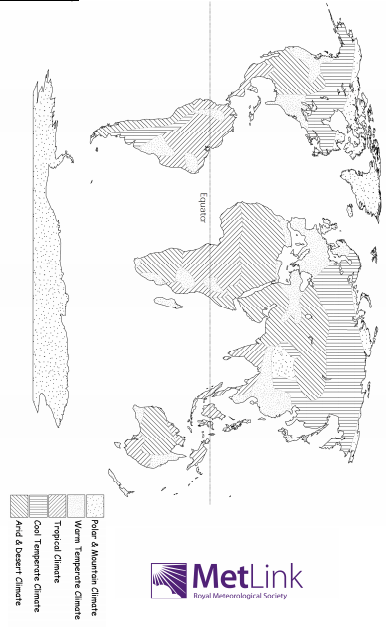
Colour in the climate map below and colour it in according to the key.
N.B. Pupils may find the subsequent tasks easier if a logical colouring code is used like the one shown. Where hotter regions are highlighted in warm colours and cooler regions in cool colours, for simplicity the polar & mountain climate zones can stay white.
With the map coloured, pupils should look for patterns in the locations of the climate zones. Start by looking at the proximity to the equator and altitude with younger pupils. Explain that climate is in part affected by the absorption of heat from the sun. Different objects absorb heat at different rates (water is slower to heat and cool, land is much faster).
Climate Zones: Internet Geography
Climates of the World: (Climate Zones) – detailed climate information for individual countries and areas within countries.
1. Modelling the Earth
You will need:
– Blue plasticine
– A small ball
– A heat lamp
Method: Make a model of the earth by covering a small ball with plasticine. Put the heat lamp a fair distance away from the ball – maybe 1m. Shine the heat lamp on the plasticine for a few minutes. Feel the difference in temperature between the ‘equator’ and the ‘poles’.
Results: The areas of the ball facing the lamp should feel much warmer than the areas pointing away – either the ‘poles’ or the ‘night’ side of the ball. When the surface of the Earth isn’t at right angles to the Sun, the Sun’s energy is spread over a wider area and it doesn’t heat up as much. This is the cause of much of the Earth’s weather. As the Earth orbits around the Sun, the Sun moves from being at right angles to the Tropic of Cancer to be overhead at the Tropic of Capricorn. This gives us seasons.
2. Modelling the Earth
You will need:
– White, blue and dark green plasticine
[Hint: Mixing some black with the green plasticine makes
a dark green that gives really good results]
– A small ball
– A sunny day
Method: Make a flat model of the earth by covering a piece of cardboard with white (Polar regions), blue (sea) and dark green (land) plasticine. Leave the map out in the Sun for 10 minutes. Feel the difference in temperature between the white and dark green areas.
Results: The darker areas should feel much warmer than the white poles. The colour of the area of land affects the ability to absorb light. Whiter regions (like the poles and mountains) reflect light and darker regions (like vast areas of tropical rainforest) absorb light and get warmer.
Use this Global Atmospheric Circulation practice exercise.
Changes to the Global Atmospheric Circulation as the climate changes.
Other Useful Links
| Curriculum Links | |||
| Year 4 | Scheme of Work | Plants | Literacy |
| Year 3/ 4 | Scheme of Work | Climate zones | |
| Year 5/6 | Scheme of Work | Climate zones | Science – Light, Fossils |
The Climate Change Schools Resources were developed by the Climate Change Schools Project, based at the then Science Learning Centre in Durham and led by Krista McKinzey. A large number of teachers and schools in North East England were involved in their development.
They have subsequently been updated by the Royal Meteorological Society.
Pathway: Climate
Climate Zones – Past Climate Change – Polar Climate – Hot Deserts
Lesson overview: In this lesson we look at the characteristics and locations of hot deserts and the adaptations of animals and vegetation found there.
Hot deserts have less than 250mm precipitation per year and daytime temperatures that may approach 50oC. Hot deserts cover 14.2% of the Earth’s surface, their distribution largely determined by the global atmospheric circulation. Physical factors such as altitude or latitude determine deserts with the most extreme values of precipitation/temperature. Their characteristics and distribution will change over long periods of time due to the Milankovitch cycles and Continental Drift. Climate change is projected to have complex effects and the size of arid regions is expected to grow. The plants and animals that live in the deserts around the world have adapted to cope with the extreme climate.
Learning objectives:
To be able to describe the characteristics and location of at least one hot desert.
To understand why hot deserts are hot and dry.
To be able to draw and interpret a climate graph of a hot desert.
To understand animal and plant adaptations to the hot desert climate.
Key Teaching Resources
Hot Deserts PowerPoint
Hot Deserts PowerPoint (easier)
Hot Deserts Worksheet
Hot Deserts Making Plants and Animals
Hot Deserts Making Plants and Animals – Info sheet
Hot Deserts homework
Teacher CPD/ Extended Reading
Read
Or watch
Alternative or Extension Resources
Using GIS to investigate temperature extremes
Pathway: Climate
Atmospheric and Oceanic Circulation – Climate Zones – Past Climate Change – Polar Climate
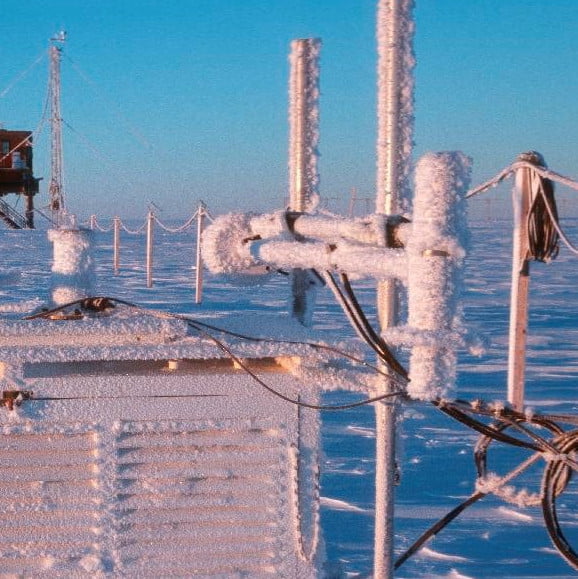
Lesson overview: In this lesson we investigate why polar climates are so extreme and how it can be too cold to snow in Antarctica.
The extremes of Polar weather – the lowest temperatures on Earth and little precipitation – vary significantly throughout the year. Antarctica has the harshest conditions, recording an annual mean low of nearly -60oC due to its elevation and distance from the sea. Low levels of precipitation define Polar regions as deserts and it can be too dry to snow. The effects of climate change are amplified in these regions through feedback mechanisms which in turn affect global climate.
Learning objectives:
To understand why it is cold in Polar regions.
To understand why our Polar regions are classified as deserts.
To be able to calculate mean temperature and total precipitation and interpret a climate graph
Key Teaching Resources
Polar Climate PowerPoint
Polar Climate PowerPoint (easier)
Polar Climate Worksheet
Polar Climate Worksheet (easier)
Beast from the East homework
Teacher CPD/ Extended Reading
Read
Polar Climate – More for Teachers
or Watch
Alternative or Extension Resources
Using GIS to investigate temperature extremes
Drawing polar climate graphs to look for evidence of climate change
Changing polar climate (advanced)
Impacts of polar climate change (advanced)
Comparing Arctic and global temperatures – data skills exercise – worksheet or Excel