Climate Zones
Background Information:
Our planet has several climatic zones; their classification is based on the temperature and precipitation over the seasons. The climatic zones can be simplified into:
Polar and Mountains – very cold and dry all year
Cool Temperate – cold winters and mild summers
Warm Temperate – mild winters, dry hot summers
Arid or Desert – dry, hot all year
Tropical – hot and wet all year
The climate of an area is affected by several factors: latitude (distance to the Equator), terrain, altitude (height) and how far from the sea or ocean it is.
Materials:
Coloured pencils
Plasticine (white, blue, green and black)
A small ball
A lamp
Suggested activities:
Discuss the idea of different regions of the world experiencing different climates. Make a mind map using ideas from pupils about climate zones and the factors that may affect the climate of a region.
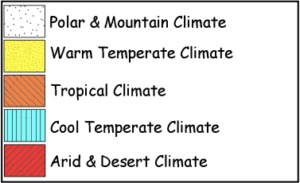
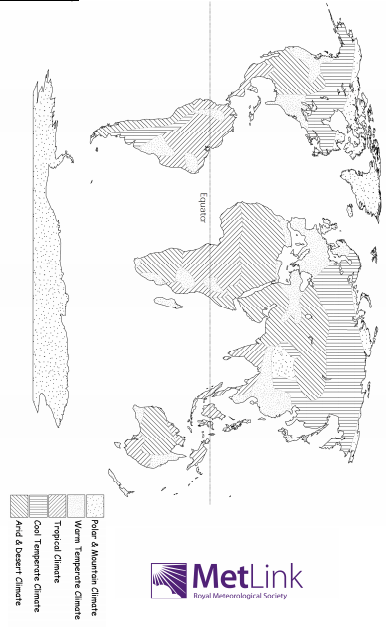
Colour in the climate map below and colour it in according to the key.
N.B. Pupils may find the subsequent tasks easier if a logical colouring code is used like the one shown. Where hotter regions are highlighted in warm colours and cooler regions in cool colours, for simplicity the polar & mountain climate zones can stay white.
With the map coloured, pupils should look for patterns in the locations of the climate zones. Start by looking at the proximity to the equator and altitude with younger pupils. Explain that climate is in part affected by the absorption of heat from the sun. Different objects absorb heat at different rates (water is slower to heat and cool, land is much faster).
References/Resources:
Climate Zones: Internet Geography
Climates of the World: (Climate Zones) – detailed climate information for individual countries and areas within countries.
Practical Activities:
1. Modelling the Earth
You will need:
– Blue plasticine
– A small ball
– A heat lamp
Method: Make a model of the earth by covering a small ball with plasticine. Put the heat lamp a fair distance away from the ball – maybe 1m. Shine the heat lamp on the plasticine for a few minutes. Feel the difference in temperature between the ‘equator’ and the ‘poles’.
Results: The areas of the ball facing the lamp should feel much warmer than the areas pointing away – either the ‘poles’ or the ‘night’ side of the ball. When the surface of the Earth isn’t at right angles to the Sun, the Sun’s energy is spread over a wider area and it doesn’t heat up as much. This is the cause of much of the Earth’s weather. As the Earth orbits around the Sun, the Sun moves from being at right angles to the Tropic of Cancer to be overhead at the Tropic of Capricorn. This gives us seasons.
2. Modelling the Earth
You will need:
– White, blue and dark green plasticine
[Hint: Mixing some black with the green plasticine makes
a dark green that gives really good results]
– A small ball
– A sunny day
Method: Make a flat model of the earth by covering a piece of cardboard with white (Polar regions), blue (sea) and dark green (land) plasticine. Leave the map out in the Sun for 10 minutes. Feel the difference in temperature between the white and dark green areas.
Results: The darker areas should feel much warmer than the white poles. The colour of the area of land affects the ability to absorb light. Whiter regions (like the poles and mountains) reflect light and darker regions (like vast areas of tropical rainforest) absorb light and get warmer.