Home » Teaching Resources » IPCC 2021 – Which Regions have been affected the most by climate change?

IPCC 2021 – Which Regions have been affected the most by climate change?

Facebook
Twitter
Pinterest
Print

“A.3 Human-induced climate change is already affecting many weather and climate extremes in every region across the globe. Evidence of observed changes in extremes such as heatwaves, heavy precipitation, droughts, and tropical cyclones, and, in particular, their attribution to human influence, has strengthened since AR5”1

Consider the three following maps with your students, or alternatively focus in on one of the maps.

Heavy Precipitation

“A.3.2 The frequency and intensity of heavy precipitation events have increased since the 1950s over most land area for which observational data are sufficient for trend analysis (high confidence), and human-induced climate change is likely the main driver. Human-induced climate change has contributed to increases in agricultural and ecological droughts in some regions due to increased land evapotranspiration (medium confidence).”1

IPCC precipitation

Source: Adjusted from IPCC 1

  1. Study carefully the map above which shows an assessment of the observed change in heavy precipitation across the globe.
  2. How many of the regions showing on the map have experienced an increase in heavy precipitation?                                                                                                                                                            
  3. How many of the regions shown on the map have experienced a decrease in heavy precipitation?                                                                                                                                                            
  4. What is the situation in the region where you live with regards to changes in heavy precipitation?                                                                                                                                                            
  5. Identify the region where there is high confidence in the human contribution to the observed change.                                                                                                                                                            
  6. Use TEA (Trend, Evidence, Anomoly) to describe the patterns shown on the map above. Which regions have had an increase in observed heavy precipitation? Which regions have limited evidence?                                                                                                                                                                                                                                                                                                                                                                                                                                                                                                                                                                                                                                                                                                                                                                                               
  7. Suggest what impacts an increase in heavy precipitation might have.                                                                                                                                                                                                                                                                                                                                                                                                                        
  8. Look closely at the areas that have limited data and/or literature. Can you suggest reasons why these areas have limited data and literature in relation to heavy precipitation?                                                                                                                                                                                                                                                                                                                                                                                                                                                                                                                                                                                                                                    

Hot Extremes

“A.3.1 It is virtually certain that hot extremes (including heatwaves) have become more frequent and more intense across most land regions since the 1950s, while cold extremes (including cold waves) have become less frequent and less severe, with high confidence that human-induced climate change is the main driver14 of these changes. Some recent hot extremes observed over the past decade would have been extremely unlikely to occur without human influence on the climate system. Marine heatwaves have approximately doubled in frequency since the 1980s (high confidence), and human influence has very likely contributed to most of them since at least 2006.” 1

IPCC hot extremes

Source: Adjusted from IPCC 1

The IPCC define an extreme weather event as “an event that is rare at a particular place and time of year. Definitions of rare vary, but an extreme weather event would normally be as rare as or rarer” than the top or bottom 10% of observed events. Therefore, for hot extremes these would be periods where temperatures are in the top 10% for that region. 1

  1. Study the map above carefully which shows an assessment of the observed change in hot extremes across the globe.
  2. How many of the regions showing on the map have experienced an increase in hot extremes?                                                                                                                                                                                                                                                                                                                        
  3. How many of the regions shown on the map have experienced a decrease in hot extremes?                                                                                                                                                                                                                                                                                                                        
  4. What is the situation in the region where you live with regards to changes in hot extremes?                                                                                                                                                                                                                                                                                                                        
  5. Identify the region where there is high confidence in the human contribution to the observed change.                                                                                                                                                            
  6. Describe the patterns shown in the regions that have had an increase in observed hot extremes.                                                                                                                                                                                                                                                                                                            
  7. Suggest what impacts an increase in hot extremes might have.                                                                                                                                                                                                                                                                                                                                                                                                                                                                                                                                                                                                                                                
  8. Look closely at the areas that have limited data and/or literature on both the hot extremes and heavy precipitation maps. There are more regions with limited data on the heavy precipitation map.  Can you suggest reasons why?                                                                                                                                                                                                                                                                                                                                                                                                                 

Agricultural and Ecological Drought

“A.3.5 Human influence has likely increased the chance of compound extreme events18 since the 1950s. This includes increases in the frequency of concurrent heatwaves and droughts on the global scale (high confidence)”1

IPCC drought

Image source: Adjusted from IPCC 1

The IPCC define Drought as “A period of abnormally dry weather long enough to cause a serious hydrological (water) imbalance.”1 This would mean that the amount of rain that falls is not sufficient to meet agricultural (farming) or ecological (the plants and animals in a region) needs and during the growing season impinges on crop production or ecosystem function.

  1. How many of the regions showing on the map have experienced an increase in agricultural and ecological drought?                                                                                                                                                            
  2. How many of the regions shown on the map have experienced a decrease in agricultural and ecological drought?                                                                                                                                                            
  3. Identify the two regions where there is medium confidence in the human contribution to the observed change.                                                                                                                                                                                                                                                                                                                        
  4. What is the situation in the region where you live with regards to changes in agricultural and ecological drought?                                                                                                                                                                                                                                                                                                                                                                                                                                                
  5. Describe the patterns shown in the regions that have had an increase in observed agricultural and ecological drought.                                                                                                                                                                                                                                                                                                                                                                                                                                                                                    
  6. Suggest what impacts an increase in agricultural and ecological drought might have.                                                                                                                                                                                                                                                                                                                                                                                                                                                                                                                                                                                                                                                                                                                                                                                                            
  7. Look closely at the areas that have limited data and/or literature. Can you suggest reasons why these areas have limited data and literature in relation to agricultural and ecological drought?                                                                                                                                                                                                                                                                                                                                                                                                                                                                        

Overview – Which Regions have been Affected the Most?

IPCC extreme weather overview
Source: Adjusted from IPCC 1
  1. Using the graphic above identify three places but are affected negatively by all three situations [hot extremes, heavy precipitation, and agricultural and ecological drought]
    1.                                                                       
    2.                                                                       
    3.                                                                       
  2. Using the graphic identify an area that that is affected by fewest of the situations?                                                                                                                                                            
  3. Which areas on the map should be a priority for further research into the effects of climate change? Explain your answer.                                                                                                                                                                                                                                                                                                
  4. Which of the three situations have affected most regions of the world? Use evidence from the maps to support your answer.                                                                                                                                                                                                                                                                                                                                                                                                                                                                                                                                                                                                                                    
  5. Write a letter to your local MP, use evidence from the graphic to justify the need for action on climate change. You should focus upon the urgent need for action and how that can be implemented (done) locally.

Geographical information systems activity

Visit the website below, it is the Intergovernmental Panel on Climate Change’s Interactive Atlas. IPCC WGI Interactive Atlas Click on the regional information button, it will bring up an interactive map. Complete the table below using information from the map. You will need to use the menu tools above the map, changing the variable and scenario. Complete this for the Near Term. If you finish, you could repeat for the Long Term on a new sheet and then compare results.
IPCC extreme weather table

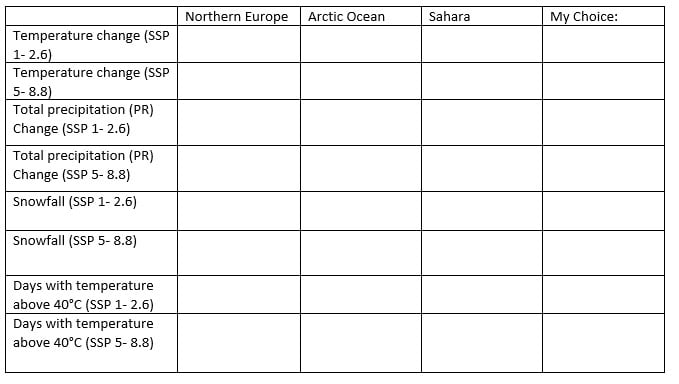
Overall what does the table and map show you about global climates in the future?                                                                                                                                                                                                                                                                                                                                                                                                                                                                                                                                                                                                                                                                                                                                                                                                                                                                                                                                                                                                                                                                                                                                                                                                                                                        

Note 

  • SSP1-2.6: Global CO2 emissions are cut severely, but not as fast, reaching net-zero after 2050. Temperatures stabilize around 1.8°C higher by the end of the century.
  • SSP5-8.5: Current CO2 emissions levels roughly double by 2050. The global economy grows quickly, but this growth is fuelled by exploiting fossil fuels and energy-intensive lifestyles. By 2100, the average global temperature is a scorching 4.4°C higher.

Sources:

  • IPCC, 2021: Climate Change 2021: The Physical Science Basis. Contribution of Working Group I to the Sixth Assessment Report of the Intergovernmental Panel on Climate Change [Masson-Delmotte, V., P. Zhai, A. Pirani, S.L. Connors, C. Péan, S. Berger, N. Caud, Y. Chen, L. Goldfarb, M.I. Gomis, M. Huang, K. Leitzell, E. Lonnoy, J.B.R. Matthews, T.K. Maycock, T. Waterfield, O. Yelekçi, R. Yu, and B. Zhou (eds.)]. Cambridge University Press. In Press. P.11. Accessed 28th November 2021 at Sixth Assessment Report (ipcc.ch)
Climate Change Quality Mark Content

Start exploring

Latest from blog

Related resources …
Secondary Geography
How will urban areas be affected by climate change?