- Visit https://svs.gsfc.nasa.gov/4285 and play the animation showing most currently available global precipitation data.
- Look at the map below. Circle any patterns of rainfall that you see.
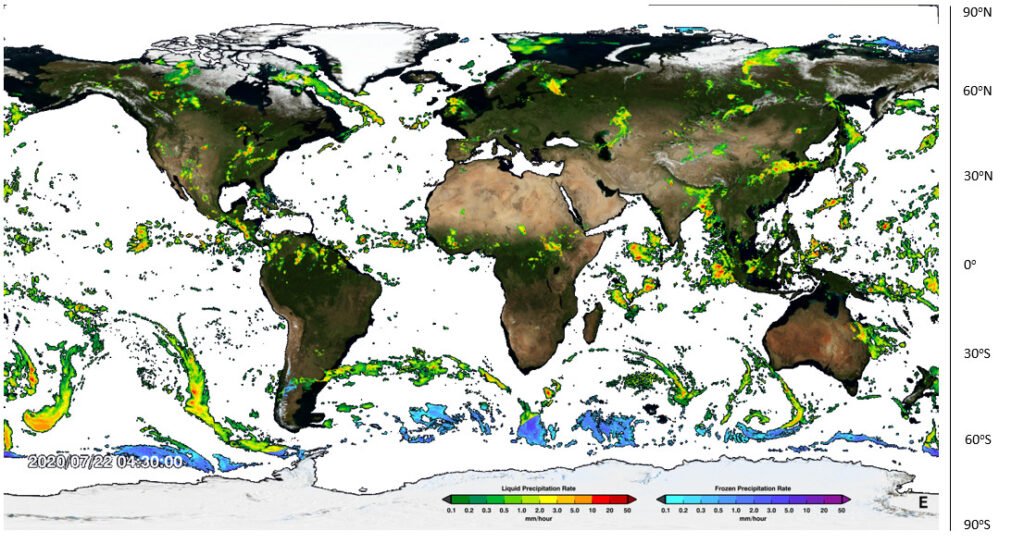
3. What is the type of land is below these rainfall patterns? (Green is forest, brown is desert).
4. In what latitude bands are these rainfall patterns?
Use these terms to fill in the blanks below for Questions 5-8: Hadley, cloud, humid, Sun, cloud, rainfall, low, ground, Ferrel, fronts, Equator, Hadley, poles, rainfall.
5. Rainfall occurs when ______ air cools down. Air cools when it rises, or when it moves away from the _______.
6. The Atmospheric Circulation is driven by the _____. In the Tropics, the Sun warms the _____ which in turn warms the air above. hot air rises, leading to _____ and _______. This drives the ________ cells.
7. Colder air sinks at the poleward edge of the _______ cells and over the __________. Sinking air has no _______ or __________.
8. In the _______ Cells, rainfall is mainly associated with ____ pressure systems (depressions). Rainfall is mainly on the ________.
9. Complete the following table (Look at the map for help):
Tropics | Sub Tropics | Poles | |
Skies | Clear/ Cloudy | Clear/ Cloudy | Clear/ Cloudy |
Rain (or snow)-fall | Dry/ Wet | Dry/ Wet | Dry/ Wet |
Pressure | High/ Low | High/ Low | High/ Low |
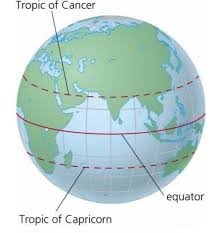
10. Sketch what you think the Hadley Cell looks like in December and June by the images of the Earth below. Hint: the Equator and Tropics of Cancer and Capricorn are shown on the map.
Visit https://earth.nullschool.net/#current/wind/surface/level/overlay=precip_3hr/orthographic to see today’s rainfall patterns. Click on ‘Earth’ and then choose in the Overlay settings ‘3HPA’ to see the rainfall patterns together with surface wind speeds. Change in the settings the ‘Control’ to change the date and see rainfall patterns over time. Compare January and July rainfall patterns.
11. In the Tropics, how does the latitude of highest rainfall change between January and July? ___________________________________
12. How does this relate to the sketches you drew above? ___________________________________________________________________________________________________________________________________________________________________________________________________________________________________________________
Extension question: Why do you think you are asked to look at rainfall in January and July, rather than December and June? ___________________________________________________________________________________________________________________________________________________________________________________________________________________________________________________