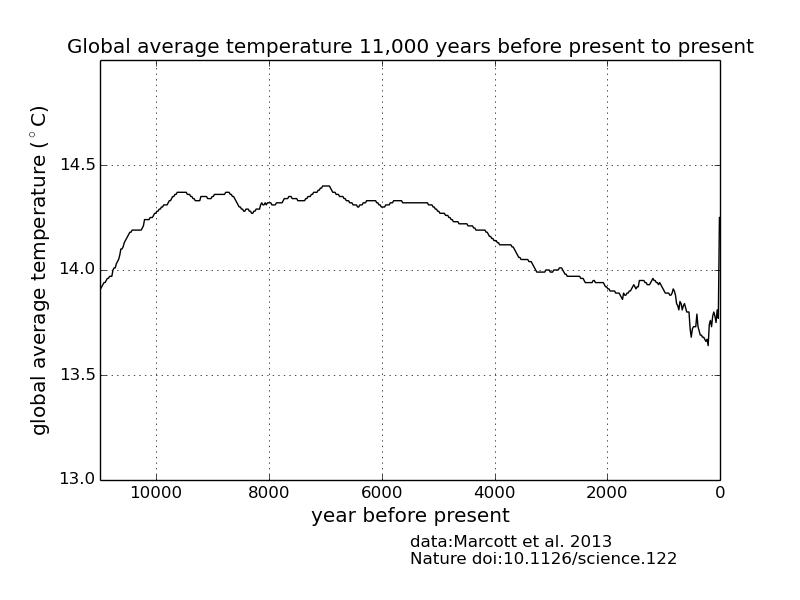

Climate graph, 11,000 years, without uncertainty
Climate graph, 11,000 years, with uncertainty
A Timeline of Earth’s Average Temperature
Interpreting a temperature graph
< Module 1 – the last 2.6 Million years | All Modules | Module 3 – the last 2000 years >

In this lesson we look at how urban areas have an impact on temperature, wind, air quality and precipitation.
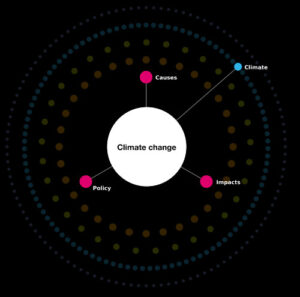
For curriculum developers and other communicators to explore the diverse range of concepts associated with climate change and the links between them.


Questions to consider:State three factors which would cause a change to the Amazonian Forest Ecosystem.Explain the impact of the change to the Amazonian Forest EcosystemWhen