In Depth – Rainfall and Relief

Precipitation has been recorded in the British Isles for over 200 years. Through the dedication and enthusiasm of W R Symons, the mid-19th century saw the formation of the British Rainfall Organisation whose main objective was to establish a countrywide network of rain gauges where daily measurements were made. This network has grown to over 7,000 gauges today, including many that are automatic. 

As most people in the British Isles know, precipitation can be extremely variable, both in intensity and duration. The spatial distribution of precipitation during an individual month is very uneven, just as it is on an individual day. Rainfall in Britain is associated with several distinct synoptic situations; all places may get rain from most such types, but some areas get more from some types than others. Therefore, it is not surprising that patterns of temporal variation of rainfall are complex.

Precipitation over the British Isles is the result of one or more, of three basic mechanisms.

1. Cyclonic, or frontal, rain associated with the passage of low-pressure systems. Bands of rain are associated with the passage of warm and cold fronts across the UK. These rain events are caused by the uplift and cooling of moist air parcels.

2. Convectional, with local showers and thunderstorms, caused by the localised thermal heating and overheating of the ground surface. Large towering cumulonimbus clouds may be generated, producing heavy rain.

3. Orographic, or relief rain, with precipitation increasing with altitude over upland areas. The mechanism for relief rain is the uplift and cooling of moist air over upland areas. The normal rate of cooling (environmental lapse rate) is 6.5 °C per 1,000 metres. Therefore, near the summit on the windward side of the hill or mountain, the air will have cooled sufficiently for thick cloud, rain and possibly snow to fall.

Air will descend and warm on the leeward side, so there is little or no rain on this leeward side of the hill or mountain. This is called a rain shadow, and sometimes there are warm winds in these sheltered areas as the air, now much drier than during its ascent, descends quickly and warms up. This is called a föhn effect, and the warm winds are called föhn winds.

Rain forms when air cools, the rate of condensation becomes faster than the rate at which water is evaporating and cloud droplets form. If these get big enough, they form as rain – or snow, sleet or hail.

There are various ways in which the air can cool to form rain – three common types which are often talked about are frontal, orographic or relief and convective rain. Frontal Rain
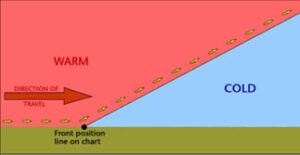
This is found where warm air meets cold at the cold and warm fronts in a depression.


Convective Rain

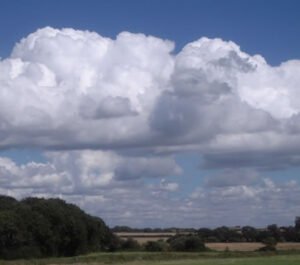
Convection is the term given to warm air rising. Convection is normally marked by cumulus clouds which billow upwards as the air rises. The base of such clouds is usually flat, marking the level where temperatures are cold enough for more condensation to be going on than evaporation.


Image copyright RMetS

Extreme convection can be found in thunder clouds – towering cumulonimbus, which can reach all the way up to the top of the troposphere – the lowest 10km or so of the atmosphere in which our weather is found. As air can’t rise into the stratosphere above, the top of the cumulonimbus cloud spreads out, giving it a characteristic ‘anvil’ shaped top. Such convection can occur where the ground has become particularly warm, heating the air above it. It is particularly associated with the Tropics, characteristically giving heavy rain in the late afternoon.

Cumulonimbus clouds can give heavy rain, hail, thunder lightning and sometimes tornadoes.
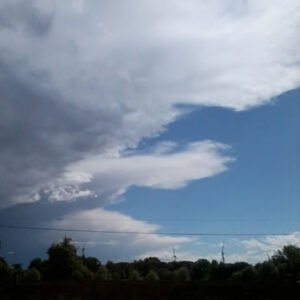

Cumulonimbus cloud over Kettering, UK, August 2014
Image copyright Sylvia Knight

Orographic or Relief Rain
When air is forced to rise over land, particularly higher ground such as hills and mountains, it cools as the pressure falls. Dry air cools at 9.8°C per 1000m it rises. Eventually, the air can cool enough for cloud to form.
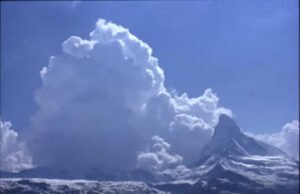

Orographic cloud forming upstream of the Matterhorn
Image copyright RMetS

The cloud droplets may get big enough to fall as rain on the upstream side of the mountain. If that happens, then, when the air has passed over the top of the mountain and starts to descend, and warm, on the far side, there will be less water to evaporate back into the air. The air will end up drier than it was on the upstream side of the mountain.

This can produce ‘rain shadow’ – an area of land downstream from some mountains (for the prevailing wind direction, in the UK, this would be to the east) where there is noticeably less rainfall. The Gobi desert in Mongolia and China is so dry because it is in the rain shadow of the Himalayas.

Orography can enhance frontal or convective rain; for example, we have explored how polar maritime air, our prevailing air mass, brings convective rain to the Atlantic. As the air reaches the UK and rises over the land, the precipitation is increased.
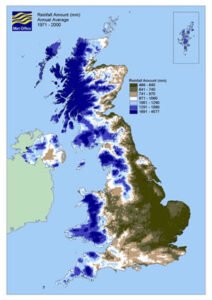

A precipitation map showing the rainfall ‘climate’ (averaged over 30 years) of the UK. With prevailing westerly winds, there is clearly more rain on the western side of the country, enhanced by the mountains of Wales and Scotland and the English Pennines.
As well as being drier on the downwind side of the mountains, it can also be warmer. Remember that water releases heat into the atmosphere as it condenses and takes it up as it evaporates. If there is less water in the air on the downwind side, then there is less to evaporate and not all the heat that was released on the upwind side will be taken up again. This is known as the Föhn Effect.

The onset of a Föhn is generally sudden. For example, the temperature may rise more than 10°C in five minutes and the wind strength increase from almost calm to gale force just as quickly. Föhn winds occur quite often in the Alps (where the name originated) and in the Rockies (where the name chinook is used). They also occur in the Moray Firth and over eastern parts of New Zealand’s South Island. In addition, they occur over eastern Sri Lanka during the south-west monsoon.

Where there are steep snow-covered slopes, a Föhn  may cause avalanches from the sudden warming and blustery conditions. In Föhn conditions, the relative humidity may fall to less than 30%, causing vegetation and wooden buildings to dry out. This is a long-standing problem in Switzerland, where so many fires have occurred during Föhn conditions that fire-watching is obligatory when a Föhn is blowing.


Teaching Resources

A case study of orographic rainfall and Foehn winds in Scotland with images for students Image 1, Image 2Image 3Image 4Image 5.

Water in the Atmosphere from Weather and Climate: a Teachers’ Guide

Make a cloud in a bottle

Data and Image Sources

UK climate data from the Met Office

Rain, Wind, Snow and Fog

We were delighted to support BBC Bitesize Scotland in the creation of these 21 videos for primary schools. Here are some of our best resources to support the teaching of these topics:


[all images on this page are copyright of the BBC]

How will water circulation and flooding change?

Royal Geographical Society

This resource links to Figure 11.12 in the IPCC report of 2021. The aim of this resource is to answer the question how will the flow of water around the world be altered with climate change?

It was written with the Royal Geographical Society with IBG

Climate Change Quality Mark Content

Circulation

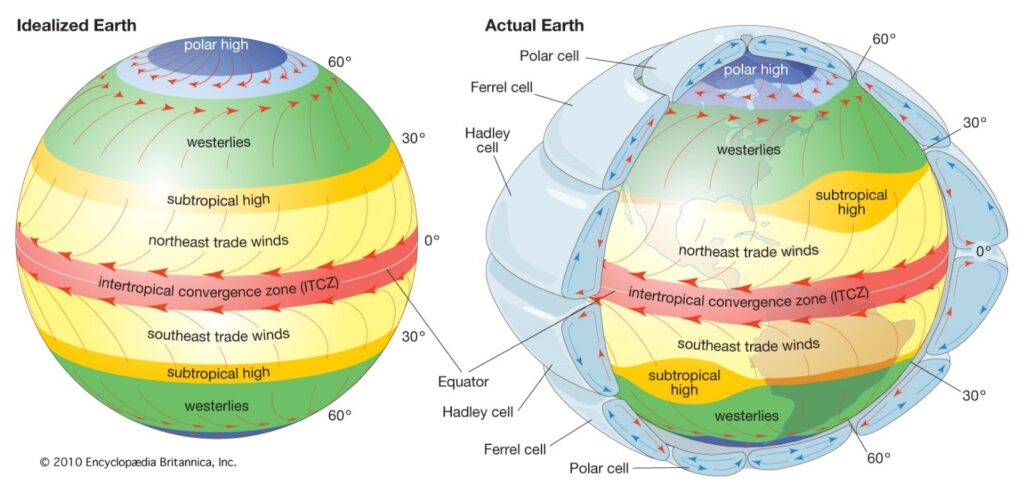
The global atmospheric circulation is described by the Met Office as ‘the world-wide system of winds by which the necessary transport of heat from tropical to polar latitudes is accomplished’. Figure 1 shows the different cells of this global system, in Idealized Earth and Actual Earth projections.

global atmospheric circulation

Figure 1 the different cells of the global atmospheric circulation © 2010 Encyclopædia Britannica Inc

Due to changes in our climate, there will be both small-scale and large-scale changes to the flow of water around the world in the twenty-first century.

  1. The central world map of Figure 8.21 in chapter 8 of the IPCC report shows the effect of 3°C of global warming on mean P-E (precipitation minus evaporation) compared to pre-industrial levels (1850-1900). Describe the anticipated changes to mean P-E across the globe with such projected change. Reference specific regions in your answer.
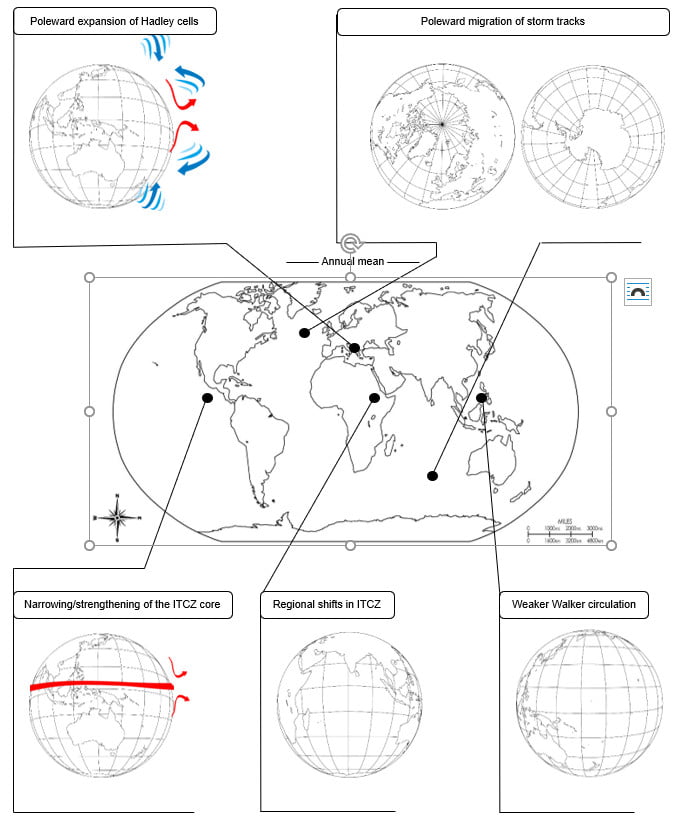
  1. Using Figure 2 in Appendix A, copy the choropleth colour coding to show the changes to global precipitation for:

a) +0.6 mm to 1 mm increase.

b) -0.6 mm to -1 mm decrease.

  1. Add the Tropical rain belt onto Figure 2, which is shown in red on the original figure.
  1. There are 5 anticipated changes to large-scale water circulation. They are the poleward expansion of the Hadley cells, the poleward migration of storm tracks, the narrowing and strengthening of the Intertropical Convergence (ITCZ) core, a regional shift in the ITCZ, and a weaker Walker circulation (for reference watch the MetLink video An Introduction to Atmospheric Circulation and read https://en.wikipedia.org/wiki/Walker_circulation). Add these notes to Figure 2.

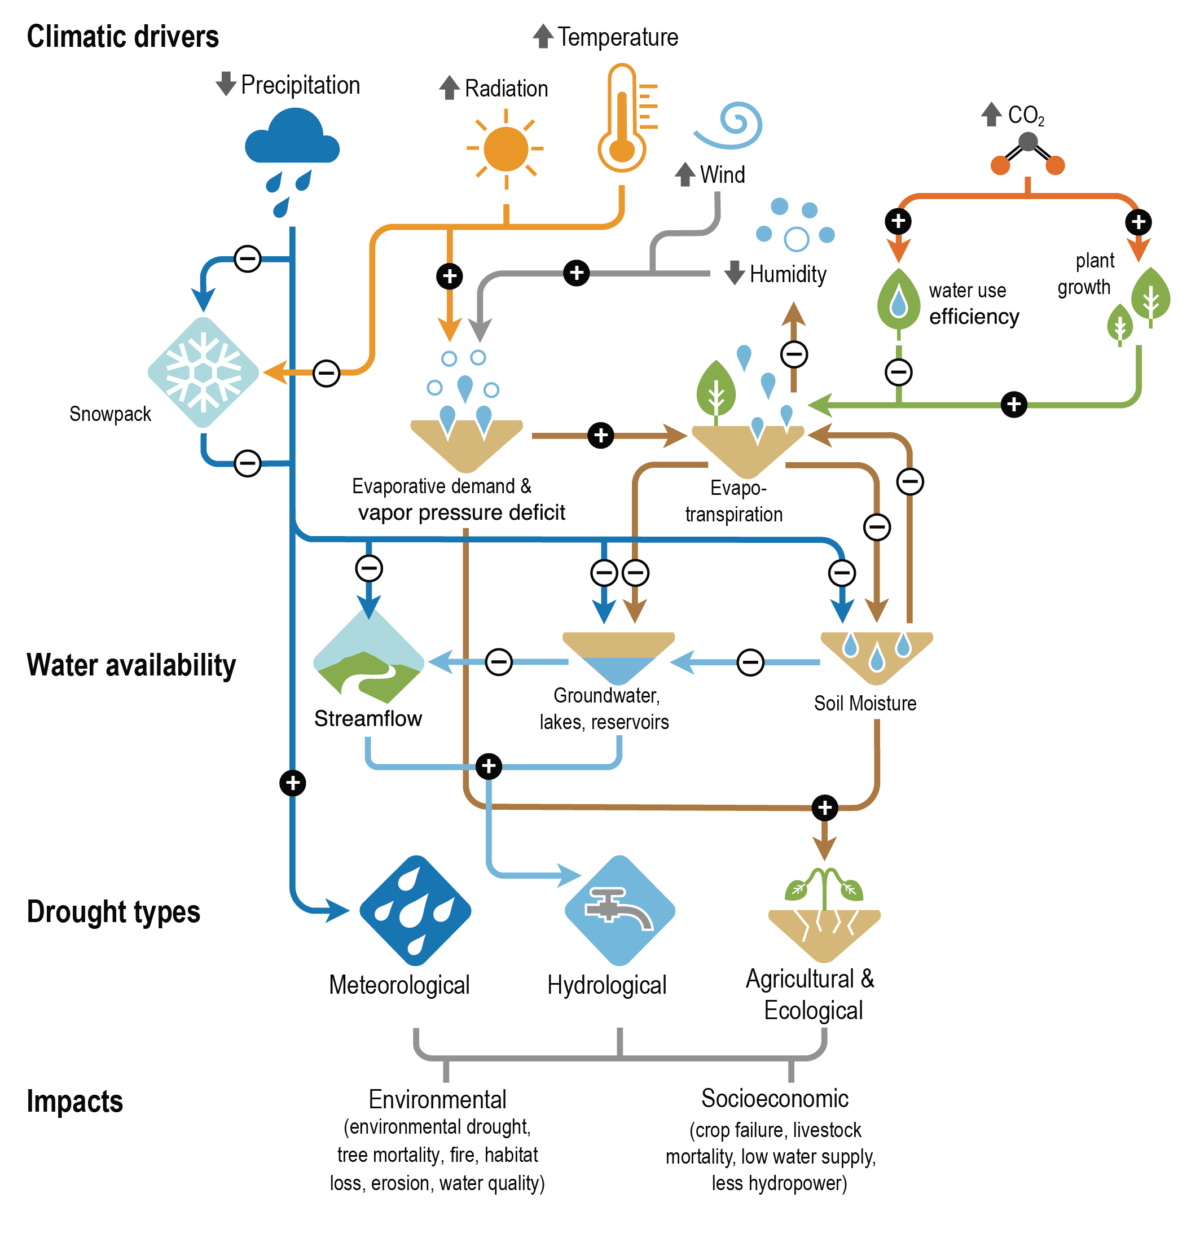
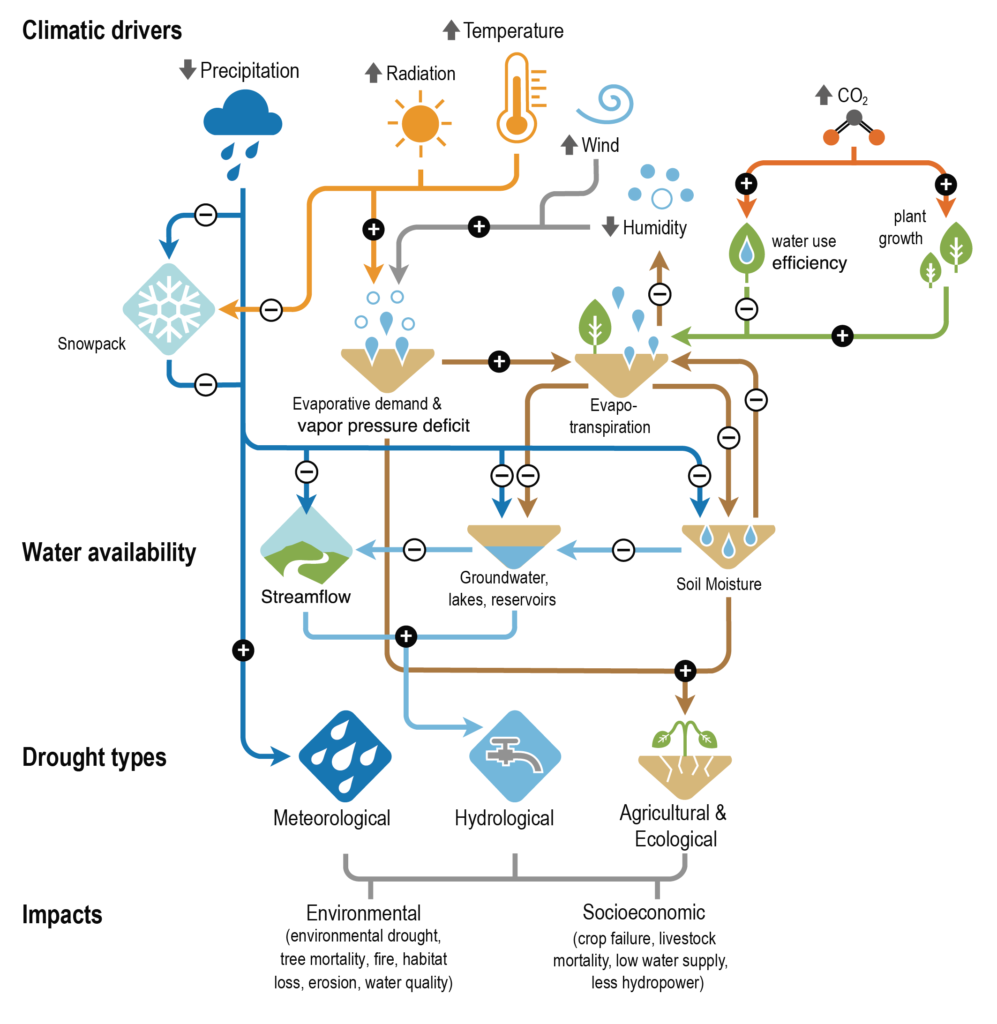
There are multiple atmospheric triggers for changes to the water cycle, termed climate drivers. Figure 3 in Appendix B shows how an increase in precipitation, solar radiation, temperature, wind, and carbon dioxide (CO₂) and a decrease in humidity can influence the water cycle. The diagram flows down to illustrate the outcome on water availability and drought.

Precipitation, one of the climatic drivers

Precipitation has increased steadily over Eurasia, most of North America, south-eastern South America, and north-western Australia. Whilst in Africa, eastern Australia, the Mediterranean region, the Middle East, and parts of East Asia, central South America, and the Canadian Pacific coast it has decreased. Records from 1910 onwards show Scandinavia, north-west Russia, the UK, and Iceland have all experienced increased precipitation trends. The amount of, frequency, and intensity of precipitation is forecast to continue to increase for these areas, which will worsen the severity of flooding. Across Europe there has been a reduction in snowfall, an important component in precipitation, in high latitude and mountain watersheds. Per decade, there has been a reduction of 0.52 million km² of annual mean potential snowfall over Northern Europe, with the greatest loss occurring in the Alps.

Runoff, streamflow, and flooding effect

There have been substantial changes to runoff, streamflow, and flooding around the world. Although there are no significant global trends many human-induced drivers of change have been identified and linked to changes in the flow of water. Examples include decreasing runoff in the dry season in the Peruvian Amazon, a decline in streamflow in the Colorado River, and earlier snowmelt in Northern Europe. As a result, in the UK, there will continue to be problems over increased water availability and streamflow during winter, and a worsening decrease in water availability and streamflow during the summer months. These changes are caused by the difference between winter flooding, which occurs from storm precipitation falling on already waterlogged ground, and summer flooding, when precipitation falls on ground that has been baked hard by the Sun. These scenarios have been compounded by dam construction and water withdrawal, land use and land cover change, all leading to alterations of seasonality, amount, and variability of river discharge, especially in human-dominated small catchments.

Climate change is increasing the risk of both flooding and drought in the UK with flooding now being the most common form of natural disaster. The risk of flooding is increasing due to the anthropogenic drivers of climate change. Quite simply this is because, as the atmosphere warms, there is more evaporation from the surface and more condensation of water vapour into cloud droplets in the atmosphere. Intense precipitation will remain the main cause of flooding. However, there are other factors (such as local topography and geology, for example). In 2017 research by the Met Office found that climate change means there is a high chance of exceeding the observed record monthly rainfall totals in many regions of the UK.  Further analysis in 2020 (again by the Met Office) shows that, on average, for the decade 2010 to 2019, UK summers were 13% wetter, and winters 12% wetter, than in the period 1961 to 1990. 7 of the 11 wettest years since records began (in 1862) in the UK have occurred since 1998. The five wettest winters have been from 1990 onwards. Overall, in the UK there is a trend towards wetter winters and drier summers.

Further work

Exam-style question 

Using all the work you have completed answer the final question below. 

Answer the question: assess whether global flooding will become more severe or more frequent as a result of climate change?  This means you must consider the different arguments, likelihoods, and levels of certainty, after weighing them up, to come to a conclusion. 

Appendix A

Large Scale Circulation projected changes and their effect on the water cycle

Figure 2 circulation projected change maps © freeusandworldmaps.com arrows © cliparts.co and getdrawing.com

Appendix B

IPCC AR6 climatic drivers

Figure 3 climate drivers © The IPCC report

Answers

  1. The intertropical convergence zone will predominately see an increase in precipitation with 0.8 to 1 mm/d increase across the Pacific Ocean (with some variability near the Central American coast). In the rest of the tropics, both north and south, there will be a reduction in P-E balance with less precipitation over all major oceans within the subtropical boundaries. This is described as a future ‘drying tendency’ on the edges of the ITCZ. In the upper latitude the Barents Sea will also become drier as the P-E balance changes in the Russian Arctic, between Novaya Zemlya and Svalbard. On land much of climate over the South American Amazon will also continue to dry. In contrast Alaska in North America and the Congo basin in Sub-Saharan Africa will see an increase in P-E.
  2. As instructed.
  3. As instructed.
  4. Under a climate change 3° warming scenario the Hadley cell will move northwards away from the current 0° to 30° latitude (N and S). This will lead to the expansion of the subtropical dry zones outwards and away from the tropics. Equally there will be a poleward migration of storm tracks which will lead to stronger storms as they will feed off extra latent heat. Abnormally high sea surface temperatures, in the Atlantic for example, will intensified storms throughout the twenty-first century with associated storm surges being exacerbated by rising sea levels. It is also believed extra water vapor in the atmosphere will make storms wetter. In the future, the ITCZ will narrow, particularly over the Pacific, causing lower latitude subtropical jets to become unstable baroclinically (in temperature and pressure). This will allow midlatitude eddies (circular movements of air) to spread further equatorward leading to more precipitation in the ITCZ core region. The Walker Circulation has undergone a strengthening in the Pacific, thought to be caused by either internal variability or a response to greenhouse gas emissions. The altered circulation pattern is associated with other global changes in the water cycle over regions like the Maritime Continent, South America and Africa.

Hydrological Cycle

Label the diagram using the words and phrases.

water cycle

Words: Bedrock, River Flow, Storage, Precipitation, Transportation, Condensation, Sea (storage), Transpiration, Infiltration, Percolation, Groundwater, Absorption, Run off, Evaporation

Web page reproduced with kind permission of the Met Office

Orographic (relief) rainfall and the Foehn Effect

This case study or ‘mystery’ is taken from the afternoon of the 2nd September 2013. It focusses on Scotland and N. England. It can be used for two different purposes – either to identify orographic/ relief rain (use images 2-6 below), or to go on to identify a case study of the Foehn Effect (use all images).

We recommend that teachers present students in groups with a series of images, sequentially, to allow them to work out what the weather is doing and why. 

Expected Knowledge

Students should be

  • Familiar with a map of the UK
  • Know which way winds blow around a pressure system, and be able to identify fronts and pressure systems on a synoptic weather map
  • Know about the 3 main ways in which rain can form (frontal, convective or relief/ orographic rain)

Suggested Lesson Opener

Make a cloud in a bottle or watch the video.

Notes for Teachers 

Students can be helped, where appropriate to identify some of these points

Image 1

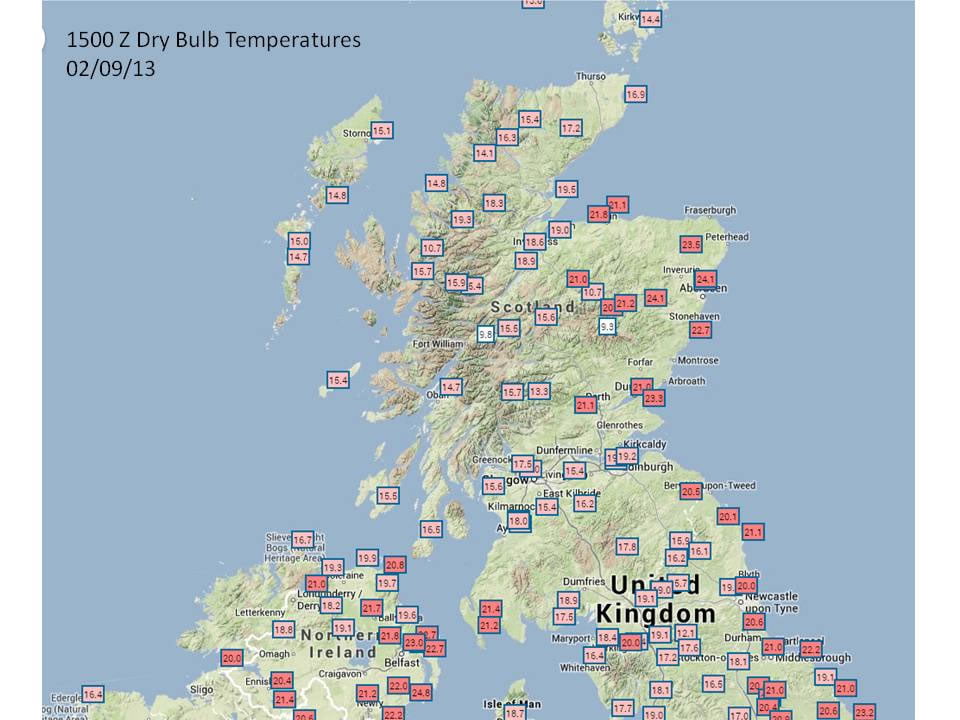
Image 1 – temperatures in degrees Centigrade at 15Z (1500GMT) (copyright Met Office)

The temperatures show that it is considerably warmer on the East side of Scotland than on the West. Temperatures are up to 9°C warmer on the East.

Why?

Image 2

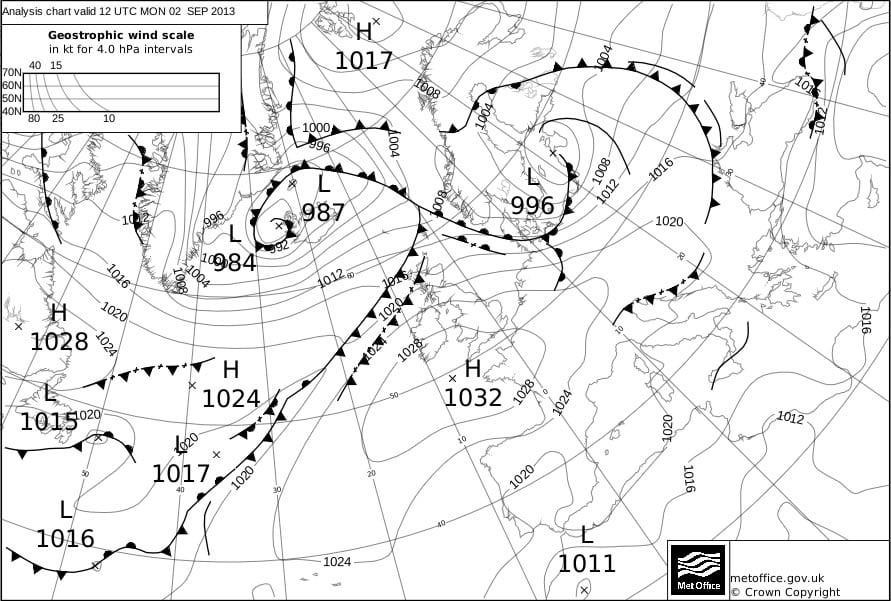
Image 2 – a synoptic chart at 12Z (1200GMT) (copyright Met Office)

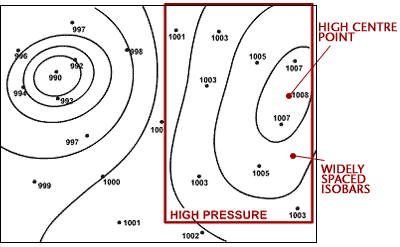
  • There are no weather fronts over the UK, although the whole country is in the warm sector of a low pressure system over Iceland.
  • There is a High Pressure system to the SW of the UK
  • Winds blow clockwise around a High pressure system, and along the isobars
  • The wind is therefore coming from the west (westerly winds) over Scotland
  • Alternatively, you could consider the winds blowing anticlockwise around the Low pressure system to the North – this also indicates that the wind direction over Scotland is from the west.
  • [We would normally associate this with Polar maritime/ returning Polar maritime air, but, in this case, if you follow the isoline back, the air has come from further south, so is Tropical maritime in nature.]
  • We would generally expect clear skies over most of the UK in this situation.

Image 3

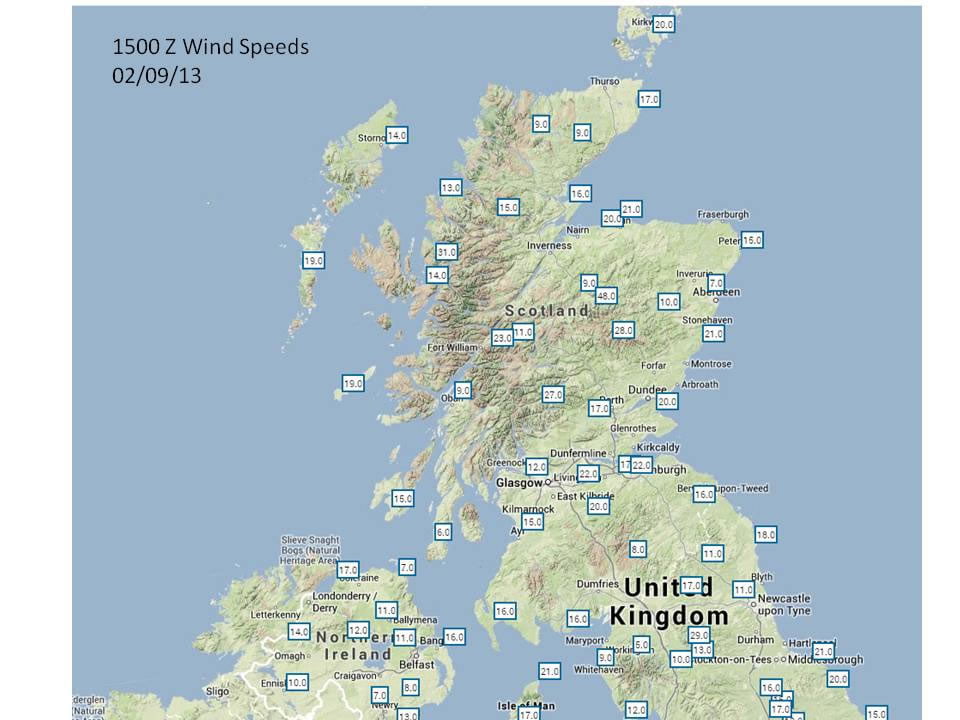
Image 3 – wind speed in knots at 15Z (1500GMT) (copyright Met Office)

Image 4

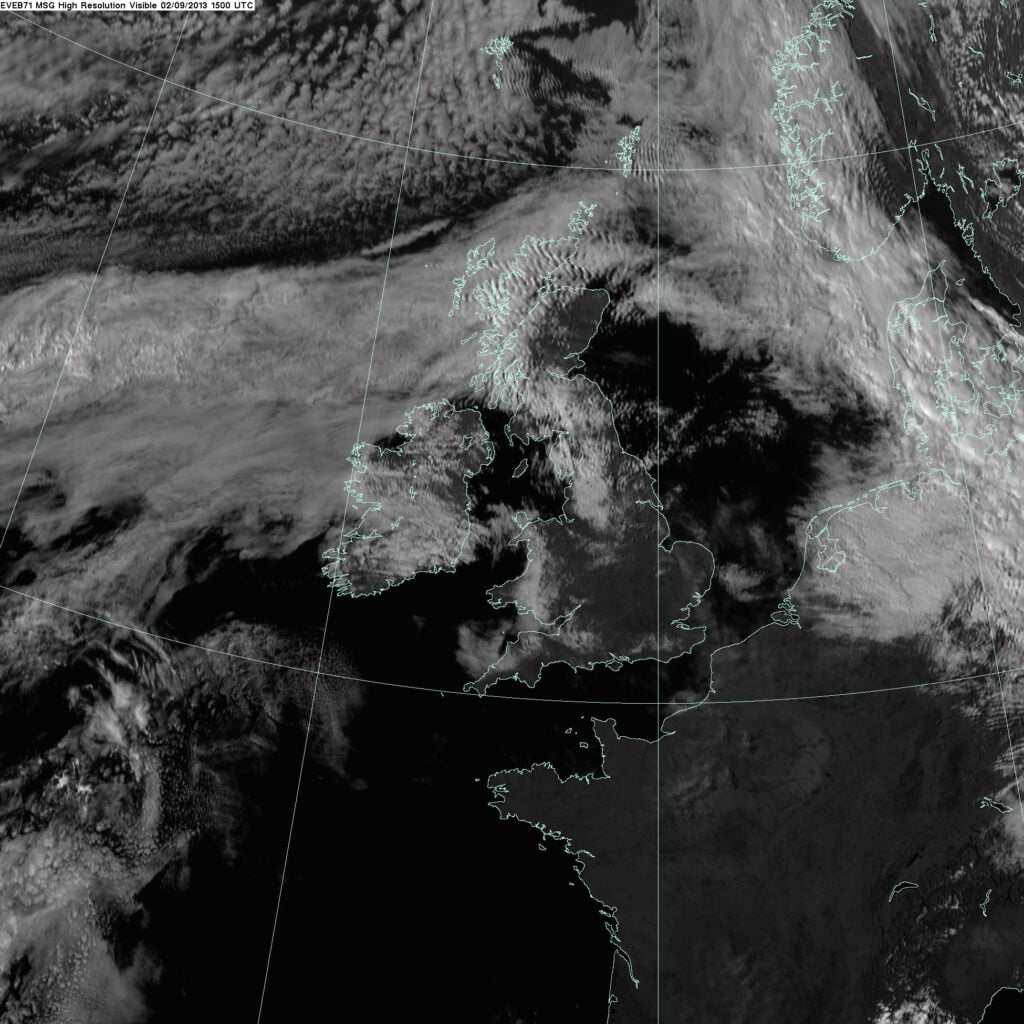
Image 4 – satellite image at 15Z (1500GMT) : (c) EUMETSAT / Met Office

This is a satellite image from 1500Z (1500GMT) showing visible radiation ie light. The white areas are where the Sun’s light is being reflected from clouds.

There is cloud over the west coast of Scotland and N. England

You can also see the cloud associated with the warm front to the East of the UK, and the cold front to the west.

  • There is no front over Scotland, so the rain is not frontal rain.

Image 5

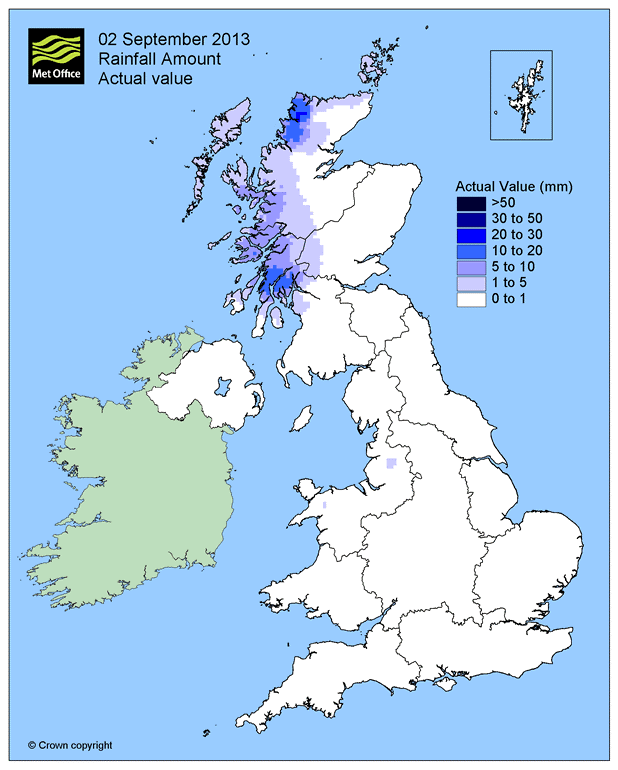
Image 5: Rainfall on 2nd September 2013 (copyright Met Office)

It is raining over the west coast of Scotland. Why?

  • There is no front there, so it is not frontal rain
  • Is it orographic rain or convective rain?

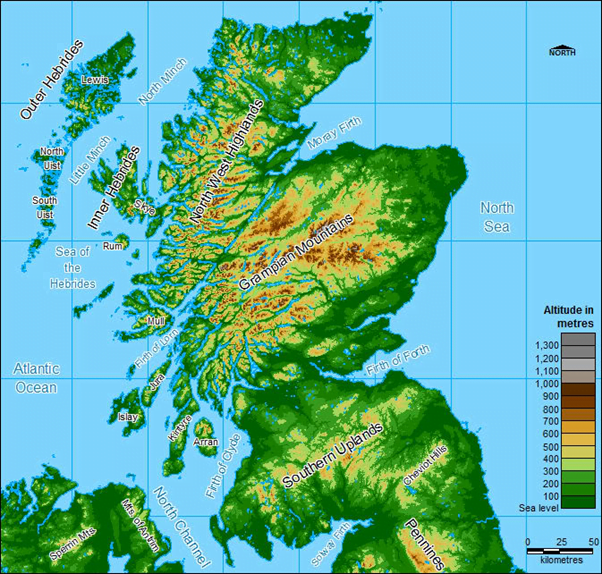
Image 6

A relief map of Scotland clearly shows the high ground on the East coast.

Synopsis

As the easterly winds blow in from the west, the air is forced to rise. As it rises, it cools until the rate of condensation is faster than the rate of evaporation. Cloud droplets form, which eventually become large enough to fall as rain.

Therefore, this rain is orographic or relief rain.

As the air descends again downwind of the mountains, the air warms and the cloud droplets evaporate.

As the cloud droplets form, they emit latent energy (heat) into the air around. This heat is remains in the air if the rain reaches the ground. This means that, downwind of the mountains when the air sinks, warms, and any remaining cloud droplets evaporate, there is more heat in the air than there was upwind of the mountains.

This is why temperatures were so much warmer on the east coast than on the west on this day!

Image 1

Image 2

Image 3

Image 4

Image 5

Orographic Rainfall in Scotland

Image 6

Scottish Orography

A Level

Independent Investigation

A guide to collecting weather data from the RGS student guide to the A Level independent investigation (Non-examined Assessment – NEA) and some further ideas.

Video Link: https://www.youtube.com/embed/Y_UdPbThbtQ

Carbon and Water Cycles; Weather and Climate

Carbon, water, weather and climate a PowerPoint presentation focussing on recent changes to the carbon and water cycles, and how the two cycles interact.

Climate and Weather – an overview for A level, on the RGS website.

Climate change updates for A level geography – supporting the 2016 specifications.

Background information for teachers on the water cycle and the carbon cycle.

Video link: https://www.youtube.com/embed/LBe4LTLOLvU

Deforestation, the water cycle and the carbon cycle in the Amazon.

Extensive information from the Cool Geography site: Case study of a tropical rainforest setting to illustrate and analyse key themes in water and carbon cycles and their relationship to environmental change and human activity and more generally on the carbon and water cycles.

Depressions, Anticyclones and Synoptic Charts

Weather Charts

Weather Systems

Mid-latitude weather systems video (with downloadable resources)

Depression based exercise where students draw contours of temperature, pressure and precipitation to work out what the system looks like: Student worksheets and notes for teachers. Simpler versions of the same exercise can be found on the KS3/4 web pages.

Use WOW data to track a cold front across the UK and work out its speed.

track a cold front across the UK and work out its speed practical excercises.

weather forecasting exercise

Shipping Forecast weather system excercise teachers notes and worksheet.

There are some more teaching resources covering weather systems and weather maps on the GCSE resources page.
Tropical Weather

Monsoons – a resource looking at the link between rainfall and food production in India. Teachers notes and Excel data sheet.

Some useful links about Super typhoon Haiyan/ Yolanda

Extreme Weather

Extreme Weather

Extreme weather in the UK

Climate and Climate Change

Climate Change with sections on atmospheric structure, composition, solar radiation, climate feedback mechanisms and ozone depletion.

Other Weather

Clouds

A case study of orographic rainfall and Foehn winds in Scotland with images for students Image 1Image 2Image 3Image 4Image 5.

An exercise using height/ temperature graphs to investigate atmospheric stability, lapse rates and cloud formation with a worksheet for students and an introductory Powerpoint.

Investigate How big is a raindrop collect data and analyse mode, mean and median, range, interquartile range and standard deviation etc.

This lovely animation explores integration through Is it better to walk or run in the rain?.

A one hour tutorial on Climate variability, change and water resources from MetEd (requires free registration). The level is suitable for A level.
GCSE resources

9. Water in the Atmosphere

Weather and Climate: a Teachers’ Guide

Pathway: Basic weather 

Climate ZonesAir MassesPressure and Wind – Water in the Atmosphere

Lesson overview: In this lesson, we focus on cloud formation due to convection, orography (relief) and frontal uplift.

The atmosphere is one of the smallest reservoirs of water in the hydrosphere.  Clouds form when air is cooled. Air can cool due to convection, when air is heated from below and rises, or when air is forced to rise at a front between two air masses. When air is forced to rise over hills and mountains, cloud formation is enhanced. Climate change will intensify the water cycle, increasing the amount of water vapour in the atmosphere.  As water vapour is a greenhouse gas this creates a positive feedback loop, amplifying climate change.

Learning objectives:

  • To understand why clouds form in the atmosphere.

  • To be able to explain two ways in which clouds form

Key Teaching Resources

Water in the Atmosphere PowerPoint
Water in the Atmosphere PowerPoint (easier)
Water in the Atmosphere Worksheet
Water in the Atmosphere Worksheet (easier)
Back-to-back image

Teacher CPD/ Extended Reading

Water in the Atmosphere – More for Teachers

Alternative or Extension Resources

Global Atmospheric Circulation and Global Precipitation Patterns 

A ‘mystery’ – a case study of orographic rainfall in Scotland (with optional extension looking at the Foehn Effect)


Weather and Climate: a Teachers’ Guide

Weather Charts Teachers’ Notes

Understanding weather charts

Teachers’ notes to accompany Understanding Weather Charts

Resources required

Computers with Internet access would be desirable. Alternatively if Internet access is not available, printed copies of student sheets and worksheets should be made.

Prior knowledge required

A basic background of weather and climate.

Teaching activities

Students can visit the following pages to gain a basic background into the topics covered:

The information on the student sheets can be delivered by the teacher and activities completed individually. Alternatively students can work through the whole lesson themselves.

Part A – Isobars, pressure and wind

Part B – Identifying pressure systems and fronts

Part C – Plotted weather charts

Exercises

Three worksheets with exercises are provided to consolidate learning.

A series of additional exercises are provided for more able students, or those who have already studied pressure systems and fronts in more detail prior to this lesson.

Suggestions for homework

Any of the worksheet activities can be completed. Alternatively students can collect weather charts from the Internet or a newspaper and repeat the exercises using these.

Web page reproduced with the kind permission of the Met Office

Rainforest Deforestation the Carbon and Water Cycles

This news item from NASA relates to this animation, as does this Nature Communication from October 2020.

Suggested learning activities:

Data and GIS exercise for A Level students

Explore leaf area, evapotranspiration and temperature data using various statistical techniques to explore the relationship between deforestation and weather on this resource on the RGS website.

Activity 1:
Ask students to write a voiceover for the film, demonstrating their understanding of the concepts involved.

Activity 2:
Complete this sentence based on the film:
When rainforests are deforested, places downwind are left with more/ less/ the same amount of rainfall and greater/ less/ the same amount of flood risk.

Activity 3:
Look at www.globalforestwatch.org/map and identify a Tropical region which has experienced deforestation in the last decade.
Look at earth.nullschool.net. What is the prevailing wind direction in that region?
Using www.google.com/maps, write a paragraph explaining how you think the water cycle has been affected by deforestation for a place downwind from the rainforest region you identified.

Activity 4:
Having watched the animation, use https://www.globalforestwatch.org/map , http://earth.nullschool.net and https://www.google.com/maps to write a paragraph explaining how you think the water cycle has been affected by deforestation for a specific place downwind and/ or downriver from a rainforest region.

Activity 5:
Having watched the animation, read these articles from Nature and NASA (noting that this predates the Nature article), NASA (2019)Geography Review (p22 – 25) and Carbon Brief.
Summarise the impact of tropical deforestation on the carbon and water cycles.

More information about the water cycle and climate change and the water cycle and an excellent summary from Cool Geography.

In Depth – The Water Cycle

The water cycle

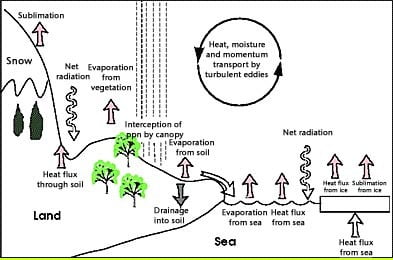
The water cycle, also known as the hydrological cycle, is the process by which water travels from the Earth’s surface to the atmosphere and then back to the ground again. The sun provides the energy for a continuous exchange of moisture between the oceans, the land and the atmosphere.

The Earth’s water

Nearly all (about 97%) of the Earth’s water is contained in the oceans. A smaller amount is locked away as ice sheets and glaciers. This leaves a very small amount which travels around in our water cycle, although it may not always seem this way on wet days.

Water enters the atmosphere as water vapour through evaporation, transpiration and sublimation. Water vapour high in the atmosphere forms into clouds through condensation. Water eventually returns to earth through precipitation as rain, snow, sleet and hail. When precipitation occurs over land, some water seeps into the ground as groundwater, a small amount is taken up by plants and animals, and the rest will return to rivers and streams as surface run-off to begin its journey back to the oceans.

Underwater scene

The processes:

Surface runoff
Surface runoff is the precipitation that falls on land and flows downhill towards stream channels which join rivers and eventually reach the oceans. Only about one third of precipitation falling on land will return to rivers and oceans. The rest will be soaked into the soil as groundwater, evaporated or transpired.

Groundwater
Some of the water from precipitation will soak into the soil and rocks as groundwater. A varying proportion of groundwater stays in the shallow soil layer, and will move slowly towards streams and rivers. When groundwater soaks deeper into the soil it refills the underground aquifers, where it can stay for long periods of time or be used by humans through drilling wells into aquifers.

Aquifer
An aquifer is a layer of water soaked sand, soil, stone, silt or clay underground. Aquifers act as huge underground water storage systems which people all over the world rely on for fresh water.

Reversible change of state
A change that can be undone or reversed. Energy is required for a material to change state and whilst it may change in appearance, it will still remain the same material. Melting, freezing, boiling, evaporating and condensing are always reversible changes and can be reversed by heating or cooling.

Deforestation, the water cycle and the carbon cycle in the Amazon.

Web page reproduced with the kind permission of the Met Office