
Questions to consider:
Explain two reasons why a warming climate results in a more intense water cycle.
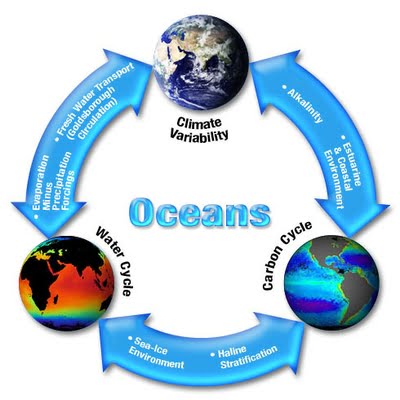
How do changes in the water cycle impact i) the surface water of oceans in the subtropics ii) the surface water of oceans in tropical and polar regions.
Describe the potential global change in annual mean precipitation for the period 2081 -2100.
Identify three key differences between the carbon cycle and the water cycle.
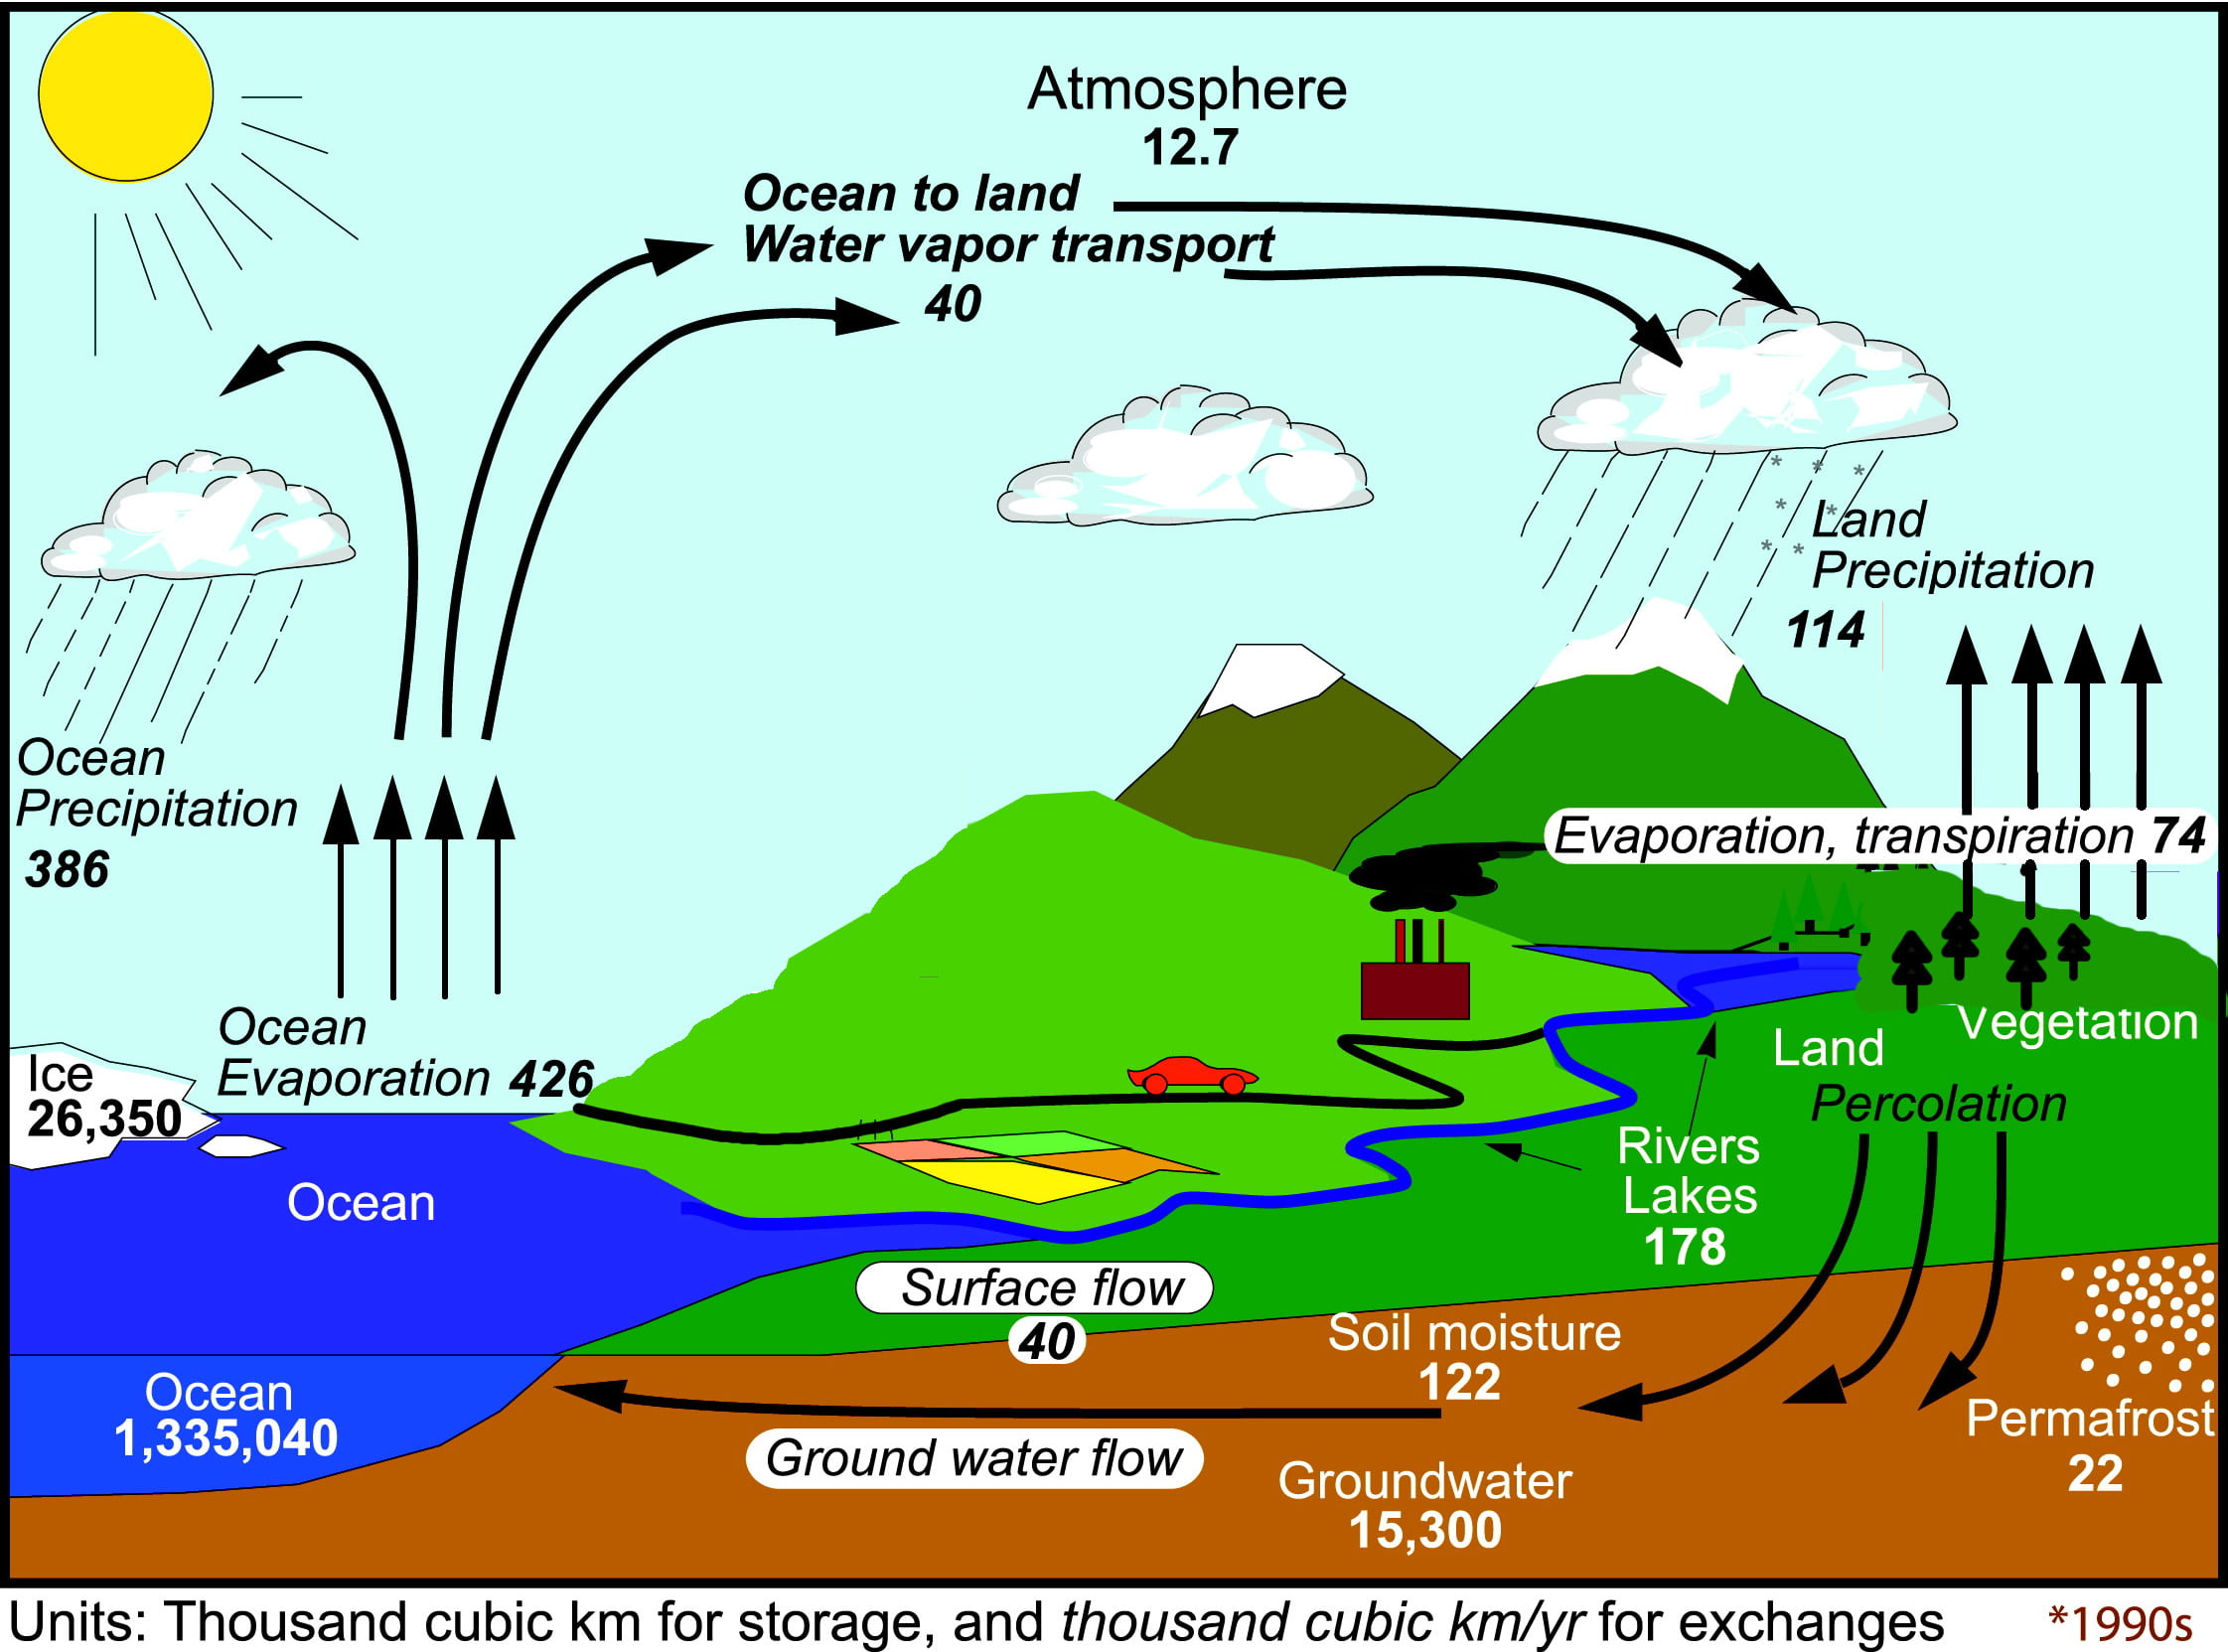 Estimates of the current global water budget and its annual flow using observations from 2002-2008 (1000 km3 for storage and 1000 km3 yr−1 for exchanges).
Based on K.E. Trenberth, J. Fasullo, and J Mackaro, 2011: Atmospheric Moisture Transports from Ocean to Land and Global Energy Flows in Reanalyses. J. Climate, 24, 4907–4924. doi: http://dx.doi.org/10.1175/2011JCLI4171.1
Summary:
- About 10% of the water evaporated from the ocean is transported over land by the winds and finds its way back to the ocean following condensation into clouds, eventual precipitation as rain or snow and subsequent surface runoff and sub-surface flows
- As the climate warms, the water cycle intensifies. This is driven by an increase in evapotranspiration at the ground but is controlled by the temperature of the troposphere, which determines how much condensation, and hence precipitation, occurs.
- Over the last century, northern mid-latitude precipitation has increased and the number of heavy precipitation events over land has increased in more regions than it has decreased, particularly in Europe and North America.
- Globally, water vapour concentration in the lower atmosphere has increased by 3-4% since the 1970s.
- Water vapour is a strong and fast feedback that amplifies changes in surface temperature in response to other changes (for example increasing CO2) by about a factor of 2.
- Many human and natural systems are highly sensitive to changes in precipitation, river flow, soil and groundwater.
Case Studies
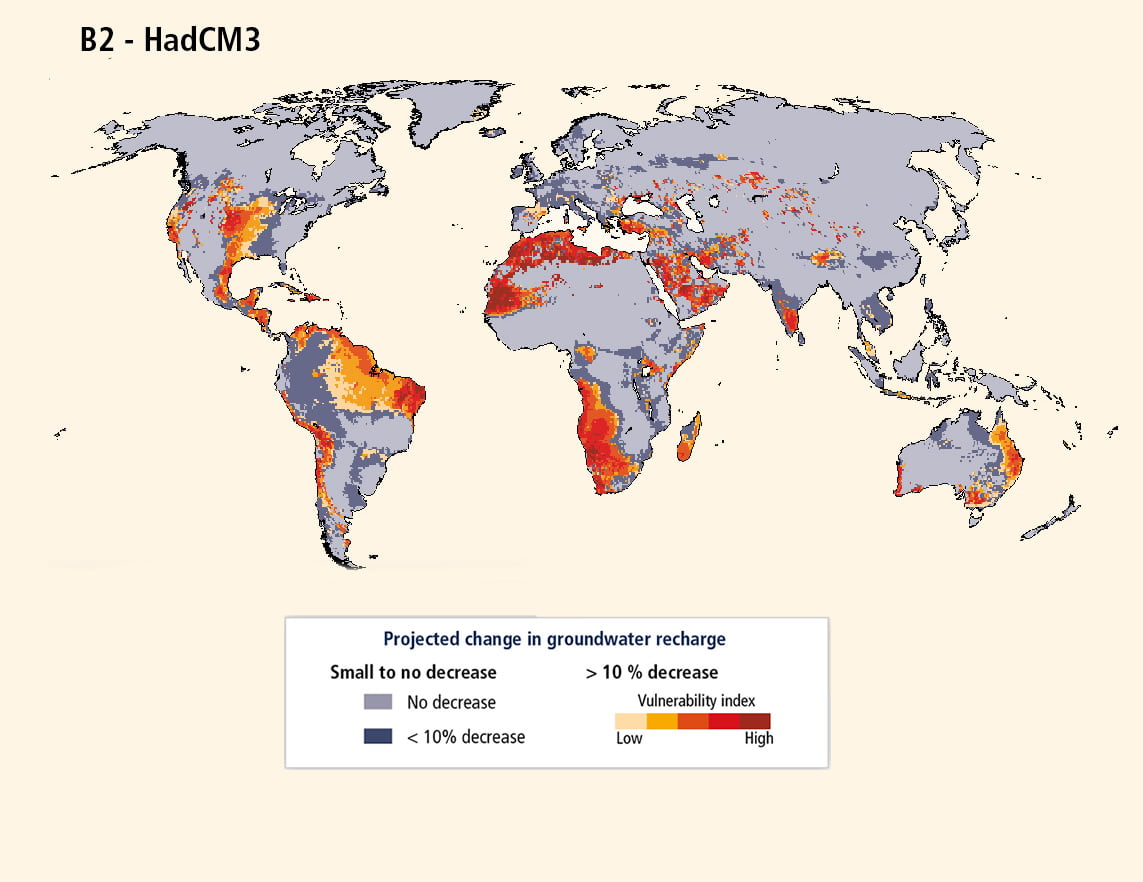
Changes to Groundwater in Uganda
The mass budgets of Himalayan Glaciers
Return to main menu
Further Information
Carbon, water, weather and climate a PowerPoint presentation focussing on recent changes to the carbon and water cycles, and how the two cycles interact.
Background information on the water cycle.
Is There Evidence for Changes in the Earth’s Water Cycle?
How Important Is Water Vapour to Climate Change?
How Will the Earth’s Water Cycle Change?
How will climate change affect the frequency and severity of floods and droughts?
How will the availability of water resources be affected by climate change?
How is climate change affecting monsoons?
In general, precipitation is limited by the availability of water, energy, or both. The world’s oceans contain an effectively unlimited supply of water but locally, especially over land, a shortage of water can limit precipitation. As the climate warms, and there is more energy available to drive evaporation, the amount and intensity of precipitation is expected to increase. Evapotranspiration also increases over most land areas in a warmer climate, thereby accelerating the water cycle. However, changes in vegetation and soil moisture availability can also affect evapotranspiration rates.
The differences between the carbon and water cycles:
- Human emissions of water have no effect on the concentration of water in the atmosphere; the concentration of water in the atmosphere is largely controlled by temperature. However, human emissions of carbon have increased the concentration of carbon in the atmosphere by over 40%.
- The effective lifetime of water in the atmosphere is of order 10 days, whereas that of CO2 ranges between a few years to thousands of years.
- The concentration of water in the atmosphere is extremely variable spatially, ranging from close to zero at high altitudes to about 20g per kg of dry air near the tropical ocean surface, whereas, because of its long effective lifetime, that of carbon dioxide has a range of around only 2% both seasonally and geographically.
- The cryosphere (ice on land and sea) is an important part of the water cycle, but not of the carbon cycle. Humans have indirectly, through temperature change, caused impacts on the cryosphere.
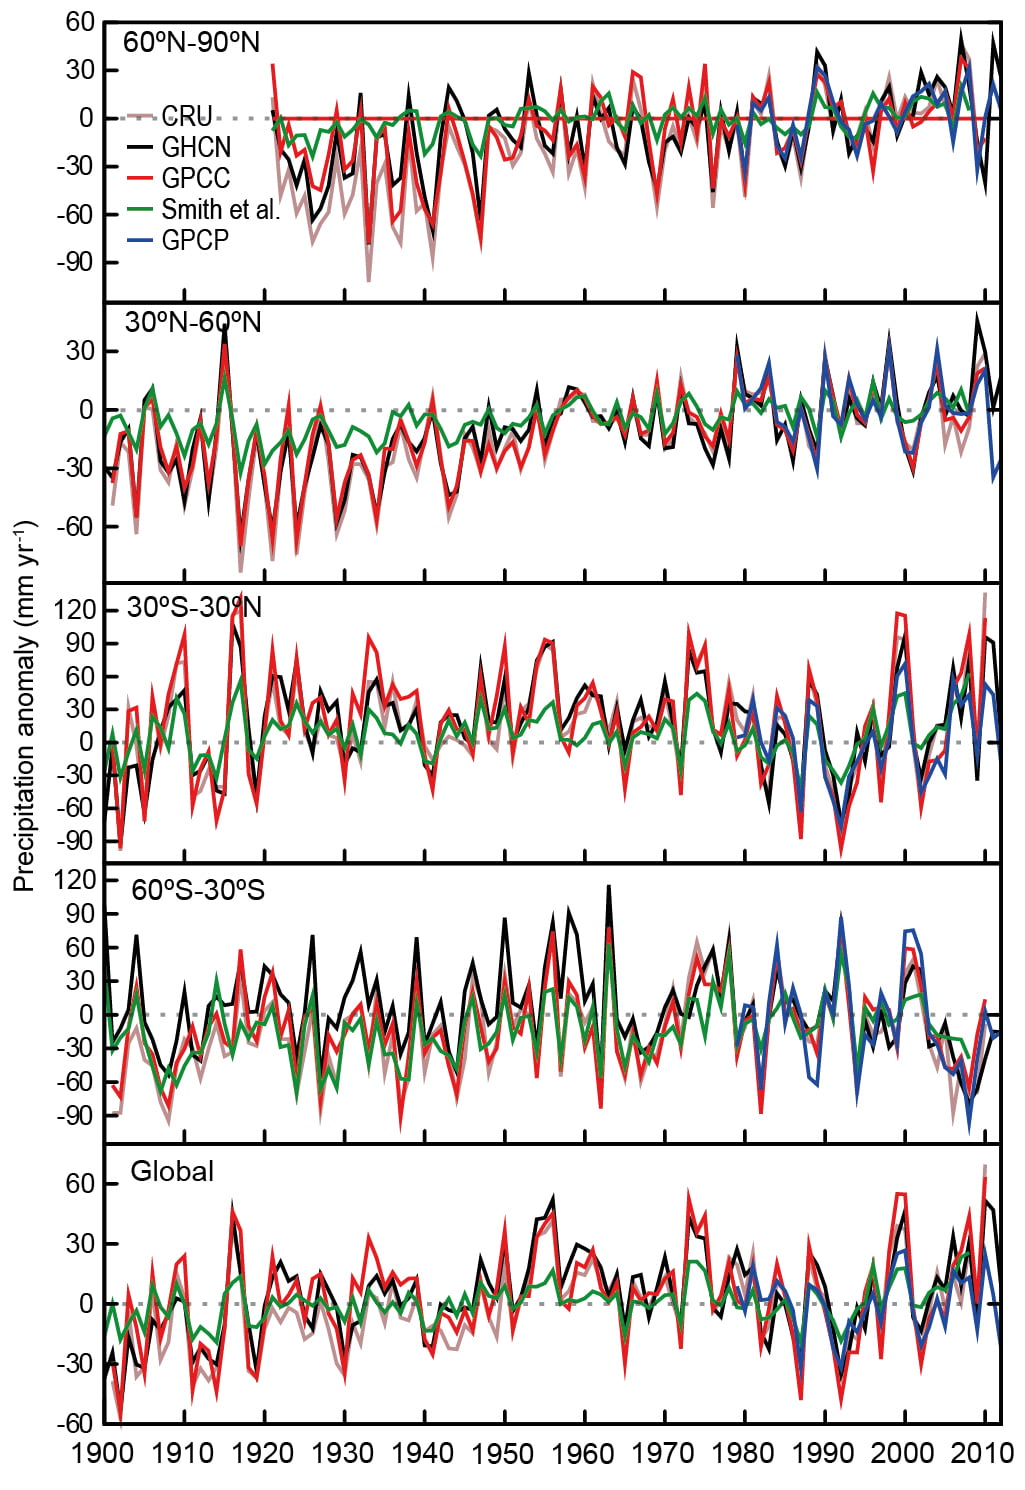
Annual precipitation anomalies averaged over land areas for four latitudinal bands and the globe relative to 1981-2000. Globally, there has been no significant long term trend in precipitation. In the Tropics, (30°S-30°N) precipitation has increased over the last decade, reversing the drying trend from the mid 70s to the mid 90s. The Northern Hemisphere mid-latitudes show a significant increase in precipitation over the last century.
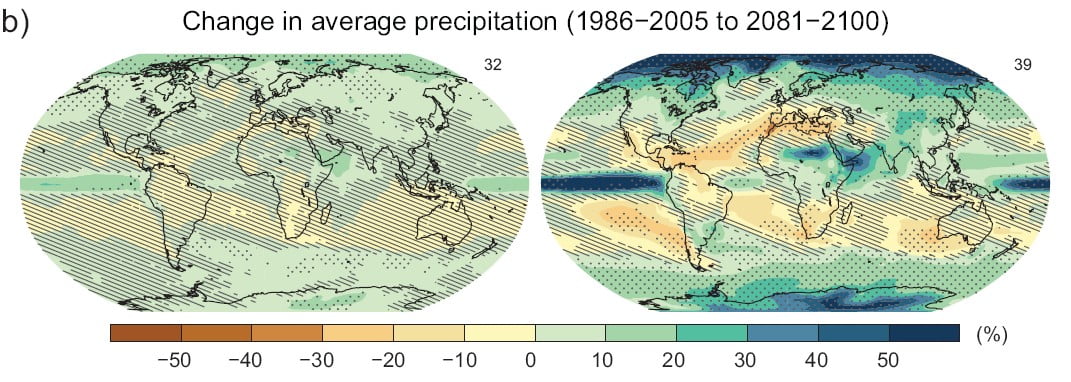
Maps of modelled annual mean precipitation changes between 1986-2005 and 2081-2100 for a low (RCP2.6) and high (RCP8.5) emissions scenarios. Hatching indicates regions where there is low confidence in the projected change. Stippling indicates regions where there is more confidence in the projected precipitation change.
Global and annual averages of total atmospheric water vapour over ocean surfaces, shown relative to the average for the period 1988-2007.
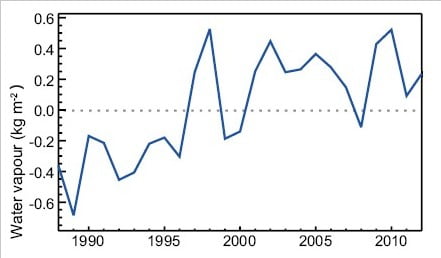
Evidence of climate change is also seen in other variables. Since the last IPCC report, satellite evidence has shown an increase in the amount of water vapour in the troposphere, the lowest part of the atmosphere. The year-to-year variability and long term trend in atmospheric water vapour content are closely linked to changes in global sea surface temperature, partly because warmer temperatures cause increased evaporation and partly because warmer air can carry more water vapour. Tropospheric water vapour is an important climate change feedback mechanism (through its powerful greenhouse effect) and is essential to the formation of clouds and precipitation. No significant change to the amount or type of clouds globally has been detected yet, although locally changes have been observed and linked to changing wind patterns.
Changes in the water cycle also have an impact on the world’s oceans, with surface waters in the evaporation dominated sub-tropics becoming more saline and surface waters in the rainfall-dominated tropical and polar regions becoming fresher.
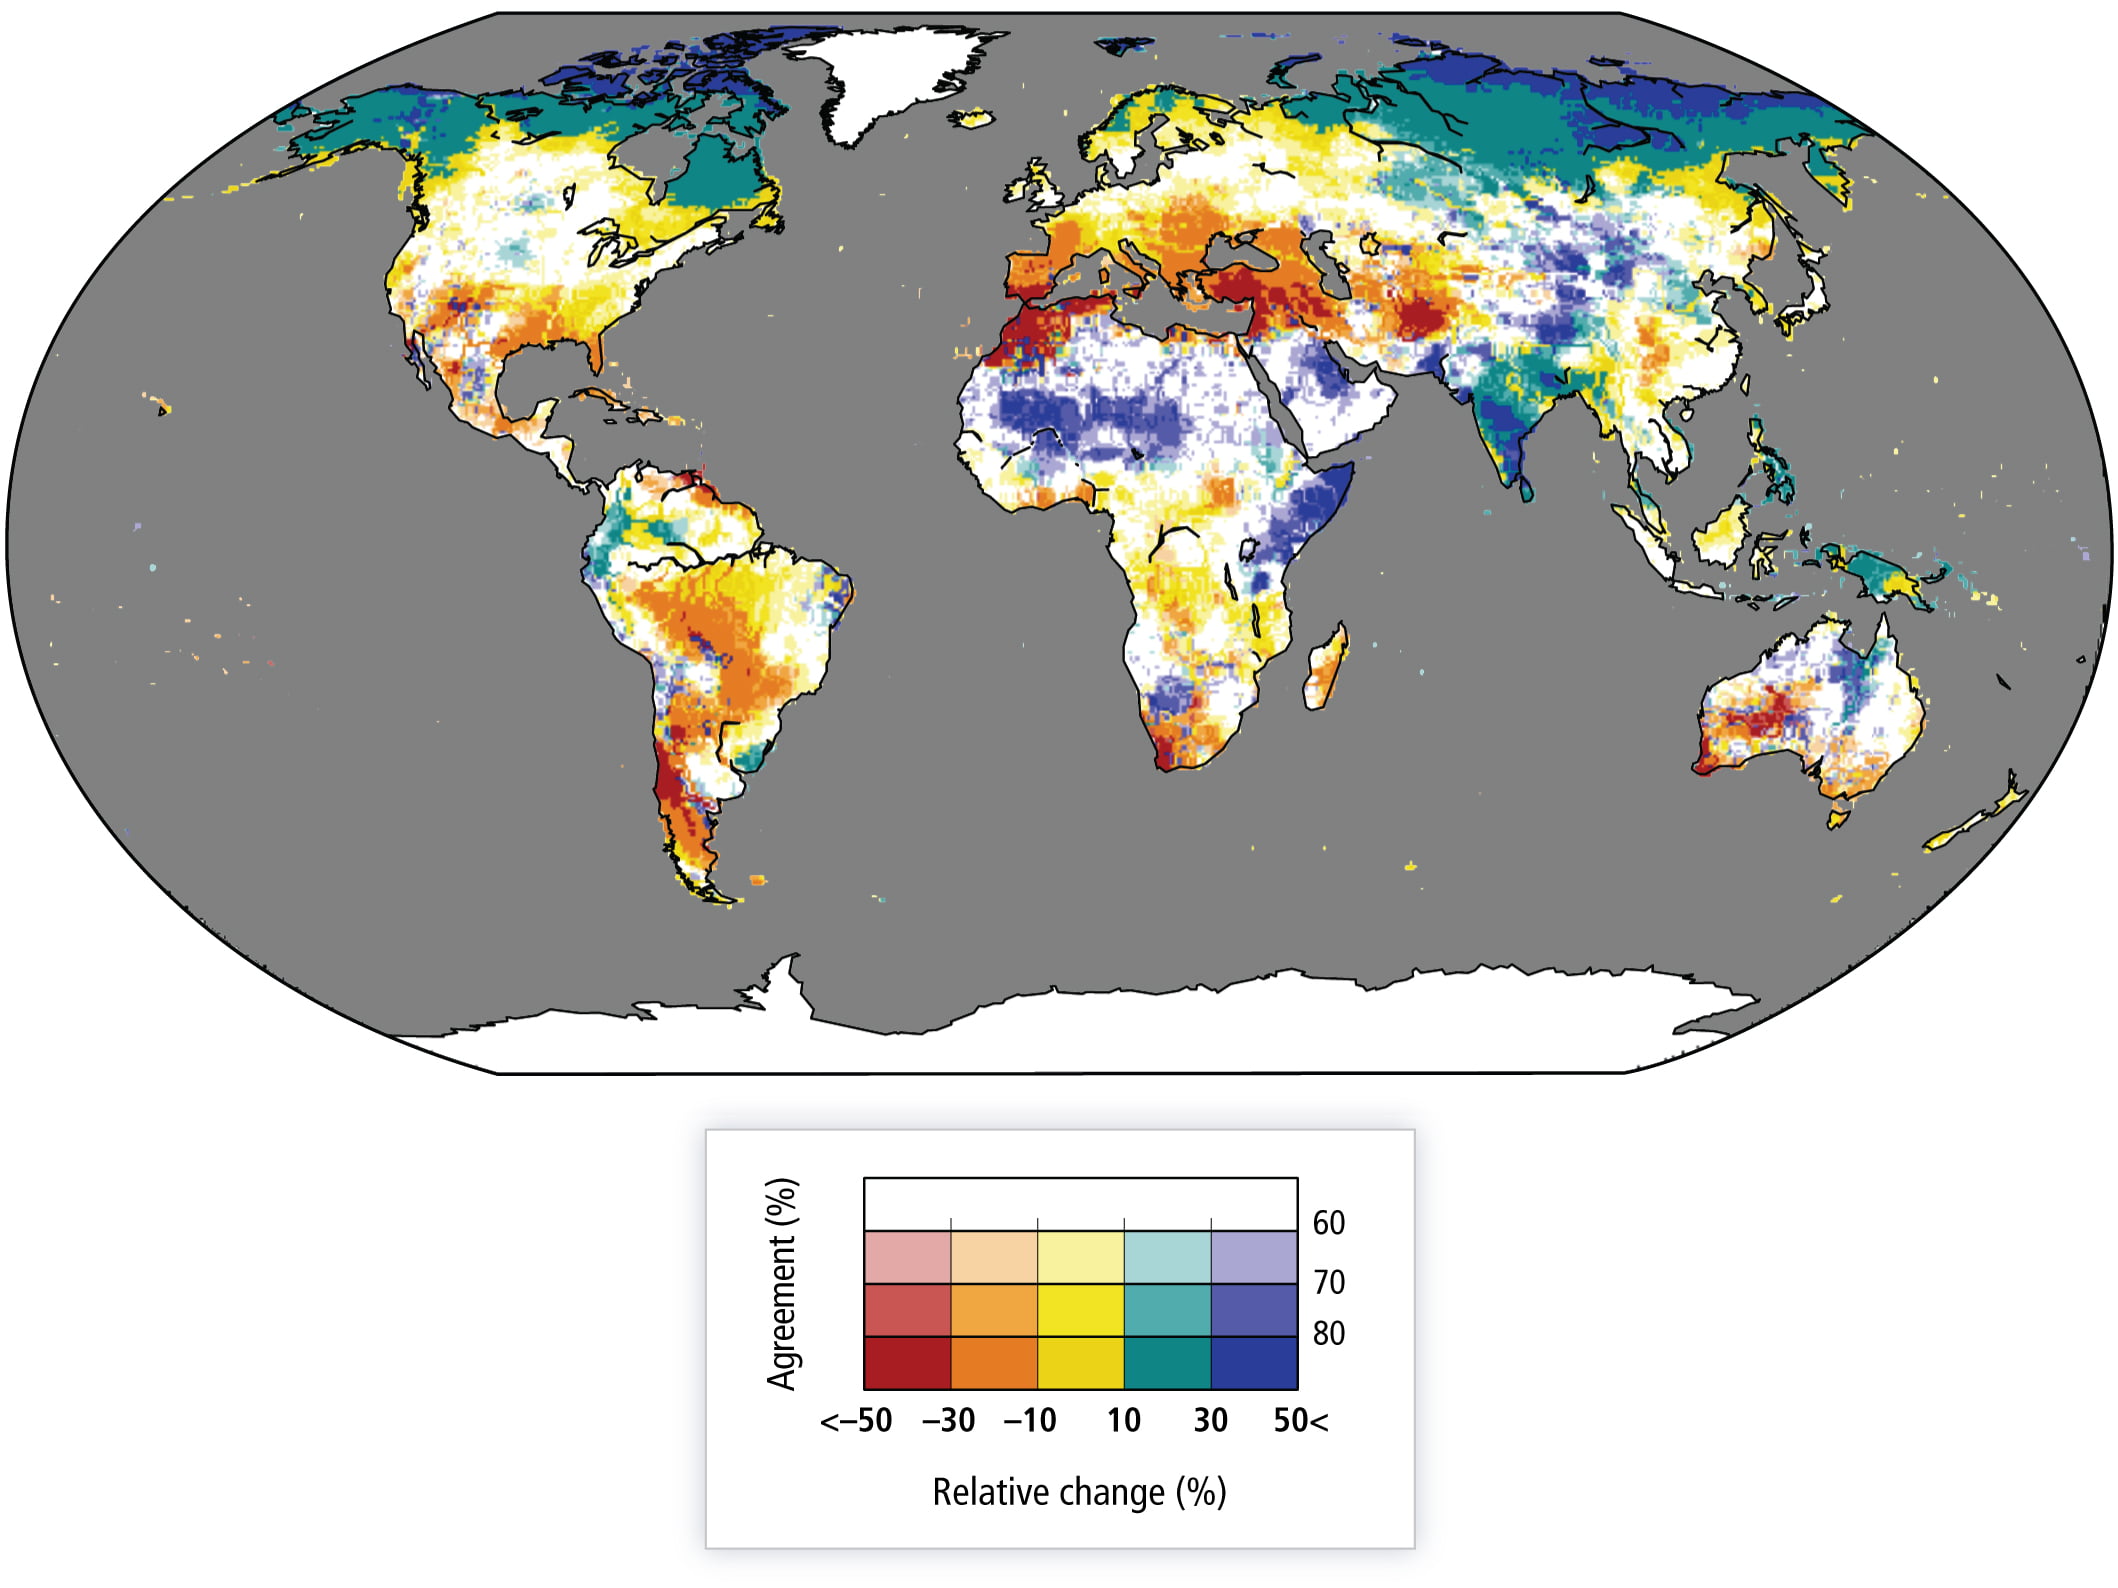
Percentage change of mean annual streamflow for a global mean temperature rise of 2°C above 1980–2010 (2.7°C above pre-industrial). Colour hues show the amount of change and saturation shows the agreement on the sign of change (i.e. the darker the colour, the more confidence in the result).
Extreme Precipitation and Flooding
Since 1951 there have been statistically significant increases in the number of heavy precipitation events in more regions than there have been decreases, but there are many regional and seasonal variations in the trend. The most consistent trend is seen in North America, where there has been an increase in the frequency and intensity of extreme precipitation. In the future, the number of tropical cyclones globally may fall but their maximum wind speed and precipitation is expected to increase, in a warmer and more energetic atmosphere. Freshwater-related risks (e.g. river flooding) of climate change increase significantly with increasing greenhouse gas concentrations.
Drought Increased evapotranspiration over land can lead to more intense and frequent periods of agricultural drought. There has been an increase in the frequency and intensity of drought in the Mediterranean and West Africa, but a decrease in central North America and north-west Australia.
ENSO
We cannot yet predict how the El Niño Southern Oscillation (ENSO), which has a significant impact on precipitation patterns around the world in both its El Niño and La Niño phases, may change in the 21st century.
The Cryosphere Frozen stores of water form an important component of the water cycle and are depended upon by societies and ecosystems. The Arctic and Antarctic sea-ice covers are projected to shrink in the 21st century. The Arctic may become almost entirely ice-free in late summer. Polar amplification occurs if the magnitude of the surface temperature change at high latitudes exceeds the globally averaged temperature change on time scales greater than the annual cycle. One of the ways this can happen is in response to rising CO2 levels in the atmosphere. As the air temperature warms, sea ice retreats and snow cover reduced, the surface albedo decreases, air temperatures increase and the ocean can absorb more heat – a positive feedback mechanism which result in a local amplification of the warming.
This polar amplification can have consequences for the melting of ice sheets, global sea level and on the carbon cycle through the melting of the permafrost.
Ice sheets also play an essential role in the Earth’s climate. They interact with the atmosphere, the ocean–sea ice system, the lithosphere and the surrounding vegetation, respond to greenhouse gas changes and affect global climate on a variety of time scales. Ice sheets grow when annual snow accumulation exceeds melting. Growing ice sheets expand on previously darker vegetated areas, thus leading to an increase of surface albedo, further cooling and a local drying of the air as the ice sheets grow upwards into colder air. Massive freshwater release from retreating ice sheets, can feed back to the climate system by altering sea level, oceanic deep convection, ocean circulation, heat transport, sea ice and the global atmospheric circulation. Whereas the initial response of ice sheets to external forcings (such as greenhouse gas changes) can be quite fast, involving for instance ice shelf processes and outlet glaciers (10 to 1000 years), their long-term adjustment can take much longer.
Is There Evidence for Changes in the Earth’s Water Cycle?
WG1 FAQ3.2
The Earth’s water cycle involves evaporation and precipitation of moisture at the Earth’s surface. Changes in the atmosphere’s water vapour content provide strong evidence that the water cycle is already responding to a warming climate. Further evidence comes from changes in the distribution of ocean salinity, which, due to a lack of long-term observations of rain and evaporation over the global oceans, has become an important proxy rain gauge.
The water cycle is expected to intensify in a warmer climate, because warmer air can be moister: the atmosphere can hold about 7% more water vapour for each degree Celsius of warming. Observations since the 1970s show increases in surface and lower atmospheric water vapour (Figure 1a), at a rate consistent with observed warming. Moreover, evaporation and precipitation are projected to intensify in a warmer climate.
Recorded changes in ocean salinity in the last 50 years support that projection. Seawater contains both salt and fresh water, and its salinity is a function of the weight of dissolved salts it contains. Because the total amount of salt—which comes from the weathering of rocks—does not change over human time scales, seawater’s salinity can only be altered—over days or centuries—by the addition or removal of fresh water.
The atmosphere connects the ocean’s regions of net fresh water loss to those of fresh water gain by moving evaporated water vapour from one place to another. The distribution of salinity at the ocean surface largely reflects the spatial pattern of evaporation minus precipitation, runoff from land, and sea ice processes. There is some shifting of the patterns relative to each other, because of the ocean’s currents.
Subtropical waters are highly saline, because evaporation exceeds rainfall, whereas seawater at high latitudes and in the tropics—where more rain falls than evaporates—is less so (Figure 1b, d). The Atlantic, the saltiest ocean basin, loses more freshwater through evaporation than it gains from precipitation, while the Pacific is nearly neutral (i.e., precipitation gain nearly balances evaporation loss), and the Southern Ocean (region around Antarctica) is dominated by precipitation.
Changes in surface salinity and in the upper ocean have reinforced the mean salinity pattern. The evaporation-dominated subtropical regions have become saltier, while the precipitation-dominated subpolar and tropical regions have become fresher. When changes over the top 500m are considered, the evaporation-dominated Atlantic has become saltier, while the nearly neutral Pacific and precipitation-dominated Southern Ocean have become fresher (Figure 1c).
Observing changes in precipitation and evaporation directly and globally is difficult, because most of the exchange of fresh water between the atmosphere and the surface happens over the 70% of the Earth’s surface covered by ocean. Long-term precipitation records are available only from over the land, and there are no long-term measurements of evaporation.
Land-based observations show precipitation increases in some regions, and decreases in others, making it difficult to construct a globally integrated picture. Land-based observations have shown more extreme rainfall events, and more flooding associated with earlier snow melt at high northern latitudes, but there is strong regionality in the trends. Land-based observations are so far insufficient to provide evidence of changes in drought.
Ocean salinity, on the other hand, acts as a sensitive and effective rain gauge over the ocean. It naturally reflects and smooths out the difference between water gained by the ocean from precipitation, and water lost by the ocean through evaporation, both of which are very patchy and episodic. Ocean salinity is also affected by water runoff from the continents, and by the melting and freezing of sea ice or floating glacial ice. Fresh water added by melting ice on land will change global-averaged salinity, but changes to date are too small to observe.
Data from the past 50 years show widespread salinity changes in the upper ocean, which are indicative of systematic changes in precipitation and runoff minus evaporation, as illustrated below.
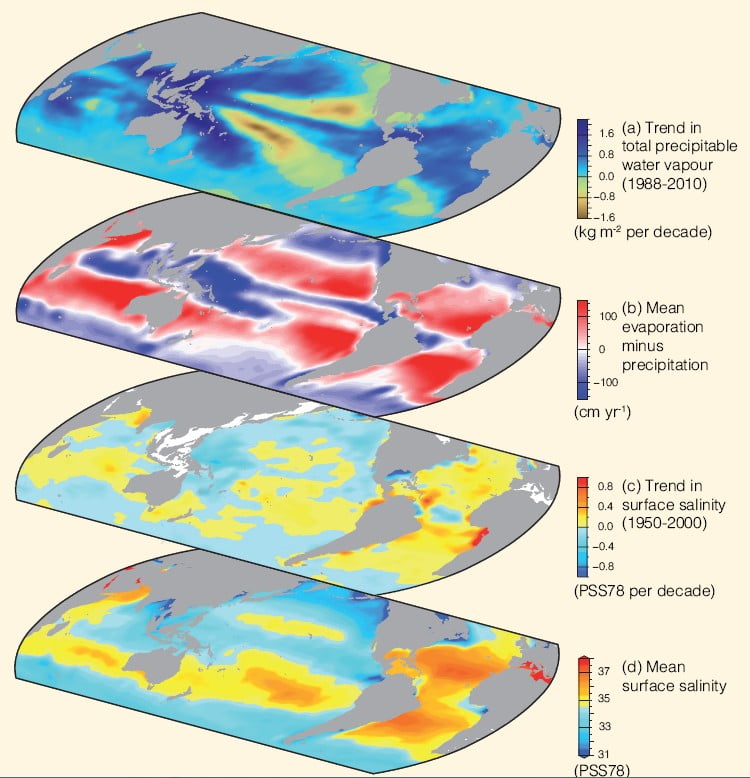 Figure 1: Changes in sea surface salinity are related to the atmospheric patterns of evaporation minus precipitation (E – P) and trends in total precipitable water: (a) Linear trend (1988–2010) in total precipitable water (water vapour integrated from the Earth’s surface up through the entire atmosphere) (kg m–2 per decade) from satellite observations (Special Sensor Microwave Imager) (blues: wetter; yellows: drier). (b) The 1979–2005 climatological mean net E –P (cm yr–1) from meteorological reanalysis (reds: net evaporation; blues: net precipitation). (c) Trend (1950–2000) in surface salinity (PSS78 per 50 years) (blues freshening; yellows-reds saltier). (d) The climatological-mean surface salinity (PSS78) (blues: <35; yellows–reds: >35).
How Important Is Water Vapour to Climate Change?
WG1 FAQ 8.1
As the largest contributor to the natural greenhouse effect, water vapour plays an essential role in the Earth’s climate. However, the amount of water vapour in the atmosphere is controlled mostly by air temperature, rather than by emissions. For that reason, scientists consider it a feedback agent, rather than a forcing to climate change. Anthropogenic emissions of water vapour through irrigation or power plant cooling have a negligible impact on the global climate.
Water vapour is the primary greenhouse gas in the Earth’s atmosphere. The contribution of water vapour to the natural greenhouse effect relative to that of carbon dioxide (CO2) depends on the accounting method, but can be considered to be approximately two to three times greater. Additional water vapour is injected into the atmosphere from anthropogenic activities, mostly through increased evaporation from irrigated crops, but also through power plant cooling, and marginally through the combustion of fossil fuel. One may therefore question why there is so much focus on CO2, and not on water vapour, as a forcing to climate change.
Water vapour behaves differently from CO2 in one fundamental way: it can condense and precipitate. When air with high humidity cools, some of the vapour condenses into water droplets or ice particles and precipitates. The typical residence time of water vapour in the atmosphere is ten days. The flux of water vapour into the atmosphere from anthropogenic sources is considerably less than from ‘natural’ evaporation. Therefore, it has a negligible impact on overall concentrations, and does not contribute significantly to the long-term greenhouse effect. This is the main reason why tropospheric water vapour (typically below 10km altitude) is not considered to be an anthropogenic gas contributing to radiative forcing.
Anthropogenic emissions do have a significant impact on water vapour in the stratosphere, which is the part of the atmosphere above about 10 km. Increased concentrations of methane (CH4) due to human activities lead to an additional source of water, through oxidation, which partly explains the observed changes in that atmospheric layer. That stratospheric water change has a radiative impact, is considered a forcing, and can be evaluated. Stratospheric concentrations of water have varied significantly in past decades. The full extent of these variations is not well understood and is probably less a forcing than a feedback process added to natural variability. The contribution of stratospheric water vapour to warming, both forcing and feedback, is much smaller than from CH4 or CO2.
The maximum amount of water vapour in the air is controlled by temperature. A typical column of air extending from the surface to the stratosphere (about 10km in height) in polar regions may contain only a few kilograms of water vapour per square metre, while a similar column of air in the tropics may contain up to 70 kg. With every extra degree of air temperature, the atmosphere can retain around 7% more water vapour (see upper-left insert in the figure). This increase in concentration amplifies the greenhouse effect, and therefore leads to more warming. This process, referred to as the water vapour feedback, is well understood and quantified. It occurs in all models used to estimate climate change, where its strength is consistent with observations. Although an increase in atmospheric water vapour has been observed, this change is recognized as a climate feedback (from increased atmospheric temperature) and should not be interpreted as a radiative forcing from anthropogenic emissions.
Currently, water vapour has the largest greenhouse effect in the Earth’s atmosphere. However, other greenhouse gases, primarily CO2, are necessary to sustain the presence of water vapour in the atmosphere. Indeed, if these other gases were removed from the atmosphere, its temperature would drop sufficiently to induce a decrease of water vapour, leading to a runaway drop of the greenhouse effect that would plunge the Earth into a frozen state. So greenhouse gases other than water vapour provide the temperature structure that sustains current levels of atmospheric water vapour. Therefore, although CO2 is the main anthropogenic control knob on climate, water vapour is a strong and fast feedback that amplifies any initial forcing by a typical factor between two and three. Water vapour is not a significant initial forcing, but is nevertheless a fundamental agent of climate change.
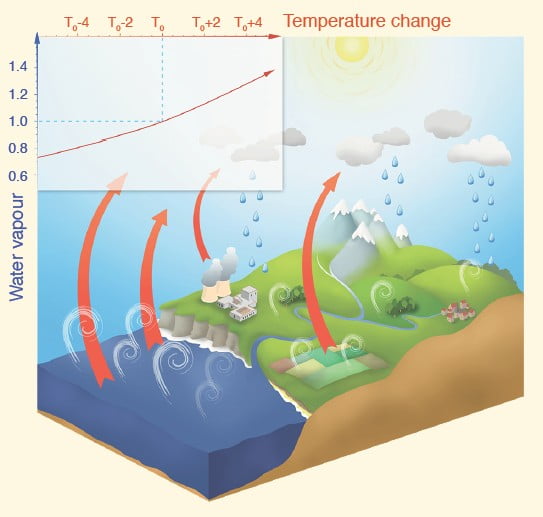 Illustration of the water cycle and its interaction with the greenhouse effect. The upper-left insert indicates the relative increase of potential water vapour content in the air with an increase of temperature (roughly 7% per degree). The white curls illustrate evaporation, which is compensated by precipitation to close the water budget. The red arrows illustrate the outgoing infrared radiation that is partly absorbed by water vapour and other gases, a process that is one component of the greenhouse effect. The stratospheric processes are not included in this figure.
How Will the Earth’s Water Cycle Change?
WG1 FAQ 12.2
The flow and storage of water in the Earth’s climate system are highly variable, but changes beyond those due to natural variability are expected by the end of the current century. In a warmer world, there will be net increases in rainfall, surface evaporation and plant transpiration. However, there will be substantial differences in the changes between locations. Some places will experience more precipitation and an accumulation of water on land. In others, the amount of water will decrease, due to regional drying and loss of snow and ice cover.
The water cycle consists of water stored on the Earth in all its phases, along with the movement of water through the Earth’s climate system. In the atmosphere, water occurs primarily as a gas—water vapour—but it also occurs as ice and liquid water in clouds. The ocean, of course, is primarily liquid water, but the ocean is also partly covered by ice in polar regions. Terrestrial water in liquid form appears as surface water—such as lakes and rivers—soil moisture and groundwater. Solid terrestrial water occurs in ice sheets, glaciers, snow and ice on the surface and in permafrost and seasonally frozen soil.
Statements about future climate sometimes say that the water cycle will accelerate, but this can be misleading, for strictly speaking, it implies that the cycling of water will occur more and more quickly with time and at all locations. Parts of the world will indeed experience intensification of the water cycle, with larger transports of water and more rapid movement of water into and out of storage reservoirs. However, other parts of the climate system will experience substantial depletion of water, and thus less movement of water. Some stores of water may even vanish.
As the Earth warms, some general features of change will occur simply in response to a warmer climate. Those changes are governed by the amount of energy that global warming adds to the climate system. Ice in all forms will melt more rapidly, and be less pervasive. For example, for some simulations assessed in this report, summer Arctic sea ice disappears before the middle of this century. The atmosphere will have more water vapour, and observations and model results indicate that it already does. By the end of the 21st century, the average amount of water vapour in the atmosphere could increase by 5 to 25%, depending on the amount of human emissions of greenhouse gases and radiatively active particles, such as smoke. Water will evaporate more quickly from the surface. Sea level will rise due to expansion of warming ocean waters and melting land ice flowing into the ocean.
These general changes are modified by the complexity of the climate system, so that they should not be expected to occur equally in all locations or at the same pace. For example, circulation of water in the atmosphere, on land and in the ocean can change as climate changes, concentrating water in some locations and depleting it in others. The changes also may vary throughout the year: some seasons tend to be wetter than others. Thus, model simulations assessed in this report show that winter precipitation in northern Asia may increase by more than 50%, whereas summer precipitation there is projected to hardly change. Humans also intervene directly in the water cycle, through water management and changes in land use. Changing population distributions and water practices would produce further changes in the water cycle.
Water cycle processes can occur over minutes, hours, days and longer, and over distances from metres to kilometres and greater. Variability on these scales is typically greater than for temperature, so climate changes in precipitation are harder to discern. Despite this complexity, projections of future climate show changes that are common across many models and climate forcing scenarios. These results collectively suggest well understood mechanisms of change, even if magnitudes vary with model and forcing. We focus here on changes over land, where changes in the water cycle have their largest impact on human and natural systems.
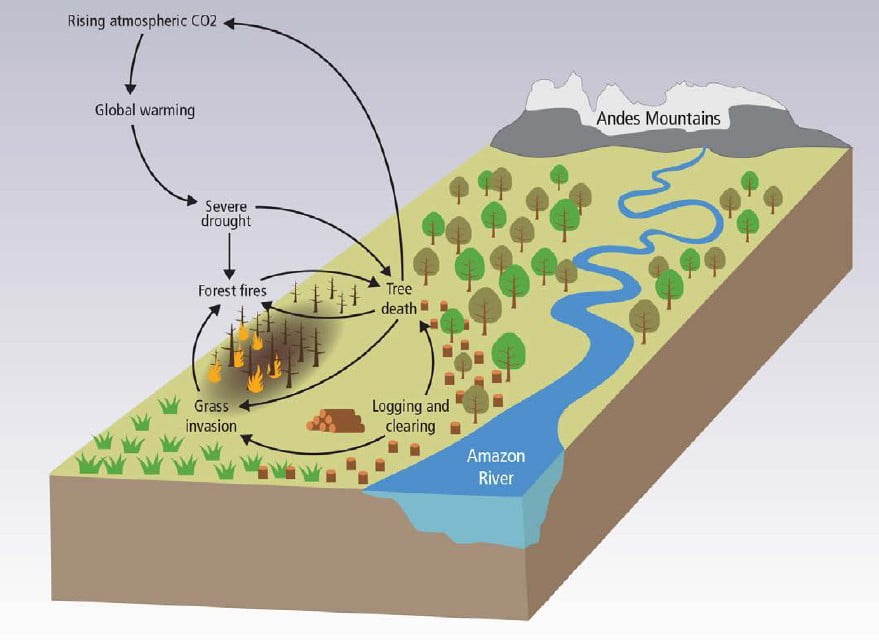
Projected climate changes from simulations assessed in this report (shown schematically in Figure 1) generally show an increase in precipitation in parts of the deep tropics and polar latitudes that could exceed 50% by the end of the 21st century under the most extreme emissions scenario. In contrast, large areas of the subtropics could have decreases of 30% or more. In the tropics, these changes appear to be governed by increases in atmospheric water vapour and changes in atmospheric circulation that further concentrate water vapour in the tropics and thus promote more tropical rainfall. In the subtropics, these circulation changes simultaneously promote less rainfall despite warming in these regions. Because the subtropics are home to most of the world’s deserts, these changes imply increasing aridity in already dry areas, and possible expansion of deserts.
Increases at higher latitudes are governed by warmer temperatures, which allow more water in the atmosphere and thus, more water that can precipitate. The warmer climate also allows storm systems in the extratropics to transport more water vapour into the higher latitudes, without requiring substantial changes in typical wind strength. As indicated above, high latitude changes are more pronounced during the colder seasons.
Whether land becomes drier or wetter depends partly on precipitation changes, but also on changes in surface evaporation and transpiration from plants (together called evapotranspiration). Because a warmer atmosphere can have more water vapour, it can induce greater evapotranspiration, given sufficient terrestrial water. However, increased carbon dioxide in the atmosphere reduces a plant’s tendency to transpire into the atmosphere, partly counteracting the effect of warming.
In the tropics, increased evapotranspiration tends to counteract the effects of increased precipitation on soil moisture, whereas in the subtropics, already low amounts of soil moisture allow for little change in evapotranspiration. At higher latitudes, the increased precipitation generally outweighs increased evapotranspiration in projected climates, yielding increased annual mean runoff, but mixed changes in soil moisture. As implied by circulation changes in Figure 1, boundaries of high or low moisture regions may also shift.
A further complicating factor is the character of rainfall. Model projections show rainfall becoming more intense, in part because more moisture will be present in the atmosphere. Thus, for simulations assessed in this report, over much of the land, 1-day precipitation events that currently occur on average every 20 years could occur every 10 years or even more frequently by the end of the 21st century. At the same time, projections also show that precipitation events overall will tend to occur less frequently. These changes produce two seemingly contradictory effects: more intense downpours, leading to more floods, yet longer dry periods between rain events, leading to more drought.
At high latitudes and at high elevation, further changes occur due to the loss of frozen water. Some of these are resolved by the present generation of global climate models (GCMs), and some changes can only be inferred because they involve features such as glaciers, which typically are not resolved or included in the models. The warmer climate means that snow tends to start accumulating later in the fall, and melt earlier in the spring. Simulations assessed in this report show March to April snow cover in the Northern Hemisphere is projected to decrease by approximately 10 to 30% on average by the end of this century, depending on the greenhouse gas scenario. The earlier spring melt alters the timing of peak springtime flow in rivers receiving snowmelt. As a result, later flow rates will decrease, potentially affecting water resource management. These features appear in GCM simulations.
Loss of permafrost will allow moisture to seep more deeply into the ground, but it will also allow the ground to warm, which could enhance evapotranspiration. However, most current GCMs do not include all the processes needed to simulate well permafrost changes. Studies analysing soils freezing or using GCM output to drive more detailed land models suggest substantial permafrost loss by the end of this centuryChanges to Groundwater in Uganda . In addition, even though current GCMs do not explicitly include glacier evolution, we can expect that glaciers will continue to recede, and the volume of water they provide to rivers in the summer may dwindle in some locations as they disappear. Loss of glaciers will also contribute to a reduction in springtime river flow. However, if annual mean precipitation increases—either as snow or rain—then these results do not necessarily mean that annual mean river flow will decrease.
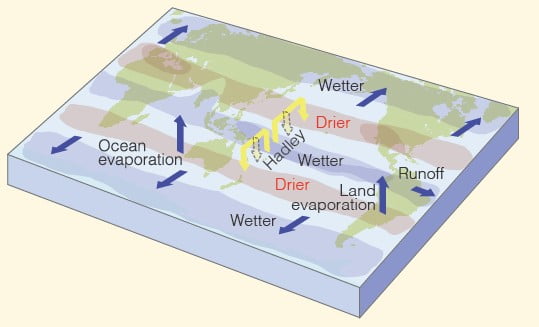 Figure 1: Schematic diagram of projected changes in major components of the water cycle. The blue arrows indicate major types of water movement changes through the Earth’s climate system: poleward water transport by extratropical winds, evaporation from the surface and runoff from the land to the oceans. The shaded regions denote areas more likely to become drier or wetter. Yellow arrows indicate an important atmospheric circulation change by the Hadley Circulation, whose upward motion promotes tropical rainfall, while suppressing subtropical rainfall. Model projections indicate that the Hadley Circulation will shift its downward branch poleward in both the Northern and Southern Hemispheres, with associated drying. Wetter conditions are projected at high latitudes, because a warmer atmosphere will allow greater precipitation, with greater movement of water into these regions.
How will climate change affect the frequency and severity of floods and droughts?
WG2 FAQ 3.1
Climate change is projected to alter the frequency and magnitude of both floods and droughts. The impact is expected to vary from region to region. The few available studies suggest that flood hazards will increase over more than half of the globe, in particular in central and eastern Siberia, parts of south-east Asia including India, tropical Africa, and northern South America, but decreases are projected in parts of northern and eastern Europe, Anatolia, central and east Asia, central North America, and southern South America. The frequency of floods in small river basins is very likely to increase, but that may not be true of larger watersheds because intense rain is usually confined to more limited areas. Spring snowmelt floods are likely to become smaller, both because less winter precipitation will fall as snow and because more snow will melt during thaws over the course of the entire winter. Worldwide, the damage from floods will increase because more people and more assets will be in harm’s way.
By the end of the 21st century meteorological droughts (less rainfall) and agricultural droughts (drier soil) are projected to become longer, or more frequent, or both, in some regions and some seasons, because of reduced rainfall or increased evaporation or both. But it is still uncertain what these rainfall and soil moisture deficits might mean for prolonged reductions of streamflow and lake and groundwater levels. Droughts are projected to intensify in southern Europe and the Mediterranean region, central Europe, central and southern North America, Central America, northeast Brazil and southern Africa. In dry regions, more intense droughts will stress water-supply systems. In wetter regions, more intense seasonal droughts can be managed by current water-supply systems and by adaptation; for example, demand can be reduced by using water more efficiently, or supply can be increased by increasing the storage capacity in reservoirs.
How will the availability of water resources be affected by climate change?
WG2 FAQ 3.2
Climate models project decreases of renewable water resources in some regions and increases in others, albeit with large uncertainty in many places. Broadly, water resources are projected to decrease in many mid-latitude and dry subtropical regions, and to increase at high latitudes and in many humid mid-latitude regions. Even where increases are projected, there can be short-term shortages due to more variable streamflow (because of greater variability of precipitation), and seasonal reductions of water supply due to reduced snow and ice storage. Availability of clean water can also be reduced by negative impacts of climate change on water quality; for instance the quality of lakes used for water supply could be impaired by the presence of algae producing toxins.
How is climate change affecting monsoons?
WG1 FAQ 14.1
Monsoons are the most important mode of seasonal climate variation in the tropics, and are responsible for a large fraction of the annual rainfall in many regions. Their strength and timing is related to atmospheric moisture content, land–sea temperature contrast, land cover and use, atmospheric aerosol loadings and other factors. Overall, monsoonal rainfall is projected to become more intense in future, and to affect larger areas, because atmospheric moisture content increases with temperature. However, the localized effects of climate change on regional monsoon strength and variability are complex and more uncertain.
Monsoon rains fall over all tropical continents: Asia, Australia, the Americas and Africa. The monsoon circulation is driven by the difference in temperature between land and sea, which varies seasonally with the distribution of solar heating. The duration and amount of rainfall depends on the moisture content of the air, and on the configuration and strength of the atmospheric circulation. The regional distribution of land and ocean also plays a role, as does topography. For example, the Tibetan Plateau—through variations in its snow cover and surface heating—modulates the strength of the complex Asian monsoon systems. Where moist on-shore winds rise over mountains, as they do in southwest India, monsoon rainfall is intensified. On the lee side of such mountains, it lessens.
Since the late 1970s, the East Asian summer monsoon has been weakening and not extending as far north as it used to in earlier times, as a result of changes in the atmospheric circulation. That in turn has led to increasing drought in northern China, but floods in the Yangtze River Valley farther south. In contrast, the Indo-Australian and Western Pacific monsoon systems show no coherent trends since the mid-20th century, but are strongly modulated by the El Niño-Southern Oscillation (ENSO). Similarly, changes observed in the South American monsoon system over the last few decades are strongly related to ENSO variability. Evidence of trends in the North American monsoon system is limited, but a tendency towards heavier rainfalls on the northern side of the main monsoon region has been observed. No systematic long-term trends have been observed in the behaviour of the Indian or the African monsoons.
The land surface warms more rapidly than the ocean surface, so that surface temperature contrast is increasing in most regions. The tropical atmospheric overturning circulation, however, slows down on average as the climate warms due to energy balance constraints in the tropical atmosphere. These changes in the atmospheric circulation lead to regional changes in monsoon intensity, area and timing. There are a number of other effects as to how climate change can influence monsoons. Surface heating varies with the intensity of solar radiation absorption, which is itself affected by any land use changes that alter the reflectivity (albedo) of the land surface. Also, changing atmospheric aerosol loadings, such as air pollution, affect how much solar radiation reaches the ground, which can change the monsoon circulation by altering summer solar heating of the land surface. Absorption of solar radiation by aerosols, on the other hand, warms the atmosphere, changing the atmospheric heating distribution.
The strongest effect of climate change on the monsoons is the increase in atmospheric moisture associated with warming of the atmosphere, resulting in an increase in total monsoon rainfall even if the strength of the monsoon circulation weakens or does not change.
Climate model projections through the 21st century show an increase in total monsoon rainfall, largely due to increasing atmospheric moisture content. The total surface area affected by the monsoons is projected to increase, along with the general poleward expansion of the tropical regions. Climate models project from 5% to an approximately 15% increase of global monsoon rainfall depending on scenarios. Though total tropical monsoon rainfall increases, some areas will receive less monsoon rainfall, due to weakening tropical wind circulations. Monsoon onset dates are likely to be early or not to change much and the monsoon retreat dates are likely to delay, resulting in lengthening of the monsoon season.
Future regional trends in monsoon intensity and timing remain uncertain in many parts of the world. Year-to-year variations in the monsoons in many tropical regions are affected by ENSO. How ENSO will change in future—and how its effects on monsoon will change—also remain uncertain. However, the projected overall increase in monsoon rainfall indicates a corresponding increase in the risk of extreme rain events in most regions.
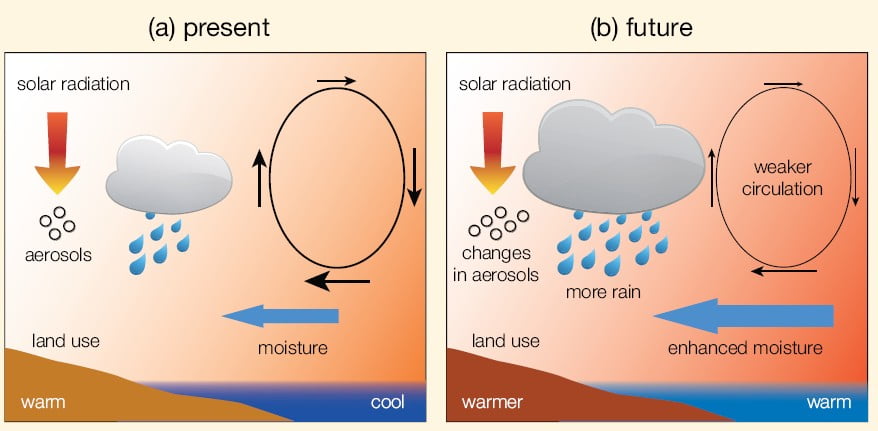 Schematic diagram illustrating the main ways that human activity influences monsoon rainfall. As the climate warms, increasing water vapour transport from the ocean into land increases because warmer air contains more water vapour. This also increases the potential for heavy rainfalls. Warming-related changes in large-scale circulation influence the strength and extent of the overall monsoon circulation. Land use change and atmospheric aerosol loading can also affect the amount of solar radiation that is absorbed in the atmosphere and land, potentially moderating the land–sea temperature difference.
Changes to Groundwater in Uganda
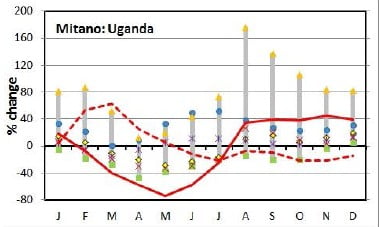
Simulated change in mean monthly runoff of the Mitano River in Uganda across seven climate models, for a 2°C increase in global mean temperature above the 1961-1990 average. One of the seven climate models is highlighted separately, showing changes for both a 2°C increase (dotted line) and a 4°C increase (solid line).
Simulated change in mean monthly runoff of the Mitano River in Uganda across seven climate models, for a 2°C increase in global mean temperature above the 1961-1990 average. One of the seven climate models is highlighted separately, showing changes for both a 2°C increase (dotted line) and a 4°C increase (solid line).
Precipitation is the main driver of changes to river runoff and the seasonal changes in precipitation are usually reflected in seasonal streamflow variability. However, changes in groundwater recharge also affect streamflow. As global temperatures rise, evapotranspiration increases, reducing the amount of groundwater. Human and natural systems in the Upper Nile region have historically been very vulnerable to changes in river flow. People are particularly reliant on the river for fishing and hydro-electric power production, so, although it can be hard for models to accurately recreate local rainfall patterns, it is important to try to project how they might change in the future.
The Mitano river is in the Upper Nile basin in Uganda, which has a humid, tropical climate. Usually, the effect of the ‘short’ (March-May) and ‘long’ (September- November) rains determine the river’s discharge. However, mean global temperature increases of 4°C or more with respect to the 1961-1990 average are projected to decrease groundwater outflow to the river so much that the annual mean discharge will fall, even though annual mean precipitation will be higher. The spring discharge peak disappears and the river flow regime changes from having two seasonal peaks to only one – the effect of the ‘short rains’ could be lost. This is because, for the Mitano, groundwater flow is far more important than lateral (quickflow within the upper soil profile) or surface flow. Increasing evapotranspiration limits the amount of water penetrating the soil profile and replenishing the shallow groundwater store during the first, short, wet season.
Changing groundwater levels also affect land surface energy fluxes, including through evaporation, and thus feedback on the climate system, particularly in semi-arid areas.
Additional source:
Kingston, D. G. and Taylor, R. G.: Sources of uncertainty in climate change impacts on river discharge and groundwater in a headwater catchment of the Upper Nile Basin, Uganda, Hydrol. Earth Syst. Sci., 14, 1297-1308, doi:10.5194/hess-14-1297-2010, 2010.
The mass budgets of Himalayan Glaciers
The mass budgets of Himalayan glaciers in Bhutan, China, India, Nepal and Pakistan have been negative, on average, for the past 5 decades. Changes in temperature and precipitation affect the glaciers, as do changes in the amount of black carbon (soot) in the atmosphere, which, when deposited on the glaciers’ surface, can decrease the albedo and lead to melting. Many communities are both reliant on glacial meltwater and vulnerable to flooding from moraine-dammed ice marginal lakes.


