
This resource links to Figure 11.12 in the IPCC report of 2021. The aim of this resource is to answer the question how will the flow of water around the world be altered with climate change?
It was written with the Royal Geographical Society with IBG.

Circulation
The global atmospheric circulation is described by the Met Office as ‘the world-wide system of winds by which the necessary transport of heat from tropical to polar latitudes is accomplished’. Figure 1 shows the different cells of this global system, in Idealized Earth and Actual Earth projections.
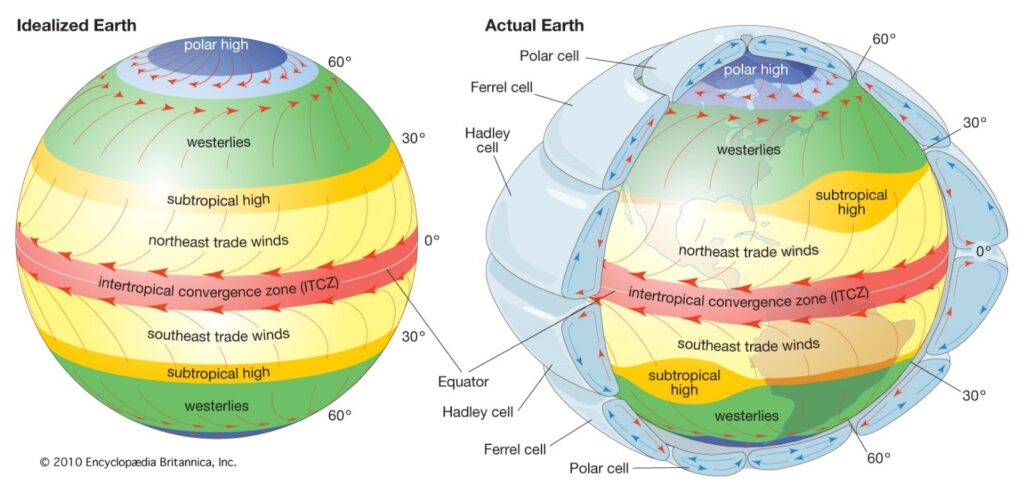
Figure 1 the different cells of the global atmospheric circulation © 2010 Encyclopædia Britannica Inc
Due to changes in our climate, there will be both small-scale and large-scale changes to the flow of water around the world in the twenty-first century.
- The central world map of Figure 8.21 in chapter 8 of the IPCC report shows the effect of 3°C of global warming on mean P-E (precipitation minus evaporation) compared to pre-industrial levels (1850-1900). Describe the anticipated changes to mean P-E across the globe with such projected change. Reference specific regions in your answer.
- Using Figure 2 in Appendix A, copy the choropleth colour coding to show the changes to global precipitation for:
a) +0.6 mm to 1 mm increase.
b) -0.6 mm to -1 mm decrease.
- Add the Tropical rain belt onto Figure 2, which is shown in red on the original figure.
- There are 5 anticipated changes to large-scale water circulation. They are the poleward expansion of the Hadley cells, the poleward migration of storm tracks, the narrowing and strengthening of the Intertropical Convergence (ITCZ) core, a regional shift in the ITCZ, and a weaker Walker circulation (for reference watch the MetLink video An Introduction to Atmospheric Circulation and read https://en.wikipedia.org/wiki/Walker_circulation). Add these notes to Figure 2.
There are multiple atmospheric triggers for changes to the water cycle, termed climate drivers. Figure 3 in Appendix B shows how an increase in precipitation, solar radiation, temperature, wind, and carbon dioxide (CO₂) and a decrease in humidity can influence the water cycle. The diagram flows down to illustrate the outcome on water availability and drought.
Precipitation, one of the climatic drivers
Precipitation has increased steadily over Eurasia, most of North America, south-eastern South America, and north-western Australia. Whilst in Africa, eastern Australia, the Mediterranean region, the Middle East, and parts of East Asia, central South America, and the Canadian Pacific coast it has decreased. Records from 1910 onwards show Scandinavia, north-west Russia, the UK, and Iceland have all experienced increased precipitation trends. The amount of, frequency, and intensity of precipitation is forecast to continue to increase for these areas, which will worsen the severity of flooding. Across Europe there has been a reduction in snowfall, an important component in precipitation, in high latitude and mountain watersheds. Per decade, there has been a reduction of 0.52 million km² of annual mean potential snowfall over Northern Europe, with the greatest loss occurring in the Alps.
Runoff, streamflow, and flooding effect
There have been substantial changes to runoff, streamflow, and flooding around the world. Although there are no significant global trends many human-induced drivers of change have been identified and linked to changes in the flow of water. Examples include decreasing runoff in the dry season in the Peruvian Amazon, a decline in streamflow in the Colorado River, and earlier snowmelt in Northern Europe. As a result, in the UK, there will continue to be problems over increased water availability and streamflow during winter, and a worsening decrease in water availability and streamflow during the summer months. These changes are caused by the difference between winter flooding, which occurs from storm precipitation falling on already waterlogged ground, and summer flooding, when precipitation falls on ground that has been baked hard by the Sun. These scenarios have been compounded by dam construction and water withdrawal, land use and land cover change, all leading to alterations of seasonality, amount, and variability of river discharge, especially in human-dominated small catchments.
Climate change is increasing the risk of both flooding and drought in the UK with flooding now being the most common form of natural disaster. The risk of flooding is increasing due to the anthropogenic drivers of climate change. Quite simply this is because, as the atmosphere warms, there is more evaporation from the surface and more condensation of water vapour into cloud droplets in the atmosphere. Intense precipitation will remain the main cause of flooding. However, there are other factors (such as local topography and geology, for example). In 2017 research by the Met Office found that climate change means there is a high chance of exceeding the observed record monthly rainfall totals in many regions of the UK. Further analysis in 2020 (again by the Met Office) shows that, on average, for the decade 2010 to 2019, UK summers were 13% wetter, and winters 12% wetter, than in the period 1961 to 1990. 7 of the 11 wettest years since records began (in 1862) in the UK have occurred since 1998. The five wettest winters have been from 1990 onwards. Overall, in the UK there is a trend towards wetter winters and drier summers.
Further work
- The Met Office UK extreme events – Heavy rainfall and floods
Exam-style question
Using all the work you have completed answer the final question below.
Answer the question: assess whether global flooding will become more severe or more frequent as a result of climate change? This means you must consider the different arguments, likelihoods, and levels of certainty, after weighing them up, to come to a conclusion.
Appendix A
Large Scale Circulation projected changes and their effect on the water cycle
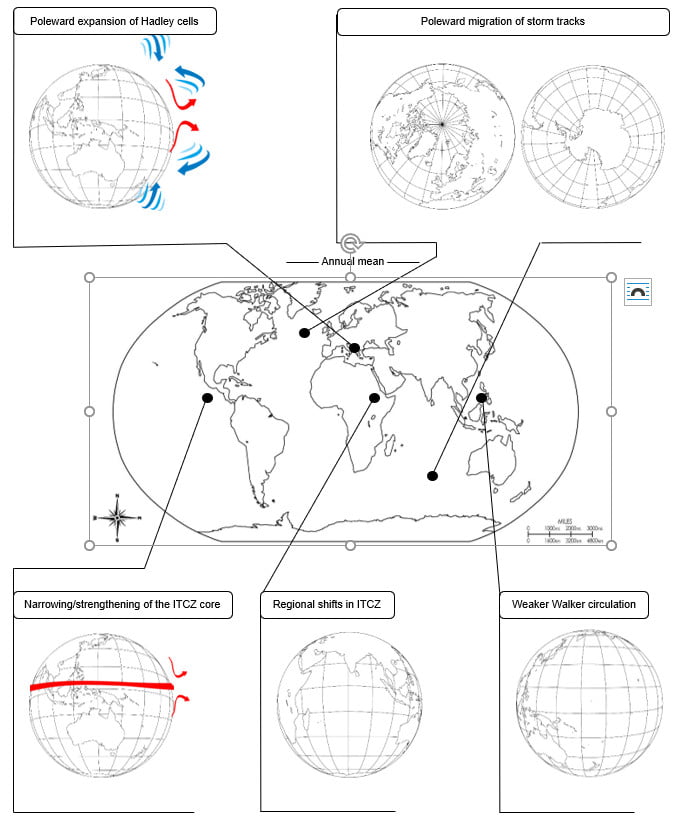
Figure 2 circulation projected change maps © freeusandworldmaps.com arrows © cliparts.co and getdrawing.com
Appendix B
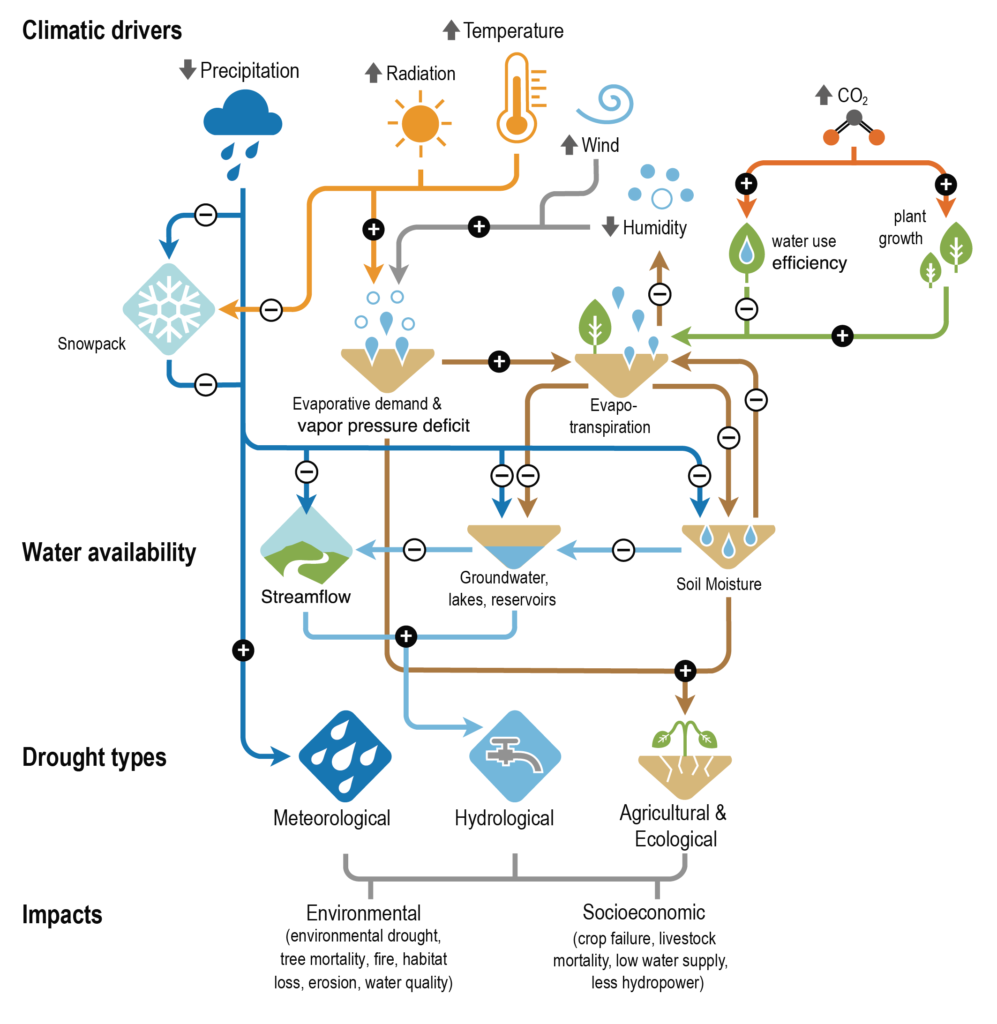
Figure 3 climate drivers © The IPCC report
Answers
- The intertropical convergence zone will predominately see an increase in precipitation with 0.8 to 1 mm/d increase across the Pacific Ocean (with some variability near the Central American coast). In the rest of the tropics, both north and south, there will be a reduction in P-E balance with less precipitation over all major oceans within the subtropical boundaries. This is described as a future ‘drying tendency’ on the edges of the ITCZ. In the upper latitude the Barents Sea will also become drier as the P-E balance changes in the Russian Arctic, between Novaya Zemlya and Svalbard. On land much of climate over the South American Amazon will also continue to dry. In contrast Alaska in North America and the Congo basin in Sub-Saharan Africa will see an increase in P-E.
- As instructed.
- As instructed.
- Under a climate change 3° warming scenario the Hadley cell will move northwards away from the current 0° to 30° latitude (N and S). This will lead to the expansion of the subtropical dry zones outwards and away from the tropics. Equally there will be a poleward migration of storm tracks which will lead to stronger storms as they will feed off extra latent heat. Abnormally high sea surface temperatures, in the Atlantic for example, will intensified storms throughout the twenty-first century with associated storm surges being exacerbated by rising sea levels. It is also believed extra water vapor in the atmosphere will make storms wetter. In the future, the ITCZ will narrow, particularly over the Pacific, causing lower latitude subtropical jets to become unstable baroclinically (in temperature and pressure). This will allow midlatitude eddies (circular movements of air) to spread further equatorward leading to more precipitation in the ITCZ core region. The Walker Circulation has undergone a strengthening in the Pacific, thought to be caused by either internal variability or a response to greenhouse gas emissions. The altered circulation pattern is associated with other global changes in the water cycle over regions like the Maritime Continent, South America and Africa.