Fieldwork Suggestions for Independent Investigations

Some ideas, data sources and guidance for students wishing to include weather measurements in their NEA or EPQ.

Updated November 2022

A guide to collecting weather data

https://www.rgs.org/CMSPages/GetFile.aspx?nodeguid=59f46632-ae51-4ea7-ab94-a0c537eb3c71&lang=en-GB

Passage of a depression

https://www.metlink.org/wp-content/uploads/2020/12/depression_wow_teacher_Eva.pdf
Data source:

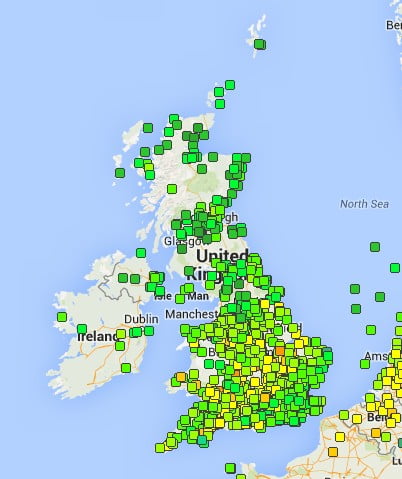
http://wow.metoffice.gov.uk

Weather and Health/ Behaviour

Data source: http://wow.metoffice.gov.uk

Urban Climates

Using Wow data to look at urban heat islands https://www.metlink.org/resource/using-wow-to-illustrate-the-urban-heat-island-effect/

Urban winds: fieldwork guidance can be found on https://www.metlink.org/fieldwork-resource/fieldwork-in-geography/

Urban temperature https://www.metlink.org/fieldwork-resource/urban-heat-island-introduction/
Data source: http://wow.metoffice.gov.uk

Community resilience to extreme weather

Local microclimate

https://www.metlink.org/fieldwork-resource/using-usb-temperature-dataloggers/

https://www.rgs.org/schools/teaching-resources/quick-and-easy-ideas/

Data source: http://wow.metoffice.gov.uk

Factors affecting rainfall:


https://www.manchester.ac.uk/discover/news/tuesday-wettest-day-of-week-suggests-new-analysis/
https://rmets.onlinelibrary.wiley.com/doi/10.1002/joc.2321

Orographic rainfall https://www.metlink.org/resource/orographic-relief-rainfall-and-the-foehn-effect/


Red Sky at Night


https://www.metlink.org/resource/red-sky-teachers/ with an introductory concept cartoon from the ASE 
https://www.metlink.org/blog/folklore/weather-folklore/

Snow

 https://www.metlink.org/blog/extreme-weather/when-will-it-snow/

Sky Colour


https://www.exploringoverland.com/constantapprentice/2021/8/10/making-a-cyanometer-to-measure-sky-moisture-through-color with https://uk-air.defra.gov.uk/interactive-map pollution forecast and pollen forecast http://www.metoffice.gov.uk/health/public/pollen-forecast

Weather and Flooding


Data source: National River Flow Archive http://nrfa.ceh.ac.uk/ and https://environment.data.gov.uk/hydrology/index.html#/landing

Sea level

http://www.coolgeography.co.uk/GCSE/AQA/Coastal%20Zone/Sea%20level%20rise/Sea%20level%20rise.htm

Land and Sea breezes, sea breeze front

Data source: http://wow.metoffice.gov.uk

Air Masses


https://earth.nullschool.net/
http://www1.wetter3.de/Archiv/archiv_ukmet.html
various links on https://www.metlink.org/teaching-resources/?_sft_topic=air-masses
including https://www.metlink.org/resource/pressure-and-rainfall/
Data source: http://wow.metoffice.gov.uk

General resources


https://www.metlink.org/fieldwork-resource/instruments-and-fieldwork/


https://www.rgs.org/schools/teaching-resources/key-stage-five/extreme-weather/


https://www.metlink.org/fieldwork/


https://www.rgs.org/schools/teaching-resources/a-student-guide-to-the-a-level-independent-investi/


https://www.field-studies-council.org/resources/16-18-geography/route-to-enquiry/

Predict the Graph

For each of the situations below, can you predict what the microclimate might look like by sketching a line or curve on each of the graphs? Each graph shows one measurement, marked with a red dot. 

  • It is a sunny, calm day in the middle of summer. You are making measurements of the air temperature, 1m above the ground, near a large, deep pond, in the afternoon.
graph

Justify the shape of your sketched line: ________________________________________________________________________________________________________________________________________________________________________________________________________________________________________________________________________________________________________________________________________

  • It is a clear, cold, calm day in early winter. You are making measurements of the air temperature, 1m above the ground, near a large, deep pond.
graph

Justify the shape of your sketched line: ________________________________________________________________________________________________________________________________________________________________________________________________________________________________________________________________________________________________________________________________________

  • You are making measurements of the humidity of the air, near a large, deep pond on a calm clear day.
graph

Justify the shape of your sketched line: ________________________________________________________________________________________________________________________________________________________________________________________________________________________________________________________________________________________________________________________________________

  • You are making measurements of the air temperature, 1m above the ground, near a large, tarmacked car park on a sunny, calm summer’s day.
temperature graph

Justify the shape of your sketched line: ________________________________________________________________________________________________________________________________________________________________________________________________________________________________________________________________________________________________________________________________________

  • It is a clear, cold day in late winter. You are making measurements of the air temperature, 1m above the ground, near a large, heated building. Add an appropriate x axis as well as a temperature line or curve to this graph:
graph

Justify the shape of your sketched line: ________________________________________________________________________________________________________________________________________________________________________________________________________________________________________________________________________________________________________________________________________

Where would you put…?

Have a look at the National Trust page for Lyme Park – a stately home near Manchester, to get a feel for what the Park looks like.

Now go to streetmap.co.uk and search for Lyme Park (which is in Cheshire).

You can explore Lyme Park on various maps using the Zoom Control:

The 1:50 000 map is an Ordnance Survey map which shows you grid references, contours and the boundary of the National Trust land (shaded purple).

The 1: 25 000 map is also an Ordnance Survey map with more detail. The boundary of the National Trust park is now shown as a dashed pink line.

Think about the following items:

  • A wind turbine
  1. What sort of location does it need (thinking about the microclimate)?___________________________________________________________________________________________________________________________________________________________________________________________________________________________________________________________________________________
  2. Suggest a six-figure grid reference for somewhere in Lyme Park that would be a good place to situate a wind turbine ___________________
  • A bench
  1. What sort of location does it need (thinking about the microclimate)?___________________________________________________________________________________________________________________________________________________________________________________________________________________________________________________________________________________
  2. Suggest a six-figure grid reference for somewhere in Lyme Park that would be a good place to situate a bench ___________________
  • An Ice House (this was a building used to store ice through the year before freezers were invented)
  1. What sort of location does it need (thinking about the microclimate)?___________________________________________________________________________________________________________________________________________________________________________________________________________________________________________________________________________________
  2. Suggest a six-figure grid reference for somewhere in Lyme Park that would be a good place to situate an ice house ___________________
  • A weather station?
  1. What sort of location does it need (thinking about the microclimate)?___________________________________________________________________________________________________________________________________________________________________________________________________________________________________________________________________________________
  2. Suggest a six-figure grid reference for somewhere in Lyme Park that would be a good place to situate a weather station ___________________

Investigating the Location of Official Weather Stations

Go to the WOW weather observations website wow.metoffice.gov.uk and, under filters, select only ‘official observations’.

Choose a weather station to investigate and use the map to zoom in on exactly where it is.

  • Name of weather station______________________________________
  • Describe the location of the weather station as precisely as you can – which towns or villages is it near, which roads are nearby? ____________________________________________________________________________________________________________________________________________________________________________________________________________________________________________________________________________________________________________

If you can, take a screen shot of the location of the weather station and paste it in your work.


Now use https://www.google.co.uk/maps/ in a separate tab of your web browser and try and find the location of the weather station (it might not be precisely where it is shown on the WOW website – it could be 10m or more away, so look around a bit). Go to satellite view and zoom in as far as you can – can you find the weather station in the satellite image? If you can, take a screen shot of the location and paste it into your work.

Thinking about the local microclimate and what can affect it, why has this official weather station been placed where it is? Try and list at least 4 factors:

____________________________________________________________________________________________________________________________________________________________________________________________________________________________________________________________________________________________________________________________________________________________________________________________________________________________________________________________________________________________________________


Can you think of any other reasons for why the weather station is where it is  – for example due to how easy it is to access?

______________________________________________________________________________________________________________________________________________________________________________________________________________________________________________________


Microclimates

Find out about how to borrow weather instruments in order to be able to carry out a microclimate investigation with your school here, or more about urban heat islands here

What are microclimates?
What are the different types of microclimates?
What is an urban microclimate?
Urban precipitation
Smog
Urban winds
 

What are microclimates?

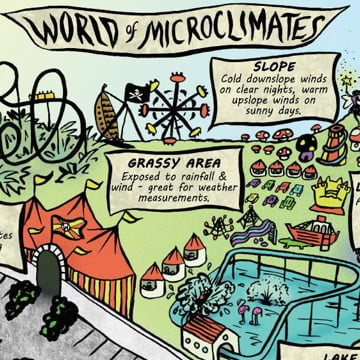
A microclimate is the distinctive climate of a small-scale area, such as a garden, park, valley or part of a city. The weather variables in a microclimate, such as temperature, rainfall, wind or humidity, may be subtly different from the conditions prevailing over the area as a whole and from those that might be reasonably expected under certain types of pressure or cloud cover. Indeed, it is the amalgam of many, slightly different local microclimates that actually makes up the microclimate for a town, city or wood.

It is these subtle differences and exceptions to the rule that make microclimates so fascinating to study, and these notes help to identify and explain the key differences which can be noticed by ground-level observations.

What are the different types of microclimates?

In truth, there is a distinctive microclimate for every type of environment on the Earth’s surface, and as far as the UK is concerned they include the following:

Upland regions

Upland areas have a specific type of climate that is notably different from the surrounding lower levels. Temperature usually falls with height at a rate of between 5 and 10 °C per 1000 m, depending on the humidity of the air. This means that even quite modest upland regions, such as The Cotswolds, can be significantly colder on average than somewhere like the nearby Severn Valley in Gloucestershire.

Occasionally, a temperature inversion can make it warmer above, but such conditions rarely last for long. With higher hills and mountains, the average temperatures can be so much lower that winters are longer and summers much shorter. Higher ground also tends to be windier, which makes for harsher winter weather. The effect of this is that plants and animals are often different from those at low levels.

Hills often cause cloud to form over them by forcing air to rise, either when winds have to go over them or they become heated by the sun. When winds blow against a hill-side and the air is moist, the base of the cloud that forms may be low enough to cover the summit. As the air descends on the other (lee) side, it dries and warms, sometimes enough to create a föhn effect. Consequently, the leeward side of hills and mountain ranges is much drier than the windward side. The clouds that form due to the sun’s heating sometimes grow large enough to produce showers, or even thunderstorms. This rising air can also create an anabatic wind on the sunny side of the hill. Sunshine-facing slopes (south-facing in the Northern Hemisphere, north-facing in the Southern Hemisphere) are warmer than the opposite slopes.

Apart from temperature inversions, another occasion when hills can be warmer than valleys is during clear nights with little wind, particularly in winter. As air cools, it begins to flow downhill and gathers on the valley floor or in pockets where there are dips in the ground. This can sometimes lead to fog and/or frost forming lower down. The flow of cold air can also create what is known as a katabatic wind.

Coastal regions

The coastal climate is influenced by both the land and sea between which the coast forms a boundary. The thermal properties of water are such that the sea maintains a relatively constant day to day temperature compared with the land. The sea also takes a long time to heat up during the summer months and, conversely, a long time to cool down during the winter. In the tropics, sea temperatures change little and the coastal climate depends on the effects caused by the daytime heating and night-time cooling of the land. This involves the development of a breeze from off the sea (sea breeze) from late morning and from off the land (land breeze) during the night. The tropical climate is dominated by convective showers and thunderstorms that continue to form over the sea but only develop over land during the day. As a consequence, showers are less likely to fall on coasts than either the sea or the land.

Around the Poles, sea temperatures remain low due to the presence of ice, and the position of the coast itself can change as ice thaws and the sea re-freezes. One characteristic feature is the development of powerful katabatic winds that can sweep down off the ice caps and out to sea.

In temperate latitudes, the coastal climate owes more to the influence of the sea than of the land and coasts are usually milder than inland during the winter and cooler in the summer. However, short-term variations in temperature and weather can be considerable. The temperature near a windward shore is similar to that over the sea whereas near a leeward shore, it varies much more. During autumn and winter, a windward shore is prone to showers while during spring and summer, showers tend to develop inland. On the other hand, a sea fog can be brought ashore and may persist for some time, while daytime heating causes fog to clear inland. A lee shore is almost always drier, since it is often not affected by showers or sea mist and even frontal rain can be significantly reduced. When there is little wind during the summer, land and sea breezes predominate, keeping showers away from the coast but maintaining any mist or fog from off the sea.

Forests

Tropical rainforests cover only about 6% of the earth’s land surface, but it is believed they have a significant effect on the transfer of water vapour to the atmosphere. This is due to a process known as evapotranspiration from the leaves of the forest trees. Woodland areas in more temperate latitudes can be cooler and less windy than surrounding grassland areas, with the trees acting as a windbreak and the incoming solar radiation being ‘filtered’ by the leaves and branches. However, these differences vary depending on the season, i.e. whether the trees are in leaf, and the type of vegetation, i.e. deciduous or evergreen. Certain types of tree are particularly suitable for use as windbreaks and are planted as barriers around fields or houses.


Urban regions

These are perhaps the most complex of all microclimates. With over 75% of the British population being classed as urban, it is no surprise that they are also the most heavily studied by students of geography and meteorology. Therefore, the rest of these notes focus on the various elements that constitute an urban microclimate.

What is an urban microclimate?

The table below summarises some of the differences in various weather elements in urban areas compared with rural locations.

Sunshine duration5 to 15% less
Annual mean temperature0.5-1.0 °C higher
Winter maximum temperatures1 to 2 °C higher
Occurrence of frosts2 to 3 weeks fewer
Relative humidity in winter2% lower
Relative humidity in summer8 to 10% lower
Total precipitation5 to 10% more
Number of rain days10% more
Number of days with snow14% fewer
Cloud cover5 to 10% more
Occurrence of fog in winter100% more
Amount of condensation nuclei10 times more

Urban heat islands

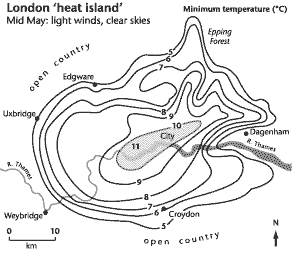
Marked differences in air temperature are some of the most important contrasts between urban and rural areas shown in the table above. For instance, Chandler (1965) found that, under clear skies and light winds, temperatures in central London during the spring reached a minimum of 11 °C, whereas in the suburbs they dropped to 5 °C.

Indeed, the term urban heat island is used to describe the dome of warm air that frequently builds up over towns and cities.

The formation of a heat island is the result of the interaction of the following factors:

  • the release (and reflection) of heat from industrial and domestic buildings;
  • the absorption by concrete, brick and tarmac of heat during the day, and its release into the lower atmosphere at night;
  • the reflection of solar radiation by glass buildings and windows. The central business districts of some urban areas can therefore have quite high albedo rates (proportion of light reflected);
  • the emission of hygroscopic pollutants from cars and heavy industry act as condensation nuclei, leading to the formation of cloud and smog, which can trap radiation. In some cases, a pollution dome can also build up;
  • recent research on London’s heat island has shown that the pollution domes can also filter incoming solar radiation, thereby reducing the build up of heat during the day. At night, the dome may trap some of the heat from the day, so these domes might be reducing the sharp differences between urban and rural areas;
  • the relative absence of water in urban areas means that less energy is used for evapotranspiration and more is available to heat the lower atmosphere;
  • the absence of strong winds to both disperse the heat and bring in cooler air from rural and suburban areas. Indeed, urban heat islands are often most clearly defined on calm summer evenings, often under blocking anticyclones.
Urban pollution dome and plume

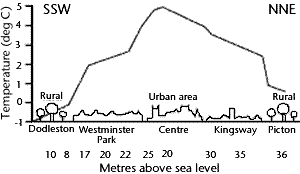
The precise nature of the heat island varies from urban area to urban area, and it depends on the presence of large areas of open space, rivers, the distribution of industries and the density and height of buildings. In general, the temperatures are highest in the central areas and gradually decline towards the suburbs. In some cities, a temperature cliff occurs on the edge of town. This can be clearly seen on the heat profile below for Chester.

Urban heat island in Chester

Urban precipitation

As noted previously, the greater presence of condensation nuclei over urban areas can lead to cities being wetter and having more rain days than surrounding rural areas. Indeed, it was often said that Rochdale, the famous mill town, had significantly smaller amounts of rain on Sundays when the town’s factories were closed.

However, other factors play a major role, especially the heat islands. These can enhance convectional uplift, and the strong thermals that are generated during the summer months may serve to generate or intensify thunderstorms over or downwind of urban areas. Storms cells passing over cities can be ‘refuelled’ by contact with the warm surfaces and the addition of hygroscopic particles. Both can lead to enhanced rainfall, but this usually occurs downwind of the urban area.

Smog

Smogs were common in many British cities in the late 19th and early 20th centuries, when domestic fires, industrial furnaces and steam trains were all emitting smoke and other hygroscopic pollutants by burning fossil fuels. The smogs were particularly bad during the winter months and when temperature inversions built up under high pressure, causing the pollutants to become trapped in the lower atmosphere and for water vapour to condense around these particles.

One of the worst of these ‘pea-soup fogs’ was the London smog of the winter of 1952/53. Approximately 4,000 people died during the smog itself, but it is estimated that 12,000 people may have died due to its effects. As a result, the Clean Air Act of 1956 was introduced to reduce these emissions into the lower atmosphere. Taller chimney stacks and the banning of heavy industry from urban areas were just two of the measures introduced and, consequently, fewer smogs were recorded in the UK during the 1960s and 1970s.

Research in the 1990s has shown, however, that another type of smog – photochemical – is now occurring in some urban areas as a result of fumes from car exhausts and the build up of other pollutants in the lower atmosphere which react with incoming solar radiation. The presence of a brown-coloured haze over urban areas is an indication of photochemical smog, and among its side effects are people experiencing breathing difficulties and asthma attacks.

Urban winds

Tall buildings can significantly disturb airflows over urban areas, and even a building 100 metres or so high can deflect and slow down the faster upper-atmosphere winds. The net result is that urban areas, in general, are less windy than surrounding rural areas.

However, the ‘office quarter’ of larger conurbations can be windier, with quite marked gusts. This is the result of the increased surface roughness that the urban skyline creates, leading to strong vortices and eddies. In some cases, these faster, turbulent winds are funnelled in between buildings, producing a venturi effect, swirling up litter and making walking along the pavements quite difficult.

Web page reproduced with the kind permission of the Met Office

Weather Projects

Introduction

Project ideas:

1. How accurate are weather forecasts for my local area?
2. A survey of how the temperature changes in my back garden
3. An analysis of temperature patterns across a town/city
4. How do wind patterns vary around a large building?
5. How do temperatures vary inside and outside a woodland area?
6. How much precipitation is intercepted in a woodland area?
7. How does the weather change as a depression/warm front/cold front passes over?
8. A study of the shelter effect of trees/hedges
9. How do air temperatures change as you move up a hillside?
10. How do temperatures change as you move inland from the sea/coast

Introduction

These pages give practical advice for pupils and teachers on weather-related projects that could be undertaken. In addition, there is general guidance and advice on equipment that pupils can use at home, at school or out in the field.

General points for teachers when giving advice on weather-related projects

It is always a good idea to encourage more able pupils by adding in the variables of seasonal change or different pressure patterns. Even the simplest project, such as Project 1 on weather forecasts, can be extended to see if the forecasts become more accurate under high pressure.

Practice runs beforehand are ideal and strongly recommended – they give pupils valuable practice with unfamiliar equipment and can help to both identify and iron out potential problems at certain sites. From experience, this gives pupils scope for making extremely good points in the evaluation section of their project.

A 10- to 14-day collection period is advised for many of these projects. Less than 10 days can cause problems with abnormal readings. If the pupils are prepared to take readings for up to 21 days, then let them do so.

The use of maximum-minimum thermometers is the one area where erroneous data can be produced. In theory, their use should be straightforward, but in practice, pupils may not read from the right place, or reset the thermometers. These points should be stressed, especially if their friends or family are making the readings – do not assume that parents know how to use the maximum-minimum thermometer either.

Measuring precipitation using a manufactured rain gauge is no problem, but these can be expensive. In any case, many pupils prefer to make their own, but their design can lead to difficulties. Refer the pupils to Met Office guidelines on the correct size and conversion formulae (they are also in good textbooks). Pupils frequently use large plastic bottles, but both these and milk bottles may not be wide enough, so suggest a funnel is placed inside to make a wider opening – ideally it should be at least 125 mm in diameter. The collecting vessels should be designed to allow regular emptying and should be robust enough to withstand regular handling. If they split, leakage will occur and ruin the results. Pupils should be made aware of all these points and that even family pets can cause damage to the vessels.

With some of these projects, especially numbers 2, 4, 5, 6 and 8, pupils might want to consider the use of a control station. This can be used to spot sources of irregularities, and faulty equipment can be recalibrated. The school’s weather station or Stevenson screen is ideal for this. Having such a control will allow pupils to comment on their evaluation about having a real scientific method, and checking for sources of error in their observations.

If a standard household thermometer is being used, remember that it can take up to 15 minutes to settle and record the actual temperature at the site. When measuring wind speed, pupils should remember that gusts and lulls can occur. Holding up the anemometer for up to a minute or two can help to overcome this, and an average speed calculated for that period. If readings are being made alongside a busy road, the pupils should also remember that large vehicles can cause sudden gusts.

If there is no access to a good quality anemometer, you can buy ventimeters from sailing shops. These can give good readings.

1. How accurate are weather forecasts for my local area?

Equipment needed

A simple thermometer, anemometer (and compass?) and cloud recognition chart.

Pupil’s notes

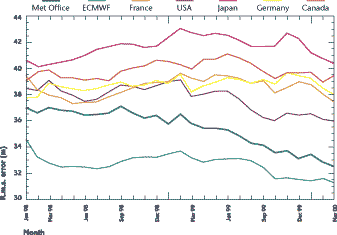
This project involves collecting weather data each day, for a 10- to 14-day period, and comparing your readings with forecasts in the local newspaper or on web sites. Around midday you should record the air temperature, weather conditions, cloud cover, cloud type, wind speed and wind direction. If you have an automatic weather station at your school, you can use these readings and make your own observations on clouds and weather conditions. You should keep the weather forecasts that have been made, compare them each day with your readings, and then work out how accurate the forecasts have been. At the end of the time period, you can work out the overall accuracy level, and then suggest reasons for any differences.
accuracy

Teacher’s notes

In essence, this is a very simple project, but one which able pupils can extend by explaining the discrepancies between observations and forecasts, e.g. fronts moving faster than expected, the impact of local topography and the shelter effect of hills.

2. A survey of how the temperature changes in my back garden

Equipment needed

At least two thermometers – one for ground temperatures, and the other for air temperatures at 1.2 metres above the ground (possibly on a post). An anemometer (and compass?) would also be useful.

Pupil’s notes

This is a detailed survey of how temperature changes in your garden. You need to collect data each day (or even twice a day) for a 10- to 14-day period, recording the air and ground temperatures. You could also make a note of cloud cover and wind speed/direction. Cloud cover will help you explain unusual changes, e.g. temperatures may drop if skies have been clear at night. Similarly, knowing wind speed and especially direction, will help you explain temperature changes in terms of the prevailing air mass. If you are only measuring data at one place, you should take care to avoid shaded areas of your garden. You could set up several measuring points and see how temperature varies around your back garden, and then draw a chloropleth or isoline map to show the differences and patterns. Having more than one collection point would also allow you to calculate a daily average for your garden. Another extension would be collecting data twice a day, e.g. at 8 a.m. and 6 p.m.

Teacher’s notes

Pupils should use maximum-minimum thermometers and a fairly sensitive anemometer, but great care is needed in resetting the thermometers. More able candidates could collect weather maps from a broadsheet newspaper or the images and charts from the Met Office web site, and then relate the temperature changes to the passage of frontal systems across the area. Dramatic temperature changes can also occur under a blocking anticyclone where temperature inversions and ground frosts regularly develop. Pupils should therefore be encouraged to take careful note of the cloud cover and whether a ground frost occurs.

3. An analysis of temperature patterns across a town/city

Equipment needed

A digital thermometer or probe.

Pupil’s notes

Temperature changes across an urban area, and this project involves looking at these subtle changes, caused by different types of buildings or open spaces. You should make a transect across the urban area (from north to south, or east to west) taking readings at regular intervals every 500 metres, or you can choose a variety of locations all over the urban area. Ideally, you should have 10-15 sites which you can visit on foot, by bike or in a parent’s car. At each site, you should record the air temperature, holding your digital thermometer at the same height above the ground at each site. You should also make a description of the site – densely built up, low-density housing with gardens, open space, etc. You should repeat your survey at the same time over the next two or three days. Remember, you are not really after an average for each site, but checking whether the temperature changes in the same way at each site at different times. You can extend this project by visiting each site early in the morning, around noon and in the late afternoon.

Teacher’s notes

Help may be needed in deciding on the choice of observation site and direction of transect. The timing of the transect is also an important consideration, as urban heat islands are often most sharply defined in the early evening. Also remember that strong winds can equalise differences, so suggest that calm days are chosen. A basic household thermometer, or maximum-minimum thermometer should not be used, unless of course it is left at each site – help from school friends and relatives is a possibility. Digital thermometers will be the most accurate. Pupils could also collect weather maps from a broadsheet newspaper or the images and charts from the Met Office web site. Dramatic temperature changes can occur under a high-pressure system with little cloud cover, so that temperature inversions develop. Pupils should therefore be encouraged to take careful note of the cloud cover at the time of their transect. Very interesting patterns can be found if the transect crosses the central business district or a river valley. If the survey is being undertaken in a small town or large village, this project could be extended using data-collection points in the rural areas, so that differences between urban and rural areas are noticeable.

4. How do wind patterns vary around a large building?

Equipment needed

A good anemometer (and compass?).

Pupil’s notes

Wind speeds and directions can vary dramatically around buildings, especially tall tower blocks, large sports stadia or public buildings such as cathedrals. The wind can increase and swirl in unusual eddies as the air passes over and around the obstructions. You should identify a number of sites – 10 or 12 would be ideal – and try to get an even coverage around the building. Visit each site in turn, making a note of the wind direction and speed. You should try to visit the sites on mornings and/or afternoons for several days (possibly for up to a week). Although you can take an average wind speed and average direction for each data collection, it is even more interesting to notice the changes around the building, and you could answer the following questions. Where are wind speeds above average, and below average? Are the strongest winds always in the same place? In addition, the wind direction readings might help you spot where eddies are strongest.
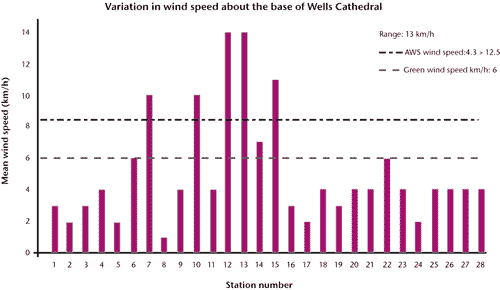
well graph

Teacher’s notes

The key to this project is having a sensitive enough and/or fairly sophisticated anemometer. Some of the basic ones will not adequately measure light breezes. Having said this, very good results can be obtained near tower blocks, and more able pupils might be able to study the venturi effects produced, or the problems these faster winds cause, e.g. blowing litter around and low-level pollution. This project is very effective in winter and spring when low-pressure systems cross the country. It can be less effective under high pressure, so if the pupils are making these surveys in the summer holidays they should be made aware of these difficulties. This will prevent the embarrassment of them returning to school in August or September saying that the project did not work, or that there were never any winds! Speeds should be recorded in metres per second rather than by the Beaufort scale.

5. How do temperatures vary inside and outside a woodland area?

Equipment needed

Several maximum-minimum thermometers. At each site, you will need one for ground temperatures, and another for air temperatures at 1.2 metres above the ground (possibly on a post). You could use a digital thermometer rather than use several maximum-minimum thermometers. You can also use a light meter (see pupil’s notes).

Pupil’s notes

Air and ground temperatures will vary inside and outside a wood because of the vegetation and shade. To see how these change, choose one area inside the wood, and another up to 100 or 200 metres away, well out of shade. You should measure ground and air temperatures at each site over a 10- to 14-day period. If you are using a maximum-minimum thermometer, just one visit a day will be needed, whereas a digital thermometer will need reading each day at about 8 a.m. and at 6 p.m. It would also be useful to record the weather patterns and cloud cover at the time of the readings, as this may help explain unusual patterns, e.g. low temperatures early in the morning under clear skies. If you are using a digital thermometer, you could make a transect across the wood, taking readings every 50 metres or so. The vegetation also filters the solar radiation so that light intensity changes inside a wood. This can be measured using a light intensity meter or the light meter on a camera – if the latter is chosen, set the aperture to f8 and point the camera at the same object each time (a clipboard will suffice). The shutter speed will give a surrogate measure of light intensity, as the faster the shutter speed, the greater the light intensity.

Teacher’s notes

In order to obtain decent results, a fairly large copse or wood should be chosen, and the pupil should check that they can gain access beforehand. Maximum-minimum thermometers are ideal, but if they are not available, a digital thermometer can be used to record ‘real-time’ temperatures. This will entail the pupil visiting the sites at roughly the same time each day over the period – again an important fact that they need to be aware of before starting. From experience, maximum-minimum thermometers give more flexibility. More able candidates could also collect weather maps from a broadsheet newspaper or the images and charts from the Met Office web site. These will help explain any dramatic temperature changes that might occur under a blocking anticyclone, where temperature inversions and ground frosts regularly develop. Pupils should therefore be encouraged to take careful note of the cloud cover and whether there is a ground frost when they make their observations. If the readings are being made in a large wood, it is a good idea to encourage pupils to choose a variety of sites within the wood. Another extension is to compare the measurements from a wooded area with a variety of non-woodland sites, e.g. back garden, at school or in a built-up area. This could also lead to a more detailed project on temperature differences between urban and rural areas.

6. How much precipitation is intercepted in a woodland area?

Equipment needed

A simple rain gauge or collecting device. A simple thermometer might also be used (see pupil’s notes).

Pupil’s notes

Trees intercept rainfall, so this project is a variation on Project 5, whereby you need to place a number of rain gauges in and outside a woodland. You should choose a number of sites inside the wood, and at least one up to 100 or 200 metres away, well out of any shade. You should then measure the amount of rainfall at each site over a 10- to 14-day period. You could make readings several times a day if there is heavy rain. If so, it might be useful to monitor the temperature as well as cloud cover and type – these readings will help you work out if the rain is associated with the passage of a warm or cold front, etc. If your school has an automatic weather station with an electronic rain gauge, you can use this to work out the approximate time of your storm, the intensity and its duration. This will all help you answer questions such as whether more or less interception takes place in longer or heavier storms.
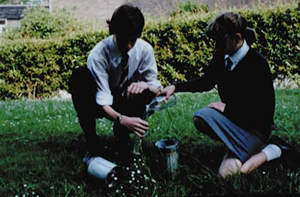
Kids rain gauge

Teacher’s notes

Potentially this can be a very good project, but problems can occur, chiefly with vandalism or the knocking over of the rain gauges. In addition, the summer months should be avoided as, in theory, there should be less rain! This is a good project at Easter or during the late spring when the trees are in leaf and there is a greater potential for interception. More-able pupils might nevertheless want to see how interception varies during the year, or in different seasons, and from experience, some very good projects have been undertaken on this topic. Another practical difficulty is that in very heavy storms, leaves are often battered down by the fast-falling raindrops. The best results are often obtained in steady rain.

7. How does the weather change as a depression/warm front/cold front passes over?

Equipment needed

Thermometers (preferably maximum-minimum), an anemometer (plus compass?), a cloud recognition chart and a barometer.

Pupil’s notes

Subtle changes occur in weather patterns as mature depressions move across Britain, especially with the passage of warm and cold fronts (plus occluded fronts), as well as the warm and cold sectors. You can observe these changes by setting up an observation station in your back garden or by using the school weather station or Stevenson screen. If you are making observations at home, take care to avoid shady areas in your back garden. To do this project effectively you should keep a close eye on weather charts in local or national newspapers, or the images on web sites, in order to see roughly when the depression and fronts will cross your home region. You will then need to carefully monitor the changes in air pressure, air temperatures, cloud cover, cloud type, wind speed, wind direction and weather conditions. Ideally, you should try to make recordings every two hours during a two- or even three-day period as the low-pressure system passes over. Satellite images and synoptic charts on the Met Office web site could be printed off to help explain the changes you observed in the weather patterns.
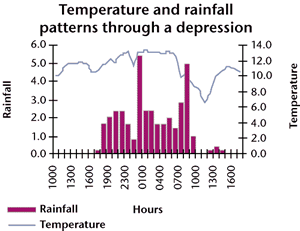
temp rain chart

Teacher’s notes

This is another project where data collection is quite straightforward, although accurate thermometers are needed, hence the preference for a digital one. Having said this, the regularity of making observations is crucial. Taking readings just twice or three times a day may not be sufficient. It is important that the pupils look at, and keep, the synoptic charts and weather maps from the broadsheets or web sites. More-able pupils should be able to see whether their changes fit the textbook models, and then explain any discrepancies. Another extension would be to add a rain gauge to measure precipitation as the fronts pass over. The regularity of data collection, every two hours, can be a difficulty, especially the night and early morning readings. Therefore, the data from the school’s automatic weather station can be substituted, with the pupils still collecting primary data by noting cloud cover, cloud type and weather conditions.

8. A study of the shelter effect of trees/hedges

Equipment needed

A digital thermometer or several thermometers, preferably maximum-minimum. At each site you will need two thermometers – one for ground temperatures, and the other for air temperatures at 1.2 metres above the ground (possibly on a post).

Pupil’s notes

Trees and hedges can have a shelter effect, causing temperatures, especially close to the ground, to change in a subtle way. For this project you should choose an area with woodland or one with thick, mature hedges. You could use your garden if it is quite large. Set up a line of evenly spaced measuring points where, if you are using maximum-minimum thermometers, you should place your measuring posts. Six or eight posts moving away from the hedge, or if possible on both sides of the hedge will be needed. Remember to ask permission to place these beforehand! If you are using a digital thermometer, place wooden pegs in the ground so you always measure at the same place. Take readings over a 10- to 14-day period at each observation post – if you are using a maximum- minimum thermometer, only one daily reading is needed, but if you are using a digital thermometer, you need to take readings around 8 a.m. and 6 p.m. It is also useful to make a note of cloud cover, as temperatures can fall very low under clear skies. Remember that it is the differences between air and ground temperatures at each site and as you move away from the obstacle, that are important, so take great care to read your thermometers accurately, and do not round up the temperatures on digital displays.

Teacher’s notes

This can be a really good project in a rural area or for pupils who live on farms. The choice of a back garden is adequate, as long as it is a good-sized one. If so, this could be combined with Project 2, to produce an isoline map of temperatures across a back garden, showing the shelter affect. More-able candidates could also collect weather maps from a broadsheet newspaper or the images and charts from the Met Office web site. These will help explain any dramatic temperature changes that might occur under a blocking anticyclone where temperature inversions and ground frosts regularly develop. Pupils should therefore be encouraged to take careful note of the cloud cover and whether there is a ground frost when they make their observations.

9. How do air temperatures change as you move up a hillside?

Equipment needed

A digital thermometer, while an anemometer and hygrometer are optional extras (see pupil’s notes).

Pupil’s notes

Air temperature decreases steadily as altitude increases, therefore a transect up a hillside or upland area can identify these changes. You will need 10-12 sites up the hillside, or along a main road. Ideally they should be at regular height intervals, so plot these beforehand using an Ordnance Survey map. Visit each site on foot, by bike, or in a parent’s car, and at each location accurately measure the air temperature, taking care not to round up the temperatures on the digital displays and trying to hold the digital thermometer at the same height above the ground at each location. You may find it useful to make a note of wind speeds and directions, because these may influence the changes, e.g. a cold down-valley wind. When you have finished, you can draw a scattergraph, showing the temperature changes, or thermal gradient, for your transect. You should repeat your transect several times, so that you can draw a series of thermal gradients, seeing whether the changes are always at the same rate between each site. It would also be worthwhile knowing the relative humidity for the area – this is because the amount of water vapour in the air can influence the rate of temperature change (ask your teacher to explain this!). So if you have access to a hygrometer it would be worth noting the readings. If not, use the information from your school’s automatic weather station or Stevenson screen. Some web sites also carry readings on relative humidity that you could use as well.

Teacher’s notes

This can be a very stimulating and interesting project, and a fruitful extension would be to measure temperatures on both the leeward and windward sides of the upland area. On the leeward slopes, a simple Föhn effect can sometimes be observed. It is essential that pupils do not round up the readings to whole degrees – going to two decimal places is a real bonus! More-able candidates should also be encouraged to gather the weather maps from a broadsheet newspaper or the images and charts from the Met Office web site for the days when they are making their transect. These will help explain any dramatic temperature changes that might occur under a blocking anticyclone where temperature inversions might affect the results, especially at the foot of the slope, so that for a while temperature increases with altitude. More-able pupils will also link humidity data with the lapse rates, and whether the saturated adiabatic lapse rate or the dry adiabatic lapse rate prevails.

10. How do temperatures change as one moves inland from the sea/coast?

Equipment needed

A digital thermometer and an anemometer (plus compass?).

Pupil’s notes

Air temperature changes as you move inland away from the sea, a large lake or reservoir. Water bodies can have a cooling effect in the summer months, and a warming effect in the winter. However, the patterns are influenced by the onshore or offshore breezes. This project requires a transect to be made inland away from the water body or coast. You will need 10-12 sites, possibly along a main road running away from the coast. Ideally they should be at regular height intervals, so plot these beforehand using an Ordnance Survey map. Visit each site on foot, by bike, or in a parent’s car, and at each location accurately measure the air temperature and the wind speed and direction. Take care not to round up the temperatures on the digital displays, and try to hold the digital thermometer and anemometer at the same height above the ground at each location. When you have finished, you can draw a scattergraph, showing the temperature changes, as well as a wind rose, for your transect. You should repeat your transect several times at roughly the same time of day, so that you can draw a series of thermal gradients, seeing whether the changes are always at the same rate between each site, and whether they differ depending on the type of breeze and its strength. Alternatively, you could repeat your transect several times a day to see the daily (diurnal) changes as the land or sea warms up and cools down.

Teacher’s notes

From experience, this is another good project for the summer months, or the mid-winter, and some very interesting patterns can occur under high pressure. Very good results can also be found if the transect is repeated at different times of the day, or year. It is important though for pupils to recognise the subtle differences between local breezes and the more-general prevailing winds – local breezes can create interesting small-scale patterns. Once again, pupils should be encouraged to gather the weather maps from a broadsheet newspaper or the images and charts from the Met Office web site for the days when they are making their transect. These will help to relate the micro-scale changes to the macro-scale patterns.

Web page reproduced with the kind permission of the Met Office
Key Stage 4 Geography Resources

Resources for 14-16 Year Old Students

Air Masses

Air masses and fronts – introductory text

Air Masses – an introduction to the major air masses affecting the UK

Case studies of UK air masses (November 2010, November 2011 and the end of September 2010) with answers for teachers and a case study of arctic maritime air (Jan/ Feb 2015) can be found on our case studies page.

Air Masses – worksheet and the Met Office’s air mass video .

AWS data to study air masses and depressions (adapted from LGfL)

Past Climate Change

Resources to teach the climate of the last 2.6 million years.

Climate negotiations resource:

climate negotiations trailer

https://www.youtube.com/watch?v=Cn-ZqGJxpk4&amp

Rainfall

A case study of orographic rainfall in Scotland with images for students Image 1, Image 2Image 3Image 4Image 5.

Weather Systems and Synoptic Charts

Mid-latitude weather systems

An introduction to weather systems

Anticyclones, depressions and fronts

Understanding weather charts – excercises

Weather systems plenary, revision or homework exercise – an investigation into why the forecast showed the temperature rising at night.

What is the weather? Work out what the weather is like at several UK locations based on some simplified weather maps.

Isotherm and Isobar drawing exercise based on a depression: student worksheet. A simpler version of the T/ isotherm map can be found here or the full version including solutions may be found on the A level page.

Using WOW data to investigate a depression passing across the UK with worksheets for students

Use WOW data to track a cold front across the UK and work out its speed.

Weather Maps – basic information on synoptic charts, with Isotherm map excercise and Synoptic chart excercise.

We’ve pulled together some resources about ex-hurricane Ophelia, bringing together information about tropical cyclones, depressions, anticyclones and air masses to explore the extremely unusual weather we experienced in October 2017  Ophelia.pptx.

Shipping forecast

Tropical Weather

Using GIS to study hurricane tracks and tropical storm risk (developed by Bob Lang, teacher and GA consultant)

Some useful links about Super typhoon Haiyan/ Yolanda

Monsoons

Other Weather

Microclimates

Urban Heat Island Fieldwork and a simple and effective lesson plan which uses WOW data to identify Urban Heat Islands. The supporting PowerPoint presentations can be found here.

Weather Project Ideas

Clouds

Atmosphere

Satellites

Thunderstorms

UK climate

Other recommended resources:

A wide range of animations from the Met Office suitable for geography and science topics.

Resources looking at change of state, latent heat, data handling and the Electromagnetic Spectrum from the NCAS/ DIAMET project (scroll down to the bottom of the page).

An excellent resource (first published by the GA) investigating weather conditions needed for the various Olympic sporting events using weather station or WOW data.

AS/ A level Resources

Key Stage 3 Resources

19. Urban Climates

Weather and Climate: a Teachers’ Guide

Pathway: Extending Weather

Anticyclones – Depressions – Microclimates – Urban Climates

Lesson overview: In this lesson we look at how urban areas have an impact on temperature, wind, air quality and precipitation.  

Even a single building can have an impact on its surrounding microclimate.  The larger the built-up area, the greater its potential influence on the microclimate of it and its surrounding area.  The physical properties of urban areas – their structure, the materials they are made from and the relative lack of vegetation create a localised climate with unique characteristics. Urban areas can influence temperature, wind speed and direction, air quality, precipitation and humidity.  As the climate changes, urban microclimates can be managed to keep towns and cities as cool as possible and to improve air quality. Temperature differences between urban and rural areas are greatest during the night and when there is little wind. 

Learning objectives:

  • To understand how urban areas affect temperature, wind and precipitation levels.

  • To be able to explain why urban areas affect temperature, wind and precipitation levels.

  • To create a plan to combat urban climate effects.

Key Teaching Resources

Urban Climates PowerPoint
Urban Climates PowerPoint (easier)
Urban Climates PowerPoint (with harder isoline exercise)
Urban Climates worksheet
Urban Climates worksheet (easier)
Urban Climates worksheet (harder)

Teacher CPD/ Extended Reading

Urban Climates_More for Teachers

Alternative or Extension Resources

 Assessment resource and mark scheme (covering several topics)

More Urban Heat Island information and teaching resources, and fieldwork resources for measuring UHIs

Data skills resource looking at the impact of climate change on urban areas (advanced)

Weather and Climate: a Teachers’ Guide

18. Microclimates

Weather and Climate: a Teachers’ Guide

Pathway: Extending Weather

Hot DesertsAnticyclones – Depressions – Microclimates

Lesson overview: In this lesson we investigate the factors which can help create a microclimate and introduce fieldwork opportunities within the school grounds.

A microclimate exists when the climate in a small area is sufficiently different to the climate in the larger area around it as to be distinct.  Some microclimates are very localised, whereas others are found across relatively large areas, such as forests, coasts and upland areas.  Human modification of the Earth’s surface can have unintended consequences on microclimates, but also offers tools to mitigate the effects of climate change and for active management to deliver improved food production, landscape resilience and ecosystem services. Microclimate fieldwork is easily accessible to all.

Learning objectives:

  • To understand that climate can vary over short distances.

  • To be able to define what a microclimate is.

  • To be able to explain how six major factors can contribute to the microclimate of an area.

Key Teaching Resources

About Microclimates PowerPoint
Microclimates Worksheet
Microclimates Homework
Microclimates – easier mindmap

Fieldwork Resources

Microclimates Fieldwork
Microclimates Fieldwork – example data sheet
Microclimates Fieldwork – data collection sheet
Microclimates Fieldwork – checklist
Microclimates Fieldwork – Graph analysis worksheet
Microclimates Fieldwork – Marking sheet

Teacher CPD/ Extended Reading

Microclimates – More for Teachers

Alternative or Extension Resources

Fieldwork in Geography

Using USB temperature dataloggers to investigate school microclimate

Investigating the location of official weather stations

Where would you put…?  a resource using streetmap to interrogate the microclimate of a National Trust park. 

Predict the microclimate graph

Year 7 Weather and climate revision placemat (with thanks to Cool Geography/ Rob Gamesby)

Weather and Climate: a Teachers’ Guide