Some ideas, data sources and guidance for students wishing to include weather measurements in their NEA or EPQ.
Updated November 2022
A guide to collecting weather data
https://www.rgs.org/CMSPages/GetFile.aspx?nodeguid=59f46632-ae51-4ea7-ab94-a0c537eb3c71&lang=en-GB
Passage of a depression
https://www.metlink.org/wp-content/uploads/2020/12/depression_wow_teacher_Eva.pdf
Data source:
Weather and Health/ Behaviour
- Classroom behaviour (https://www.metlink.org/resource/classroom-behaviour-and-the-weather/)
- Use of inhalers in schools
- Number of people off school with illness
- https://www.metlink.org/wp-content/uploads/2020/11/Effect-of-Climate-Variability-on-School-Attendance.pdf
- https://journals.lww.com/epidem/Fulltext/2017/03000/Traffic_related_Air_Pollution_and_Attention_in.5.aspx
Data source: http://wow.metoffice.gov.uk
Urban Climates
Using Wow data to look at urban heat islands https://www.metlink.org/resource/using-wow-to-illustrate-the-urban-heat-island-effect/
Urban winds: fieldwork guidance can be found on https://www.metlink.org/fieldwork-resource/fieldwork-in-geography/
Urban temperature https://www.metlink.org/fieldwork-resource/urban-heat-island-introduction/
Data source: http://wow.metoffice.gov.uk
Community resilience to extreme weather
- Extreme weather memories. http://talkingjobs.net/modules/wmb/?ref=nm
- Tempest data base https://www.nottingham.ac.uk/geography/extreme-weather/search/
- Data source: http://www.metoffice.gov.uk/public/weather/climate/gcqrqyr80
Local microclimate
https://www.metlink.org/fieldwork-resource/using-usb-temperature-dataloggers/
https://www.rgs.org/schools/teaching-resources/quick-and-easy-ideas/
Data source: http://wow.metoffice.gov.uk
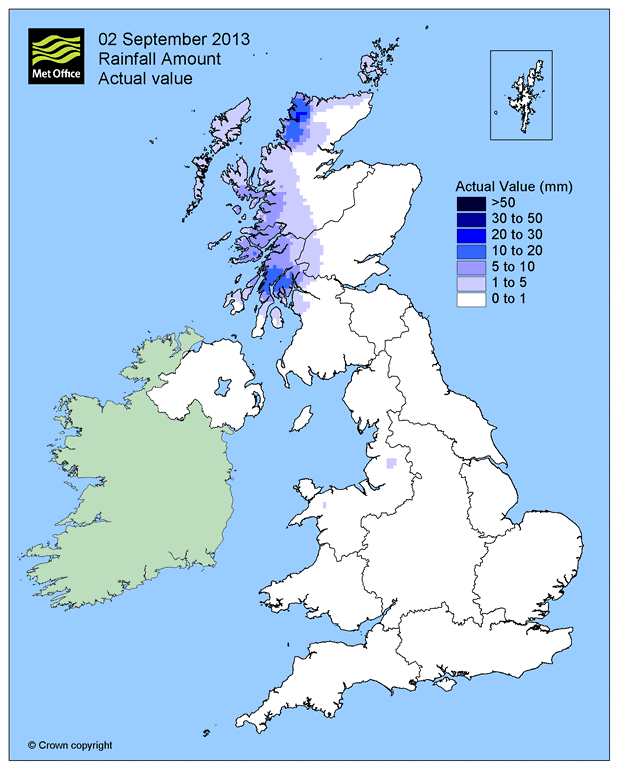
Factors affecting rainfall:
https://www.manchester.ac.uk/discover/news/tuesday-wettest-day-of-week-suggests-new-analysis/
https://rmets.onlinelibrary.wiley.com/doi/10.1002/joc.2321
Orographic rainfall https://www.metlink.org/resource/orographic-relief-rainfall-and-the-foehn-effect/
Red Sky at Night
https://www.metlink.org/resource/red-sky-teachers/ with an introductory concept cartoon from the ASE
https://www.metlink.org/blog/folklore/weather-folklore/
Snow
https://www.metlink.org/blog/extreme-weather/when-will-it-snow/
Sky Colour
https://www.exploringoverland.com/constantapprentice/2021/8/10/making-a-cyanometer-to-measure-sky-moisture-through-color with https://uk-air.defra.gov.uk/interactive-map pollution forecast and pollen forecast http://www.metoffice.gov.uk/health/public/pollen-forecast
Weather and Flooding
Data source: National River Flow Archive http://nrfa.ceh.ac.uk/ and https://environment.data.gov.uk/hydrology/index.html#/landing
Sea level
http://www.coolgeography.co.uk/GCSE/AQA/Coastal%20Zone/Sea%20level%20rise/Sea%20level%20rise.htm
Land and Sea breezes, sea breeze front
Data source: http://wow.metoffice.gov.uk
Air Masses
https://earth.nullschool.net/
http://www1.wetter3.de/Archiv/archiv_ukmet.html
various links on https://www.metlink.org/teaching-resources/?_sft_topic=air-masses
including https://www.metlink.org/resource/pressure-and-rainfall/
Data source: http://wow.metoffice.gov.uk
General resources
https://www.metlink.org/fieldwork-resource/instruments-and-fieldwork/
https://www.rgs.org/schools/teaching-resources/key-stage-five/extreme-weather/
https://www.metlink.org/fieldwork/
https://www.rgs.org/schools/teaching-resources/a-student-guide-to-the-a-level-independent-investi/
https://www.field-studies-council.org/resources/16-18-geography/route-to-enquiry/


