Investigating the Link Between Between Pressure and Rainfall
Here is some data collected by a weather station on the outskirts of Edinburgh, at the start of 2019.
Date | Atmospheric Pressure (hPa) | Rainfall (mm) |
10/12/2018 | 1025 | 0.0 |
11/12/2018 | 1020 | 0.0 |
12/12/2018 | 1019 | 0.0 |
13/12/2018 | 1022 | 0.0 |
14/12/2018 | 1017 | 0.0 |
15/12/2018 | 988 | 1.0 |
16/12/2018 | 1005 | 5.1 |
17/12/2018 | 1005 | 0.3 |
18/12/2018 | 996 | 1.5 |
19/12/2018 | 995 | 0.3 |
20/12/2018 | 995 | 0.5 |
21/12/2018 | 1000 | 0.5 |
22/12/2018 | 1014 | 0.0 |
23/12/2018 | 1027 | 0.0 |
24/12/2018 | 1032 | 0.3 |
25/12/2018 | 1026 | 0.3 |
26/12/2018 | 1023 | 0.0 |
27/12/2018 | 1023 | 0.0 |
28/12/2018 | 1022 | 0.0 |
29/12/2018 | 1030 | 2.3 |
30/12/2018 | 1030 | 0.3 |
31/12/2018 | 1026 | 0.0 |
01/01/2019 | 1044 | 0.0 |
02/01/2019 | 1043 | 0.0 |
03/01/2019 | 1041 | 0.0 |
04/01/2019 | 1039 | 0.0 |
05/01/2019 | 1034 | 0.0 |
06/01/2019 | 1031 | 1.0 |
07/01/2019 | 1024 | 0.0 |
08/01/2019 | 1033 | 0.0 |
09/01/2019 | 1031 | 0.0 |
Using this data, draw a graph of rainfall against pressure.
Now use this information to complete the following sentences:
The most it rained in one day was _______________mm.
It didn’t rain at all on ____________ days.
The highest pressure recorded was ______________hPa (a hPa is the same as a millibar).
The lowest pressure recorded was _______________hPa.
Does it always rain when the pressure is low? Use figures to justify your answer.
____________________________________________________________________________________________________________________________________________________________________________________________________________________________________________________________________________________________________________________________________________________________________________________________
Does it ever rain when the pressure is high? Use figures to justify your answer.
____________________________________________________________________________________________________________________________________________________________________________________________________________________________________________________________________________________________________________________________________________________________________________________________
Many weather apps assume that if the pressure is low, it will rain. Does your graph justify this assumption?
_____________________________________________________________________________________________________________________________________________________________________________________________________________________________________________________________________________________________
Extension:
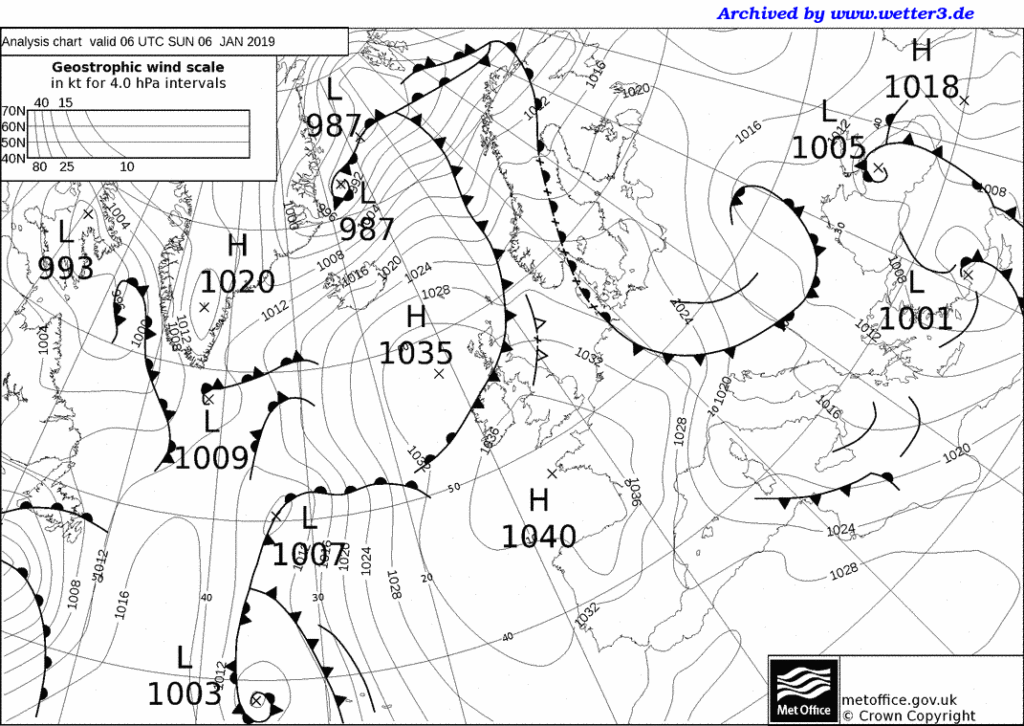
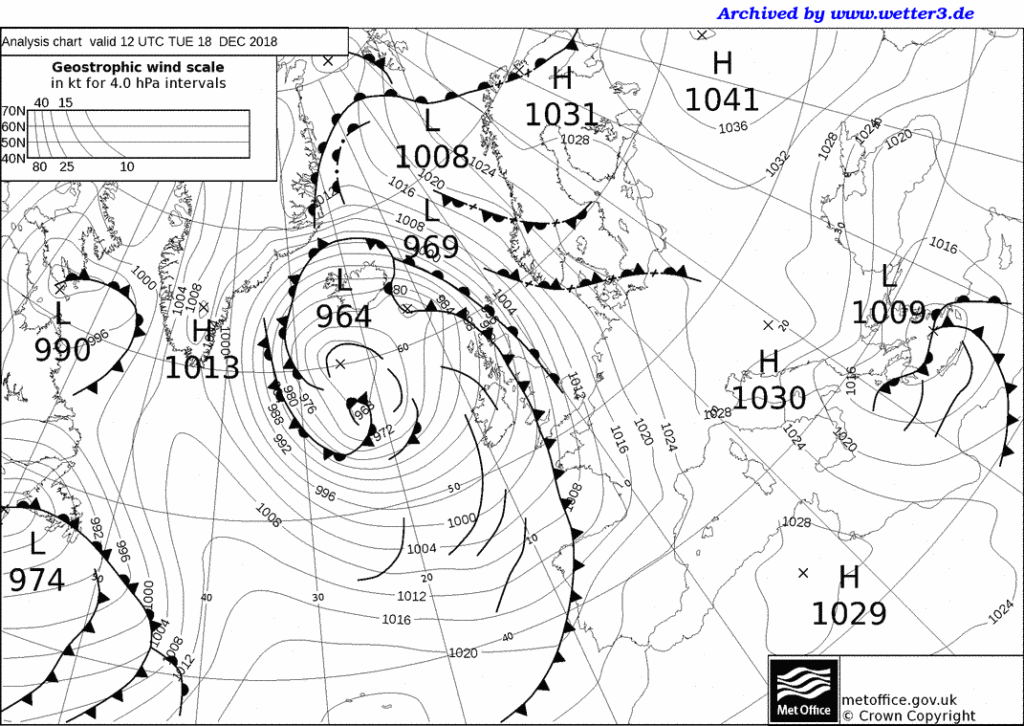
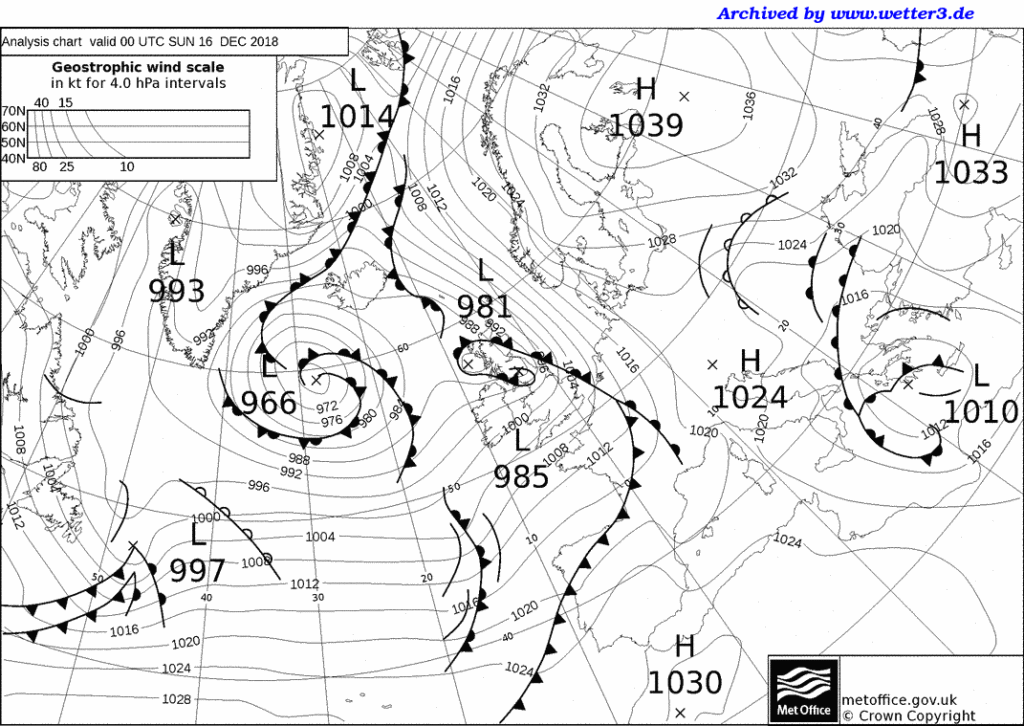
Here are the weather maps for 4 of the days when it rained: the first 3 show when the pressure was low and the 4th shows when the pressure was high and it rained.
1)
2)
3)
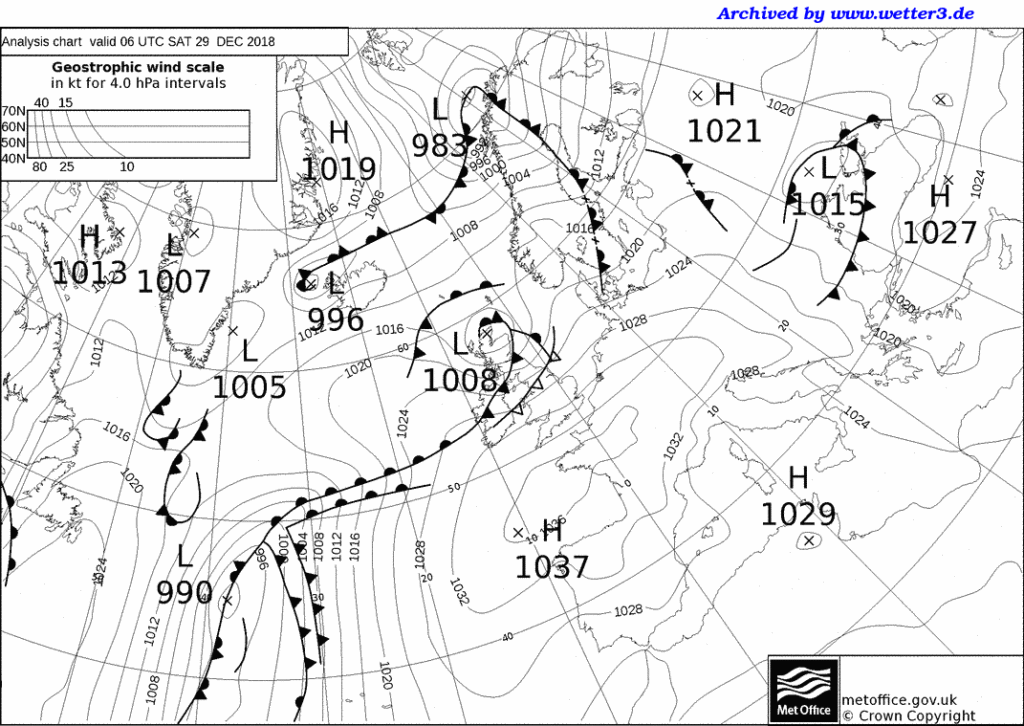
4)