Home » Fieldwork » Using USB Temperature Dataloggers

Using USB Temperature Dataloggers

Facebook
Twitter
Pinterest
Print

Exploring the microclimate of a school

The investigation of small-scale climates around schools and field centres has long been a popular project. USB temperature loggers make this project very easy to undertake with a high probability of success. Microclimates are most pronounced at night, especially on clear nights when an open area can cool several degrees below a more sheltered courtyard, for example. But using pupils to measure night-time temperatures is impossible at most schools; loggers can be left out for several days and do this easily.

usb temperature datalogger
The USB temperature logger
temperature datalogger in pot
Protected by a yogurt pot and pinned down

The Mindsets USB temperature logger looks like a USB memory stick, but actually contains a temperature sensor, a clock and a data logger.  It can store over 8000 measurements of temperature, enabling it to sample every 5 minutes for 27 days. When plugged into a PC, the data is immediately displayed as a graph. Inserting two or more loggers in succession allows the data from all of them to be plotted on the same graph in different colours with a key.

temperature graph
Graph produced by the Mindsets software when five loggers at different locations are downloaded

How to carry out the microclimate investigation

  1. To read the USB logger you will need to download the programme on to your PC. Google the following: Mindsets 161-357 which takes you to the website for the product, click on the Downloads tab at the bottom and then on Mini Datalogger Software. Follow the instructions to install – it is very quick.
  2. Before using the loggers in the field, it is worth familiarising yourself with how to use them; most of it is pretty intuitive, but worth a quick run through here. Open the Mindsets programme on the PC and plug one of the loggers into a USB port. Click on Add data and enter the number of the logger when it prompts you for a Name, then hit OK. A labelled plot of the temperature history of the last 28 days (including when it was in transit to you) will appear. Remove and repeat with another logger, which will show a second plot – which will be similar because they have been transported together, of course.
  3. Delete this old data from each of the loggers in turn to avoid it confusing the analysis of data you are about to collect – see Note 3 at the end.
  4. Take each USB logger and put it in a small yogurt pot (supplied in the kit), press down the lid tightly to exclude rain and dew, and label the pot with the number of the logger.
  5. Next, choose a number of locations around the school which have different amounts of shelter. The most open might be the middle of a sports field; the most enclosed might be a non-roofed central courtyard, for example. In between these, in terms of shelter, might be under a large tree, on a tennis court, on a flower border next to a wall, etc.
  6. Take the loggers to the chosen locations, make a note of which one goes where, and also label each pot with the location (e.g. “under tree”). At each location, pin them down securely with a couple of wire hoops (made from a coat hanger – one is supplied in the kit as an example); this will stop animals walking off with them. If there is no soil to pin them down into, put wire round the pot and pin the wire down with a brick. It is worth telling other people in the school (e.g. groundsman) so that they don’t just pick them up as litter.
  7. After number of days, ideally when there has been at least one good clear night, bring back the loggers. As before, open the Mindsets programme on the PC and plug the first logger into the USB port. Click on Add data and enter the location of the logger when prompted for a Name, then hit OK; a labelled graph of the temperature history will appear. Remove and repeat with the other loggers, until you have built up a graph with several different coloured labelled plots – see example above. Click on File at the top LH corner, then on Save plot as Image and give the plot a meaningful name, e.g. Temps up to 02 Apr 2014 (if you want, you can also save the temperature data for use later in an Excel spreadsheet by going to File and then Export data to CSV file)
  8. Look in the temperature plot for the night when temperatures are lowest – this will almost certainly be a clear night – and read off the minimum temperatures for each of the locations. Plot the temperatures on a plan or Google Earth photo of the school – see the example below.
  9. Look for a warm night on the graph – this will almost certainly be a cloudy night. Read off the minimum temperatures on this night. Again, plot them on a Google Earth photo of the school.
  10. Discuss the reasons why minimum temperatures are different at different locations and different on cloudy and clear nights. See the page on “What can we learn?”  
temperature graph
The same graph as above, annotated to show some important features of the temperature record.
school microclimate
Minimum temperatures around a school on the night of 22/23 Dec 2013, read off from the graph above. This shows over 8⁰C difference between an open but roofed area and the rugby pitch, with other temperatures in between.

What can we learn from the observations?

When the sun shines, it warms up the ground, which in turn warms the air around us, which is why it is warmer by day than by night. But all the time, heat (in the form of invisible infra-red radiation) is being given off by the surface of the ground, and this cools the surface, and hence the air. At night, when there is no sun to warm us, temperatures will fall throughout the night and reach a minimum in the early morning.

The amount of heat given off by the ground will depend on its location. Open ground will radiate to the sky everywhere, so lots of heat will be lost, and the temperature will fall.  At a well sheltered location, for example in a courtyard, much of the heat that escapes from the ground “bounces back” off the walls of the courtyard, so the cooling will be much less rapid. In between these two extremes, for example at the base of a wall which is open to only half the sky, temperatures will fall less rapidly than in the open, but less than when completely enclosed.

If the night is clear, the heat emitted from the ground can escape freely to outer space, so open ground will cool down rapidly. There will be a big difference between the temperature measured by a logger left out in the open, compared to one in a more sheltered location.

If the night is cloudy, much of the heat emitted by the ground will be reflected back by the clouds, so the temperature will not fall as much.  So on a cloudy night, differences between the very open site and the very sheltered one will be much less, because clouds are sheltering all the locations.

microclimate building
On a clear night in an open area (left) heat (in the form of infra-red radiation) from the ground can radiate out to the whole sky, so the ground will cool rapidly. But at a location next to a wall (right), the wall reflects half the heat back and stops it from being radiated to the sky, so the ground will cool less rapidly.

Notes

  1. Of course, the loggers continue to measure during the day as well as the night, but when sunshine falls on them it heats them up to above the air temperature, so the data will be in error. Some loggers in the graph above show spikes on 22 Dec 2013 where sun has affected the reading. The simplest thing to do is to just ignore all readings between sunrise and sunset – we only need data when it is dark.
  2. There is probably less chance of the loggers being interfered with if this investigation is done over the weekend, i.e. leaving loggers out on a Friday afternoon, and retrieving them first thing Monday morning.
  3. Having old data in the loggers will make plotting an analysing new data much more difficult, so erase the old data from each logger. Again, it’s pretty intuitive. Plug one in and click on the Erase data button to get rid of the old data. Then click on the Configure button, which gives the popup shown below, and set the loggers to sample every 5 minutes and click OK. Also click on OK in the next popup that says Changing setting will erase data. Do not alter anything in the other boxes. Repeat with the other loggers.
temperature datalogger

Start exploring

Latest from blog

Related posts

The instrument used for measuring wind direction is called a wind vane.
Topics: Instruments
Make your own Hygrometer 
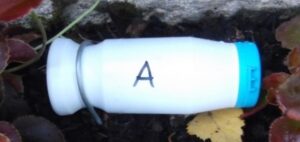
Wet and Dry Bulb Thermometers measure relative humidity Equipment: Clean, empty 1 pint milk/soup CARTON
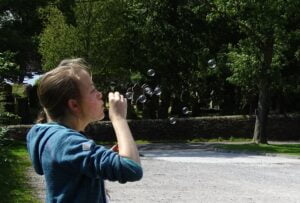
Topics: Instruments
Automatic Weather Stations An automatic weather station usually consists of a number of outdoor weather sensors which communicate with a display unit indoors, which
Topics: Instruments, Observations and Data
Introduction Project ideas: 1. How accurate are weather forecasts for my local area?2. A survey of how the temperature changes in my back garden3.