Drawing Pressure and Temperature Contours (Intermediate)

Drawing Temperature and Pressure Contours

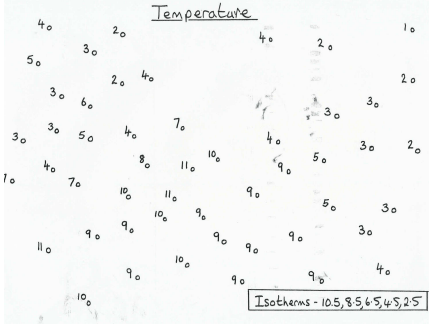
Lines of equal temperature – temperature contours, are called isotherms.

In this exercise, the task is to draw the 8.5°C, 6.5°C and 2.5°C isotherms. The 10.5°C and 4.5°C isotherms have already been drawn to help.

Start with the 8.5°C isotherm. This is the line which has everything warmer than 8.5°C on one side of it, and everything colder than 8.5°C on the other side. You could use a coloured pencil to colour in the dots for everywhere that is warmer than 8.5°C. Your isotherm is then the line which separates your coloured dots from the uncoloured ones.

Next, try the 2.5°C isotherm. For this, you could use a different colour to shade the dots for everywhere that is colder than 2.5°C.

Lastly, draw the 6.5°C isotherm. This will be very close to the 4.5°C isotherm in places, so be careful! To help with this, you could use a 3rd colour to shade the places where the temperature is 7 or 8°C, and a 4th colour to shade the places where the temperature is 5 or 6°C. Your line will divide the two.

Remember, contours can never touch or cross each other (it can’t be 8.5°C and 6.5°C at the same place!). The line should start and finish at an edge of the page.

Drawing of isotherms

Lines of equal pressure – pressure contours, are called isobars.

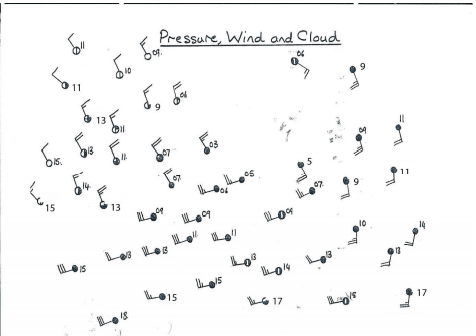
In this exercise, the task is to draw the 1016, 1012, 1008 and 1004mb isobars. However, to save space on the map, the pressure values have been recorded in shorthand – so 9 or 09 is short for 1009, 11 is short for 1011 etc.

On this map, we have some extra clues – these weather observations indicate the wind speed by the tail on the symbol. The wind is blowing from the tail of the arrow to the centre (the bars on the tail of the arrow tell you the wind speed) so –o is a wind blowing from the west to the east, or o—is a wind blowing from the east to the west. The wind tends to blow along the pressure contours, so your contours need to be roughly parallel to the tails on the closest weather symbols.

Start with the 1016mb contour. Where on the map are there places where the pressure is higher than that? If it helps, colour in those symbols where the value is greater than 16. Your pressure contour needs to divide those symbols from the others.

Now use a different colour to shade the symbols where the pressure value is 13, 14 or 15. Can you now draw the 1012mb isobar?

Again, use a different colour to shade the symbols where the pressure value is 9, 10 or 11. Can you now draw the 1008mbar contour?

Lastly, is there anywhere where the pressure is under 1004mb? If so, draw the 1004mb contour to separate off that observation from the others.
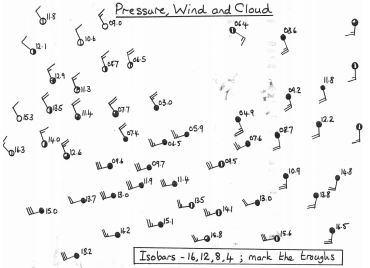
Drawing of isobars

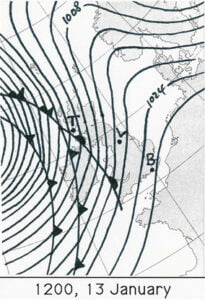
These two maps both correspond to the same weather situation. Can you work out what is going on?

Clues:

– Where is the pressure lowest?

– How is the wind direction changing across the map?

– In general, where is the temperature lower and where is it higher?

– Where is the temperature changing most rapidly? Remember that a front is where cold and warm air meets. You can use the wind information on the second map to see where the cold air is pushing into the warm air (a cold front) or whether the warm air is pushing into cold air (a warm front).

Drawing Pressure and Temperature Contours (Harder)

Drawing Isobars

Isobars are lines of constant pressure. Drawing the isobars reveals features (eg highs, lows, ridges and troughs) which help us understand the weather.

When trying to draw isobars, remember the following

– You are trying to draw the isobars of pressure for the values below the
graph

– The symbols on the map give the observed pressure and wind speed and
direction. Remember that the wind is blowing from the tail of the arrow
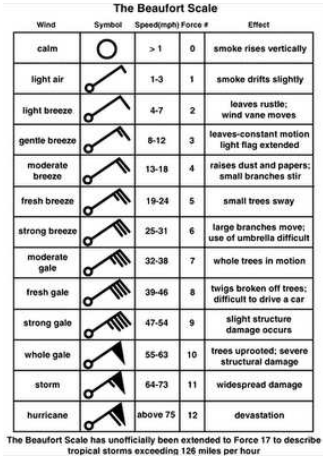
to the centre. The bars on the tail of the arrow tell you the wind speed:

– The wind blows almost parallel to the isobars (they are usually blow
slightly more towards the centre of the low pressure area). If you stand
with your back to the wind in the northern hemisphere the pressure is
lower on your left than on your right.

– Isobars tend to be parallel to each other, don’t wiggle and never cross.

– The closer the isobars are to each other, the stronger the wind. You can
use the bars on the tail of the weather station symbol to give you the
Beaufort force of the wind. Look at the scale at the top of the map (this is
called the ‘geostrophic scale’). The distance from the left hand edge of
the scale to the force at the symbol gives you the spacing between 2mbar
isobars at that point.

Beaufort scale

Draw the 1004, 1008, 1012 and 1016 isobars (noting that they have been recorded in shorthand, such that 1004 becomes 04 etc.) remembering that the wind tends to blow parallel to the isobars. Can they see what sort of a weather system it is, and where the fronts might be?

Drawing of isobars

Draw the 2.5, 4.5, 6.5, 8.5 and 10.5 isotherms (lines of equal temperature), remembering that sometimes, if there isn’t any data in a particular place, you have to make an educated guess about what the contour might look like. Is it more obvious now what the structure of the weather system is?

Drawing of isotherms

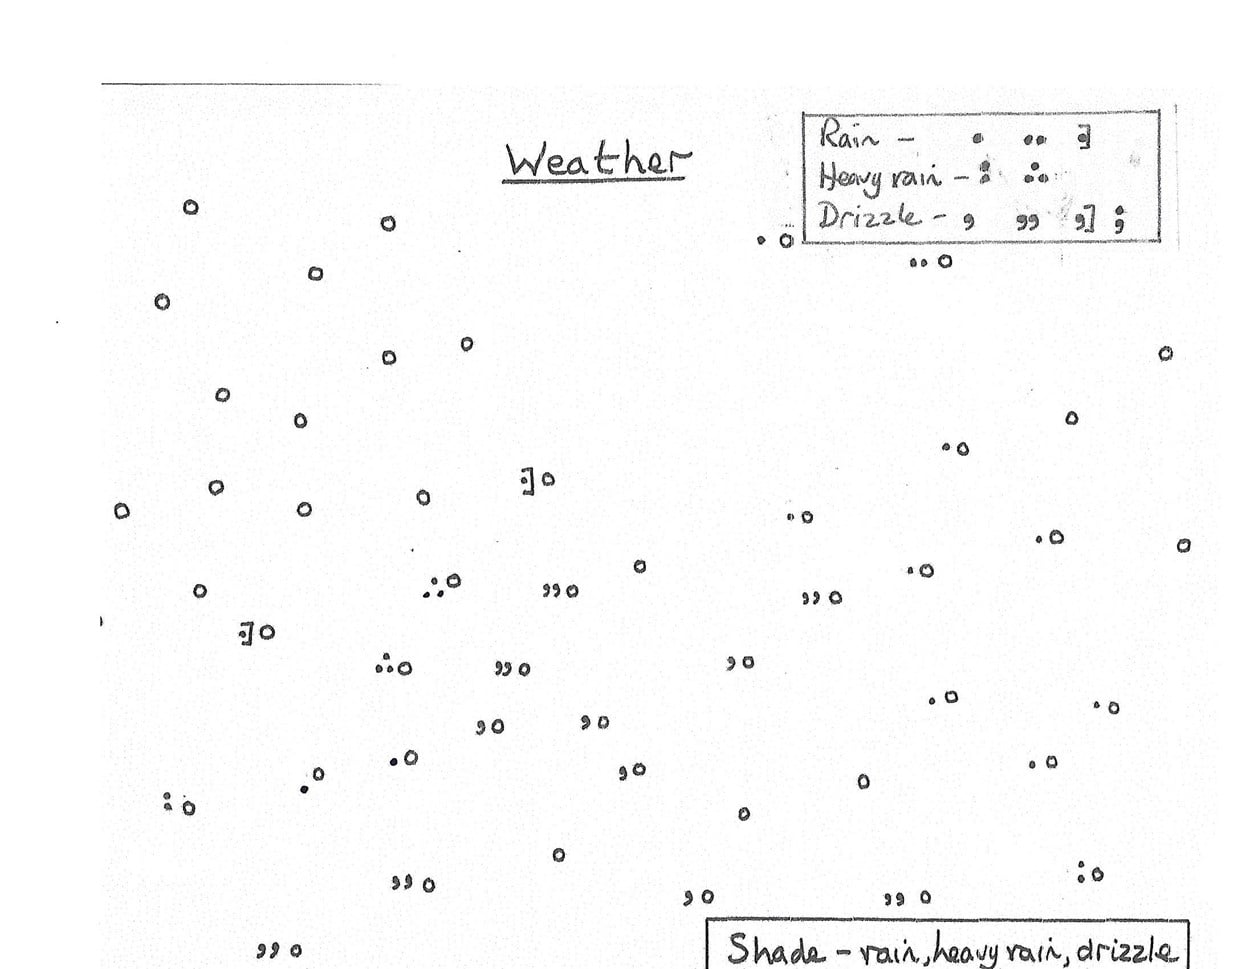
Shade the areas of rain, heavy rain and drizzle in the map below. Is it more obvious now what the structure of the weather system is?Weather map

8. Pressure and Wind

Weather and Climate: a Teachers’ Guide

Pathway: Basic weather 

Atmospheric and Oceanic Circulation – Climate ZonesAir Masses Pressure and Wind

Lesson overview: In this lesson we introduce air pressure, how differences in pressure can lead to air motion (wind) and how rising and sinking air can lead to low and high pressure respectively. We also introduce the Coriolis Effect and demonstrate how it can lead to rotating weather systems.

The action of the global atmospheric circulation cells, incoming and outgoing heat energy and the influence of upper-atmosphere winds creates areas of ‘high’ and ‘low’ pressure across the world – places where there is more or less atmosphere above the surface of the Earth.  Air is constantly pulled from areas of high pressure towards areas of low pressure, being deflected by the Coriolis effect as it does so, to create winds that circle around High/ Low pressure systems.  Pressure is shown on synoptic weather maps using isobars – lines of equal pressure – and winds blow approximately along these lines. 

Learning objectives:

  • To understand that air has a mass and exerts a pressure.

  • To contrast high and low pressure.

  • To be able to explain why winds are created and the factors that affect the wind.

  • To be able to interpret weather charts

Key Teaching Resources

Pressure and Wind PowerPoint
Pressure and Wind PowerPoint (easier)
Pressure and Wind Worksheet
Pressure and Wind Worksheet (easier)

Teacher CPD/ Extended Reading

Read

Pressure and Wind – More for Teachers

Or watch

Alternative or Extension Resources

Skills exercise – UK synoptic chart

Investigating the link between pressure and rain

Weather and Climate: a Teachers’ Guide

7. Air Masses

Weather and Climate: a Teachers’ Guide

Pathway: Basic weather 

 Weather and Climate – Atmospheric and Oceanic Circulation – Climate ZonesAir Masses

Lesson overviewIn this lesson we investigate
the characteristics of the major air masses which can affect the British Isles
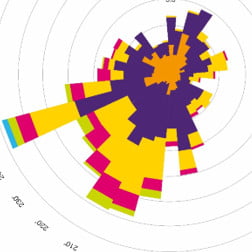
and introduce wind roses to investigate common wind directions and associated
air masses. 

Air masses are large volumes of air that have relatively uniform characteristics and can extend over hundreds of miles.  Classified according to the region in which they formed and the path they take to reach us, air masses strongly influence the weather we experience in the UK.  Air masses that affect the UK are predominantly Polar maritime and Tropical maritime but also Polar continental, Tropical continental and Arctic maritime.  The source regions of air masses are the high pressure regions associated with the Global Atmospheric Circulation. One air mass brings different weather to different parts of the country, for instance warming as they travel southwards, or drying out as they progress over land.  The temperature and humidity characteristics of air masses will change with climate change.

Learning objectives:

  • To be able to describe the five major air masses that affect the UK.

  • To be able to draw and interpret a wind-rose diagram.

  • To be able to describe and explain the weather associated with different air masses and how they affect day-to-day life in the UK.

Key Teaching Resources

Air Masses PowerPoint
Air Masses PowerPoint (easier)
Air Masses Information Sheet
Wind Rose
Air Masses Table
Air Masses Table (easier)

Teacher CPD/ Extended Reading

Read

Air Masses – More for Teachers

Or watch

A Blog post with simple animations also in the context of a short explainer YouTube video

Alternative or Extension Resources

Air Masses – a Human Board Game

Air Masses Taboo

Air Masses – identifying case studies on Synoptic charts (advanced)

Weather and Climate: a Teachers’ Guide

What is the Weather

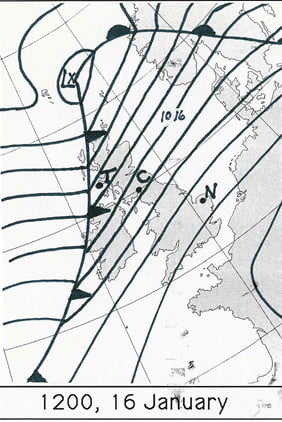
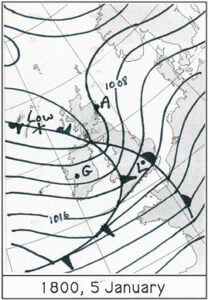
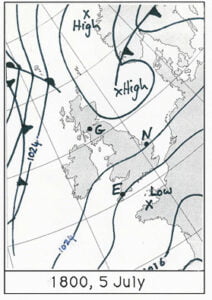
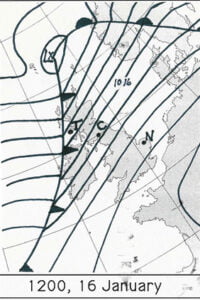
For each location marked on each map, what do you expect the weather to be doing? Think about whether it is windy, what the wind direction is, whether it is raining and whether it is warmer or colder.


weather map

Galway __________________________________________________________________

Aberdeen __________________________________________________________________

London __________________________________________________________________

weather map

Glasgow __________________________________________________________________

Norwich __________________________________________________________________

Exeter __________________________________________________________________

weather map

Tiree __________________________________________________________________

Carlisle __________________________________________________________________

Norwich __________________________________________________________________

weather map

Tiree __________________________________________________________________

Leeds __________________________________________________________________

Brighton __________________________________________________________________

Eva – A Case Study of a Depression

A Case Study of a Weather System using WOW data

Go to the WOW website wow.metoffice.gov.uk

Use the pop up calendar to select 24th December 2015 and the drop down box to choose 0600 to 0659 in the morning.

Use the Layers menu on the right to select wind speed/ direction.

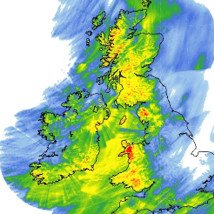
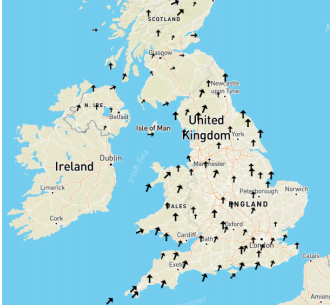
Use the Filters menu to select only official observations.Map of the UK showing wind direction

Where is the wind coming from?

Is the wind weak or strong?

Change the time to 0800-0859. How does the wind look now?

Change the time to 1200-1259. How does the wind look now?

Capture the image, stick it into a work book

NOW USE THE LAYERS MENU TO LOOK AT TEMPERATURE.

At 0600-0659, what are the temperatures across the U.K.? (You may need to click on some dots to work out exactly what the temperature is)

Capture the image, stick it into a work book at draw a line roughly dividing colder and warmer temperatures. What is a line dividing cold and warm temperatures called?

Now look at the temperature between 0800-0859. What is the pattern of temperatures?

Now look at the temperature between 1200-1259. What is the pattern of temperatures?

Capture the image, stick it into a work book at draw a line dividing colder and warmer temperatures.

Now compare this image and the line you have drawn on it with the wind image you captured earlier. What do you notice?

CHALLENGE YOURSELF:

Find the Met Office Weather Station in Glasgow/ Bishopton, and click on it. Click on ‘View Full Observation’ and use the Graph view and the calendars to select from
23/12/15 to 25/12/15. How does the air temperature change?

NOW USE THE LAYERS MENU TO SELECT RAINFALL RATE AT 0600-0659

You’ll also need to add ‘WOW observations’ from the Filter menu because the official observations don’t include rainfall. Where is it raining?

Go back in time, hour by hour, what happens to where the rain is?

NOW USE THE LAYERS MENU TO SELECT ‘PRESSURE’.

Investigate how that changes through the day.

CHALLENGE YOURSELF:

Find the Met Office Weather Station in Glasgow/ Bishopton again, and click on it. Click on ‘View Full Observation’ and use the Graph view and the calendars to select from 23/12/15 to 25/12/15. How does the mean sea level pressure change?

CHALLENGE YOURSELF:

Capture the pressure image from 1200-1259 on 24th December 2015.
Can you sketch pressure contours for 992, 996, 1000, 1004, 1008 and 1012hPa?

Summarise what you think is going on with the weather on the 24th December 2015.

Red Sky – Teachers

Red Sky at Night, Shepherd’s Delight

“Red sky at night, shepherd’s delight. Red sky in the morning, shepherd’s warning” (or sailors rather than shepherds, depending on where in the country you are).

Is there any truth in this saying and, if so, why?


COMMON MISCONCEPTION: SOMETIMES THERE IS CONFUSION ABOUT THIS SAYING. IT IS TRUE THAT WHEN THE AIR IS ‘DIRTY’ – EITHER WITH POLLUTANTS FROM INDUSTRY, VEHICLES ETC OR WITH VOLCANIC ASH, SUNSETS AND SUNRISES TEND TO BE MORE SPECTACULAR. THESE CONDITIONS ARE ENHANCED BY HIGH PRESSURE, WHICH WE ASSOCIATE WITH CLEAR SKIES AND THEREFORE WARM, SUNNY WEATHER IN THE SUMMER, COLD, CRISP WEATHER IN THE WINTER (AND GLOOMY OVERCAST WEATHER IN THE LATE WINTER AND SPRING). HOWEVER, THIS IS NOT THE EXPLANATION OF THIS SAYING, BECAUSE HIGH PRESSURE TENDS TO LAST FOR SEVERAL DAYS.


You can find the Students’ Worksheet here.

Low pressure weather systems (depressions) bring us rain, strong winds and sometimes snow on high ground. Sometimes, they also bring thunder, lightning and even tornadoes to the UK. Neither shepherds nor sailors like this sort of weather.

1) Red sky at night

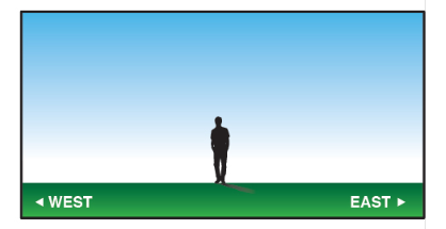
Imagine you are standing on the ground with the Sun setting (remember the Sun rises in the east and sets in the west).

Diagram red sky

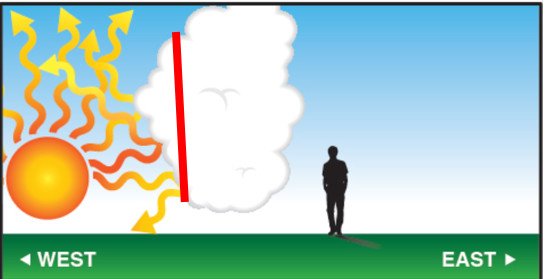
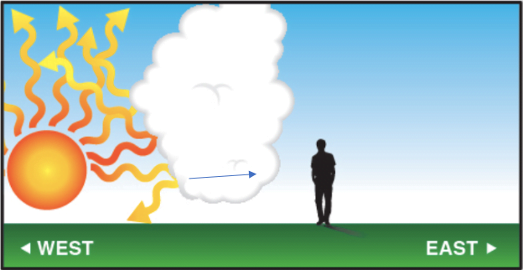
Our weather tends to come from the west. Let’s consider a weather system which has already passed us first, moving from west to east – the diagram shows the clouds associated with the weather system and the direction they are moving.

The wiggly red lines represent the Sun’s light – if the light can reach you, then you can see the Sun. At sunset and sunrise the Sun appears red.

a) Looking at the diagram, are you going to be able to see the sunset? ___Yes______________

b) Why? _Light can get from the Sun to you_____________

Light is reflected by the water droplets in a cloud. This means that some of the light heading towards the cloud is reflected back in the direction it came from. If this light can reach you, then you’ll see the cloud lit up by the setting Sun.

c) Looking at the diagram, are you going see the cloud lit up by the setting Sun? ___Yes____________

d) Why? ____The sunlight will reflect back from the cloud to you______

e) Shade the side of the cloud which will appear red.

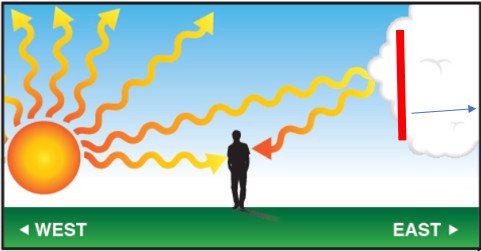
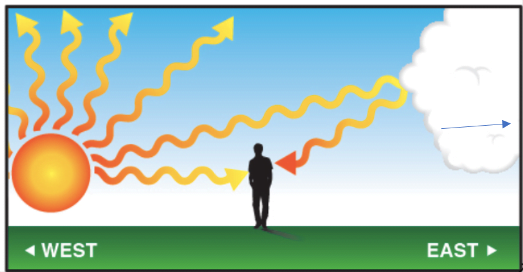
Now consider a weather system which hasn’t reached us yet:

Diagram of weather system that has not reached us yet

f) Looking at the diagram, are you going to be able to see the sunset? ____No______________

g) Why? __The cloud is in the way – sunlight can’t reach you________

h) Looking at the diagram, are you going see the cloud lit up by the setting Sun? ___No_____

i) Why? ___The side of the cloud lid up by the Sun is on the further side, which you cant see.____

j) Shade the side of the cloud which will appear red.

Weather systems are usually a few days apart – if a weather system has just passed us, we probably won’t get another one the same day. If a weather system is in sight, it will probably bring bad weather to us shortly.

In your own words, explain how these diagrams explain “red sky at night, shepherd’s delight”.

__If a storm has just passed, you’ll be able to see the sunset and the cloud illuminated by the sun, giving a red sky. If a storm has just passed, it’s unlikely that there will be another one tomorrow, so the weather is likely to be good. On the other hand, if you can’t see the setting sun or the illuminated side of the cloud, the sky won’t look red at sunset – this is the case when the cloud from an approaching storm is between you and the Sun, and bad weather is on the way.___

6. Past Climate Change

Weather and Climate: a Teachers’ Guide

Pathway: Basic weather/ Climate 

 Weather and Climate – Atmospheric and Oceanic Circulation – Climate ZonesPast Climate Change 

Lesson overviewIn this lesson we look at how global temperatures have changed over the last 400,000 years and investigate volcanoes and the Milankovitch cycles as the drivers of change, in preparation for a more detailed look at anthropogenic climate change in later lessons. 

We know about the past climate of Earth from instrumental records and paleoclimatology in which we reconstruct global climate from proxy variables including air trapped in ice bubbles and preserved organic remains.  There are several major natural influences on the climate including the Milankovitch cycles, which describe the combined effect of changes to our planets orbit around the Sun, volcanic activity, the Sun and continental drift.  By understanding these, we are able to model past climates and improve our understanding of the Earth’s climate system.

Learning objectives:

  • To be able to describe the major changes to temperature over long periods of time.

  • To be able to explain why climate changes over time.

Key Teaching Resources

Past Climate Change PowerPoint
Past Climate Change PowerPoint (easier)
Past Climate Change Worksheet
Past Climate Change Worksheet (easier)
Little Ice Age Mystery Homework
Little Ice Age Mystery Homework (with key)
Little Ice Age Mystery (for Teachers)

Teacher CPD/ Extended Reading

Read

Past Climate Change – More for Teachers

Or watch

Alternative or Extension Resources

Mystery: Why do we expect a white Christmas?

Using tree rings to explore past weather and climate 

Past Climate Change Teaching Resources

Using Leaves as Thermometers

Research exercise – looking for sources of evidence for past climate change (advanced)

Weather and Climate: a Teachers’ Guide

Red Sky Worksheet

“Red sky at night, shepherd’s delight. Red sky in the morning, shepherd’s warning” (or sailors rather than shepherds, depending on where in the country you are).

Is there any truth in this saying and, if so, why?

Low pressure weather systems (depressions) bring us rain, strong winds and sometimes snow on high ground. Sometimes, they also bring thunder, lightning and even tornadoes to the UK. Neither shepherds nor sailors like this sort of weather.

1) Red sky at night

Imagine you are standing on the ground with the Sun setting (remember the Sun rises in the east and sets in the west).

Red sky and weather systems

Our weather tends to come from the west. Let’s consider a weather system which has already passed us first, moving from west to east – the diagram shows the clouds associated with the weather system and the direction they are moving.

The wiggly red lines represent the Sun’s light – if the light can reach you, then you can see the Sun. At sunset and sunrise the Sun appears red.

a) Looking at the diagram, are you going to be able to see the sunset? ______________________

b) Why? ____________________________________________________

Light is reflected by the water droplets in a cloud. This means that some of the light heading towards the cloud is reflected back in the direction it came from. If this light can reach you, then you’ll see the cloud lit up by the setting Sun.

c) Looking at the diagram, are you going see the cloud lit up by the setting Sun? _______________

d) Why? ____________________________________________________

e) Shade the side of the cloud which will appear red.

Now consider a weather system which hasn’t reached us yet:

Weather system that has not reached us yet

f) Looking at the diagram, are you going to be able to see the sunset?


g) Why?


h) Looking at the diagram, are you going see the cloud lit up by the setting Sun?


i) Why?


j) Shade the side of the cloud which will appear red.

Weather systems are usually a few days apart – if a weather system has just passed us, we probably won’t get another one the same day. If a weather system is in sight, it will probably bring bad weather to us shortly.

k) In your own words, explain how these diagrams explain “red sky at night, shepherd’s delight”.


2) Red sky in the morning

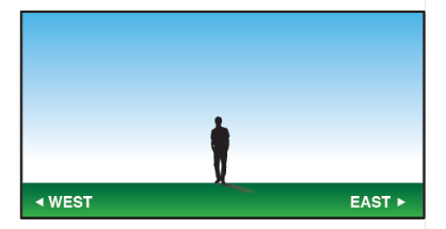
Going through the same thinking as above, complete the following diagrams to show

a) A Sunrise with a weather system which has already gone passed us.

– First draw the Sun rising in the East

– Next draw the cloud and the arrow showing which way it is moving

– Next draw lines showing light coming from the Sun and reflecting from the cloud.Diagram for drawing on

b) A Sunrise with a weather system which is about to reach us.

– First draw the Sun rising in the East

– Next draw the cloud

– Next draw lines showing light coming from the Sun and reflecting from the cloud.Second diagram for drawing on

In your own words, explain how these diagrams explain “red sky in the morning, shepherd’s warning”.


Tropical Cyclone Challenge

MetLink - Royal Meteorological Society
We use cookies on this site to enhance your user experienceBy clicking any link on this page you are giving your consent for us to set cookies. More info

By clicking any link on this page you are giving your consent for us to set cookies. More info