According to the IPCC report for Policymakers “In 2019, atmospheric CO2 concentrations were higher than at any time in at least 2 million years, and concentrations of CH4 and N2O were higher than at any time in at least 800,000 years. Since 1750, increases in CO2 (47%) and CH4 (156%) concentrations far exceed, and increases in N2O (23%) are similar to, the natural multi-millennial changes between glacial and interglacial periods over at least the past 800,000 years.”1

Source:IPCC1
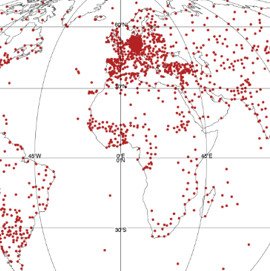
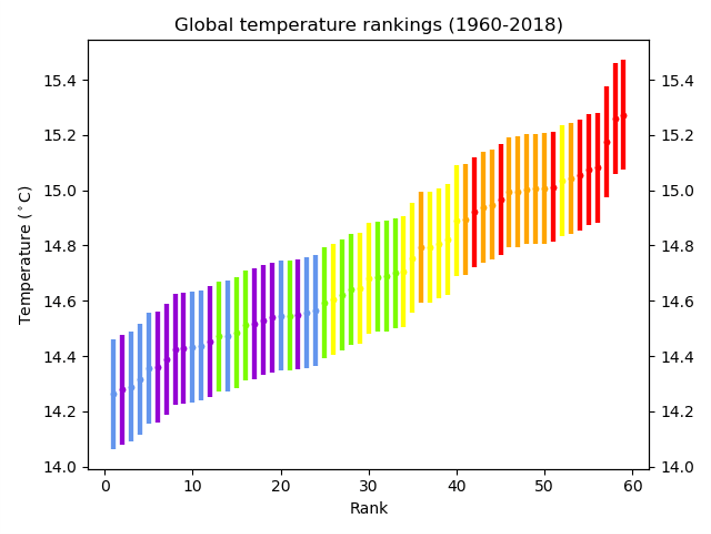
To gather information about the climate scientists need to use a wide range of sources. As can be seen on the graphic opposite, from 1800 onwards scientists can rely upon observations collected by various instruments. However to really understand climate change we need to examine longer term patterns going back thousands two hundreds of thousands of years. The evidence that we have for these can be taken for various sources as can be seen on graph B showing paleoclimatic sources of evidence. Paleoclimate is just a way of saying climate from the geological past.
Task:
Select one of the sources of instrumental observations and one of the paleoclimatic evidence and conduct some research into it.
Complete the tables to evaluate the methods of showing climate change.
Instrumental Evidence

Paleoclimate Evidence

- IPCC, 2021: Climate Change 2021: The Physical Science Basis. Contribution of Working Group I to the Sixth Assessment Report of the Intergovernmental Panel on Climate Change [Masson-Delmotte, V., P. Zhai, A. Pirani, S.L. Connors, C. Péan, S. Berger, N. Caud, Y. Chen, L. Goldfarb, M.I. Gomis, M. Huang, K. Leitzell, E. Lonnoy, J.B.R. Matthews, T.K. Maycock, T. Waterfield, O. Yelekçi, R. Yu, and B. Zhou (eds.)]. Cambridge University Press. In Press. P10. Accessed 28th November 2021 at Sixth Assessment Report (ipcc.ch)


