These resources are designed to be used in one session with year 6 (10/ 11 year old) students. Although they will support numeracy, literacy and various other aspects of the curriculum, they are designed to prepare students for secondary school rather than support the year 6 curriculum.
There are 6 suggested activities. Although they are designed to be run sequentially, you may choose to use only some of the activities, or to supplement them with your own ideas. It should be possible to use these activities with any class size.
Many people, including Ellie Highwood, Cristina Charlton-Perez, Helen Johnson and Laila Gohar, have contributed to these resources.
Carbon is one of the building blocks of life. Humans, animals and plants are made up of organic compounds. We burn wood and fossil fuels to produce energy and power transport, inadvertently releasing the greenhouse gas, CO2 into the atmosphere.
We will look at a series of calculations that represent the carbon cycle and how CO2 production is related to energy. You will start to see the energy implications of various fuels and technologies and their CO2 footprint.
The associated information sheet will provide the data you need to answer the questions below.
How much CO2 is emitted by the following activities? (calculate them in kg of CO2)
Driving 100 miles?
(Using 13 litres of petrol or 10 litres diesel)
Using your LED TV for 5 hours a day during a week?
(A 50” LED TV uses 100 watts, to convert to kWh, multiply kW by number of hours)
Boiling water in the electric kettle for a family for a week?
(A kettle uses 1200 W and it takes 3 minutes to boil water and this is done 10 times a day – or does your household drink more hot drinks?)
Heating the water with natural gas for a week of daily 5 minute showers?
(Heating 30 litre of water to 40°C uses 1.1 kWh in the form of gas, where emissions from natural gas are 0.2 kg CO2/ kWh burned)
Charging mobile phones for the family for a week. With an average of two full charges a day.
(Typical phone charges at 0.015 kWh and takes 2 hours to charge fully)
Play station for 20 hours a week
(A Playstation 4 Pro uses 139 W)
2. How to quantify CO2 emissions in terms of volume and mass?
How many cubic metres of CO2 would 5000 kg CO2 occupy?
A factory states that it releases 10 tons C per year (as greenhouse gas emissions). How many m3 of CO2e is this?
If UK car emissions released 3 GtC in a year and all the CO2 remained in the atmosphere, by how much would the CO2 concentration increase?
Go to see last year´s UK Carbon emissions published by the government (Provisional GHG emissions). In 2019 it was 351.5 Mt CO2 Considering the UK population is 63 million and the world population is 8.3 billion, are our carbon emissions representative of global average emissions? ((World emissions in 2017 were 36 Bt)
What is today´s CO2 concentration at Mauna Loa (https://www.esrl.noaa.gov/gmd/ccgg/trends/)? How much has it increased since 1950? How much has it increased since the same month in 2018?
Why has CO2 not decreased in 2020 if CO2 emissions have dropped? Is there still last years and the decade before´s emissions in the air or are we still emitting more despite the drop in transport and industry in 2020?
3. Steps towards reaching carbon neutrality
Do you think the UK is on its way to becoming a low carbon economy? Why do you think some countries like Estonia are way behind the UK and countries like Sweden are way ahead?
The UK has a goal of reaching Carbon neutrality by 2050- do you think we are on our way to reaching that?
What percentage of our man-made CO2 emissions are absorbed by the oceans?
If a fully grown tree absorbs 22 kg of CO2 per year and an acre of forests 2.5 tons of Carbon, if we wanted to neutralize our country-wide annual emissions of 351.5Mt* CO2, how many more trees or acres of forest would we need?**
Carbon is one of the building blocks of life. Humans, animals and plants are made up of organic compounds. We burn wood and fossil fuels to produce energy and power transport, inadvertently releasing the greenhouse gas, CO2 into the atmosphere. Students will become more aware of the facts and figures that link the carbon cycle with CO2 emissions and the jargon that is used in the news and in global climate politics.
Chemistry curriculum links: AQA GCSE
3.2.1 Use of amount of substance in relation to masses of pure substances (Moles)
7.1 Carbon compounds as fuels and feedstock
9.2 Carbon dioxide and methane as greenhouse gases
9.2.4 The carbon footprint and its reduction
Chemistry in the activity
Calculating the energy from combustion of different fuels is related to the number of Carbon atoms these hydrocarbons contain. The amount of CO2 produced upon combustion is our way of measuring the Carbon footprint of energy sources. Electricity is generated from various forms of energy in each country´s electricity mix and the more renewables and the fewer inefficient coal power plants there are, the less CO2 is released per kWh electricity used. The UK is trying to go below 100 g of CO2 released per kWh by 2030 and is likely to achieve this before that date.
In the associated worksheet the students will carry out calculations based on a range of information they will find in the corresponding information sheet. They will become familiar with conversions between tons of Carbon and tons of CO2, the volume of CO2 and other factors they may hear in the news or that relate to their personal, a country´s or organisation´s carbon emissions.
They will go to websites that provide current global CO2 levels and a breakdown of the UK´s electricity supply, with the corresponding kg of CO2 this will emit per unit electricity used. Questions 1&2 use numeracy skills to evaluate and compare different forms of energy and different technologies.
Question 3 is best used as a classroom discussion and covers carbon neutrality, achieving the UK´s Carbon neutrality goals and calculate how many trees they would have to plant to neutralise this year´s CO2 emissions.
1. Which fuels or activities produce more CO2?
QUESTIONS
Which of these activities produces more CO2 emissions? (calculate them in kg of CO2)
Driving 100 miles?
(Using 13 litres of petrol or 10 litres of diesel)
Petrol = 2.3 x 13, Diesel = 2.7 x 10 = 29.9 kg CO2 for petrol and 27 kg for diesel
Using your LED TV for 5 hours a day during a week?
(A 50” LED TV uses 100 watts, to convert to kWh, multiply kW by number of hours)
5 x 7 hours at 100 watts = 3.5 kWh = 3.5 kg CO2
Boiling water in the electric kettle for a family for a week?
(A kettle uses 1200 W and it takes 3 minutes to boil water and this is done 10 times a day – or does your family drink more tea?)
1200 x 10 x 3 x 7 = 210 minutes (3.5 hours) or 4.2 kWh x 0.283 = 1.19 kg CO2
Heating the water with natural gas for a week of daily 5 minute showers?
(Heating 30 litre of water to 40°C uses 1.1 kWh in the form of gas, where emissions from natural gas are 0.2 kg CO2/ kWh burned)
Heating the water for a week uses 7.7 kWh so 0.2 x 7.7 is 1.54 kg CO2
Mobile phone usage for the family in a week. Assume the family does an average of two full charges a day.
(Typical phone charges at 0.015 kWh and takes 2 hours to charge fully)
4 x 7 x 0.005 = 0.014 kWh x 0.283 = 0.396 kg CO2
Play station for 20 hours a week
(A Playstation 4 Pro uses 139 W)
139 x 20 = 2.4 kWh = 7.87 kg CO2
2. How to quantify CO2 emissions in terms of volume and mass?
QUESTIONS
How many cubic metres of CO2 would 5000 kg CO2 occupy? 2500 m3
A factory states that it releases 10 tons C per year (for its greenhouse gas emissions). How many m3 of CO2e is this? 10,000 kg x 44/12 = 36,667 kg CO2, so ½ x this is 18,333 m3
If UK car emissions released 3 GtC in a year and all the CO2 remained in the atmosphere, by how much would the CO2 concentration increase?
0.47 x 3 = 1.41 ppmv
Go to see last year´s UK Carbon emissions published by the government (Provisional GHG emissions). In 2019 it was 351.5 Mt CO2 Considering the UK population is 63 million and world population is 8.3 billion, are our carbon emissions representative of global average emissions? ((World emissions in 2017 were 36 Bt)
63m/8.3b =0.81 % of population and CO2 emissions are 351.5Mt/36000Mt = 0.98 %, so the population of the UK creates more CO2 than their population dictates, we produce 0.98/0.81 =1.21 times more CO2 than the average world population
What is today´s CO2 concentration at Mauna Loa (https://www.esrl.noaa.gov/gmd/ccgg/trends/)? How much has it increased since 1950? How much has it increased since the same month in 2018?
(figures for 2020) 500 ppm; increase of 100 ppm between 1950 and 2020 (in 70 years), that is a 0.7 ppm average increase; it has increased 4 ppm since 2018 (in 2 years), 2 ppm increase per year. The rate of increase of CO2 concentration has increased since the 1950s.
Why has CO2 concentration not decreased in 2020 if CO2 emissions have dropped?
The lifetime of CO2 means that it stays around in the atmosphere for many years and you will not see a decrease in the CO2 from the year that you stop releasing it, it will gradually level off, that is why we need to reach our CO2 emission peak as early as possible, to see the results a few years later.
3. Steps towards reaching carbon neutrality
QUESTIONS to discuss as a class
Do you think the UK is on its way to becoming a low carbon economy? Why do you think some countries like Estonia are way behind the UK and countries like Sweden are way ahead? (http://www.globalcarbonatlas.org/en/CO2-emissions is a useful information source)
Estonia still burns a lot of coal, hence its high CO2 emissions. Sweden has 80 % of its electricity from nuclear and renewables
The UK has a goal of reaching Carbon neutrality by 2050- do you think we are on our way to reaching that?
What percentage of our anthropogenic (human) CO2 emissions are absorbed by the oceans?
31 %
If a fully grown tree absorbs 22 kg of CO2 per year and an acre of forest, 2.5 tons of Carbon, if we wanted to neutralize our country-wide annual emissions of 351.5Mt* CO2, how many more trees or acres of forest would we need?**
351500/2.5 = 140600 acres. There are 60 million acres in the UK, so actually, only adding 0.234 % of the land as forests would do this!
Carbon is one of the building blocks of life. Humans, animals and plants are made up of organic compounds. We burn wood and fossil fuels to produce energy and power transport, inadvertently releasing the greenhouse gas, CO2 into the atmosphere.
1. Which fuels or activities produce more energy or CO2?
What are fossil fuels made up of? Hydrocarbons with varying amounts of Carbon:
Coal contains large complex hydrocarbon molecules (with C:H:O ratios of ~85C:5H:10O)
Diesel is made up of alkanes containing 12 or more carbon atoms. (e.g. C13H28)
Petrol contains alkanes and cyclo-alkanes with between 5 and 12 Carbon atoms (with an average composition of C8H12 (octane))
The mass of one mole of pure Carbon is 12 g and the mass of one mole of CO2 is 12 + (2×16) = 44 g (to convert from CO2e to C multiply by 12/44)
What are the combustion reactions and how much energy and CO2 do they produce?
1 kg of petrol burned yields about 47 MJ of energy (1litre, 34.2MJ)
1 kg of diesel burned yields about 46 MJ of energy (1litre, 38.6MJ) (diesel is denser than petrol and has more energy per litre)
1 kg of coal burned yields about 30 MJ of energy
1 kg of wood burned yields about 19 MJ of energy
1 kg of coal (containing 0.78 kg Carbon) will produce 2.4 kg of CO2
1 litre of petrol (containing 0.63 kg of carbon) will produce 2.3 kg of CO2
1 litre of diesel (containing 0.72 kg of carbon) will produce 2.7 kg of CO2
The most up-to-date information on the make-up of the UK electricity grid (which is a mix of sources) can be found at RENSmart and the value in February 2021 was that 1 kWh produces 0.23314 kg CO2. (kWh are calculated by multiplying kW by the number of hours). If you live in another country you could compare its CO2 emissions per kWh electricity factor. Here is a good comparison site for many countries but with older data.
2. How to quantify CO2 emissions in terms of volume and mass?
Volume and mass of CO2
You will often hear about kg of CO2 emitted, relating to the energy usage of different forms of transport, of a household, of a company, of a particular industry (like the cement industry) or of a country or a person.
From what we know about the combustion processes, their efficiency and our energy needs, we can use emission factors to calculate carbon footprints. We also know that a mole of any gas occupies 22.4 dm3 at ambient temperature. So we can express the emissions as a volume of CO2. If we know how much of a gas is emitted and what the original concentration of that gas was in the atmosphere, we can see whether the emissions will change the concentration.
1 kg pure CO2 occupies a volume of half a cubic metre (500 dm3 (or litres))
CO2 emissions are often stated in GtC (109 tonnes (or Gigatonnes) of Carbon)
Concentrations of CO2 in the atmosphere are expressed in parts per million by volume (ppmv). 1 ppmv takes up 0.0001% of the volume of the atmosphere. Check out the Mauna Loa CO2 measurement station in Hawai for today´s level.
A release of CO2containing 1 GtC would increase the atmospheric CO2 concentration by 0.47 ppmv if all the CO2 remained in the atmosphere, BUT carbon sinks nearly balance out the sources
There was a CO2 increase of 2.5 ± 0.1 ppmv between 2017 and 2018
The lifetime of CO2 is 5 to 100 years
Don’t forget:
The mass of one mole of pure Carbon is 12 g and the mass of one mole of CO2 is 12 + (2×16) = 44 g (to convert from CO2eq to C multiply by 12/44)
Effects of the Covid-19 on the economy and thus CO2 emissions
Between 2019 and 2020 global CO2 emissions decreased due to the COVID-19 Pandemic (in the region of 4 Gt CO2 and the CO2 emissions fell by 7 % in 2020, the largest ever decrease since the Second World War!)
A Carbon brief article suggests that in 2020 we reduced the annual increase in CO2 concentrations by 0.32ppmv, putting it at 2.48ppm.
Note the difference between emissions of CO2 and actual concentrations. The CO2 already in the atmosphere from previous year´s emissions (it lasts up to one hundred years).
3. Steps towards carbon neutrality
This Figure shows the latest (calculated every 3 months) fuel source mix for the UK electricity supply. Go to: OFGEM. Note the elimination of coal and the increase in wind and solar energy.
The UK electricity supply now has well over 20 % from renewables. The UK is trying to get to below 100 g CO2/ kWh by 2030 and we might achieve 5 % renewables by 2025. In late 2019 the electricity from British windfarms, solar panels and renewable biomass plants surpassed fossil fuels for the first time since the UK’s first power plant fired up in 1882.
We saw in section 1 that at RENSmart you can get the latest value for how many kg CO2 are produced per kWh of electricity. Let´s compare other countries from the table at the bottom of this website. Sweden currently has an emission of 0.013 kg CO2/ kWh (21 times lower CO2 emissions per kWh!). In Sweden 80 % of electricity comes from nuclear and renewables (with 66 % from renewables). By the way, renewables do have an embedded energy (of up to 50 g CO2/ kWh).
And look what these natural Carbon Sinks can do:
Between 1994 and 2007, the oceans absorbed 34 Gt CO2 (31 % of what humans put into the atmosphere during that time)
One acre of new forest can sequester about 2.5 tons of carbon annually. Young trees absorb CO2 at a rate of 6 kg per tree each year and after 10 years they absorb 22 kg of CO2 per year. At that rate, they release enough oxygen back into the atmosphere to support two human beings.
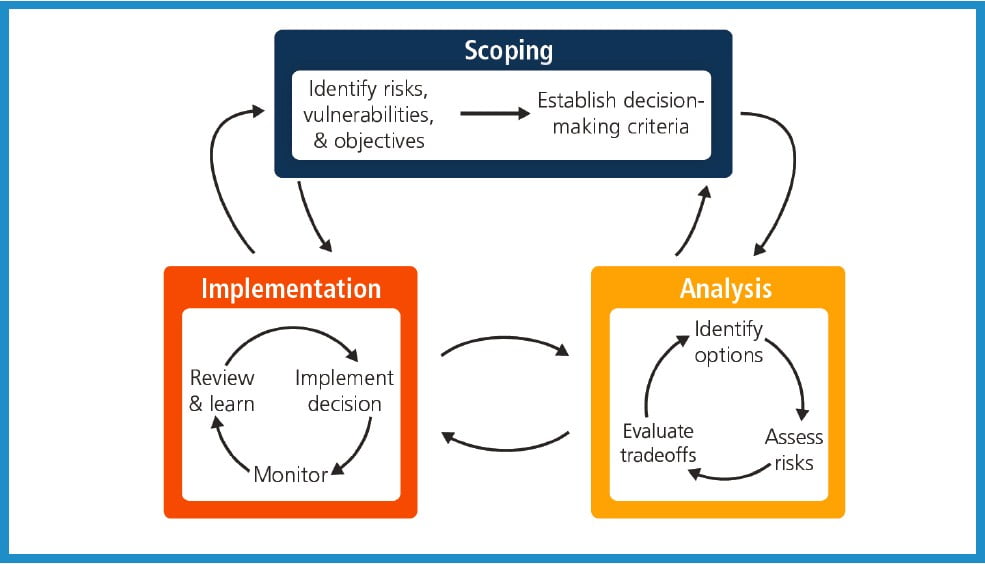
Climate change adaptation as an iterative risk management process with multiple feedbacks. People and knowledge shape the process and its outcomes. Assessment of the widest possible range of potential impacts, including low probability risks with major consequences, is central to understanding risk management strategies. Monitoring and learning are important components of effective adaptation.WG2 Summary for Policy Makers Figure 3.
Summary:
Adaptation is the process of adjustment to actual or expected climate change and its effects. In human systems, adaptation seeks to moderate or avoid harm or exploit beneficial opportunities. In some natural systems, human intervention may facilitate adjustment to expected climate and its effects.
Throughout history, people and societies have adjusted to and coped with climate, climate variability and extremes with varying degrees of success.
For many indigenous and rural communities, lay knowledge is critical to adapting to environmental changes including climate change as livelihood activities such as herding, hunting, fishing and farming are connected to and dependent on weather and climate.
Adaptation is becoming embedded in some planning processes, with a focus on incremental adjustments and co-benefits. In particular, Governments are starting to develop adaptation plans and policies and to integrate climate change considerations into broader development plans.
Responding to climate related risks involves decision making in a changing world, where the timing and severity of climate change impacts are uncertain and there are limits to the effectiveness of adaptation.
Adaptation choices now will affect the risk of climate change throughout the 21st century.
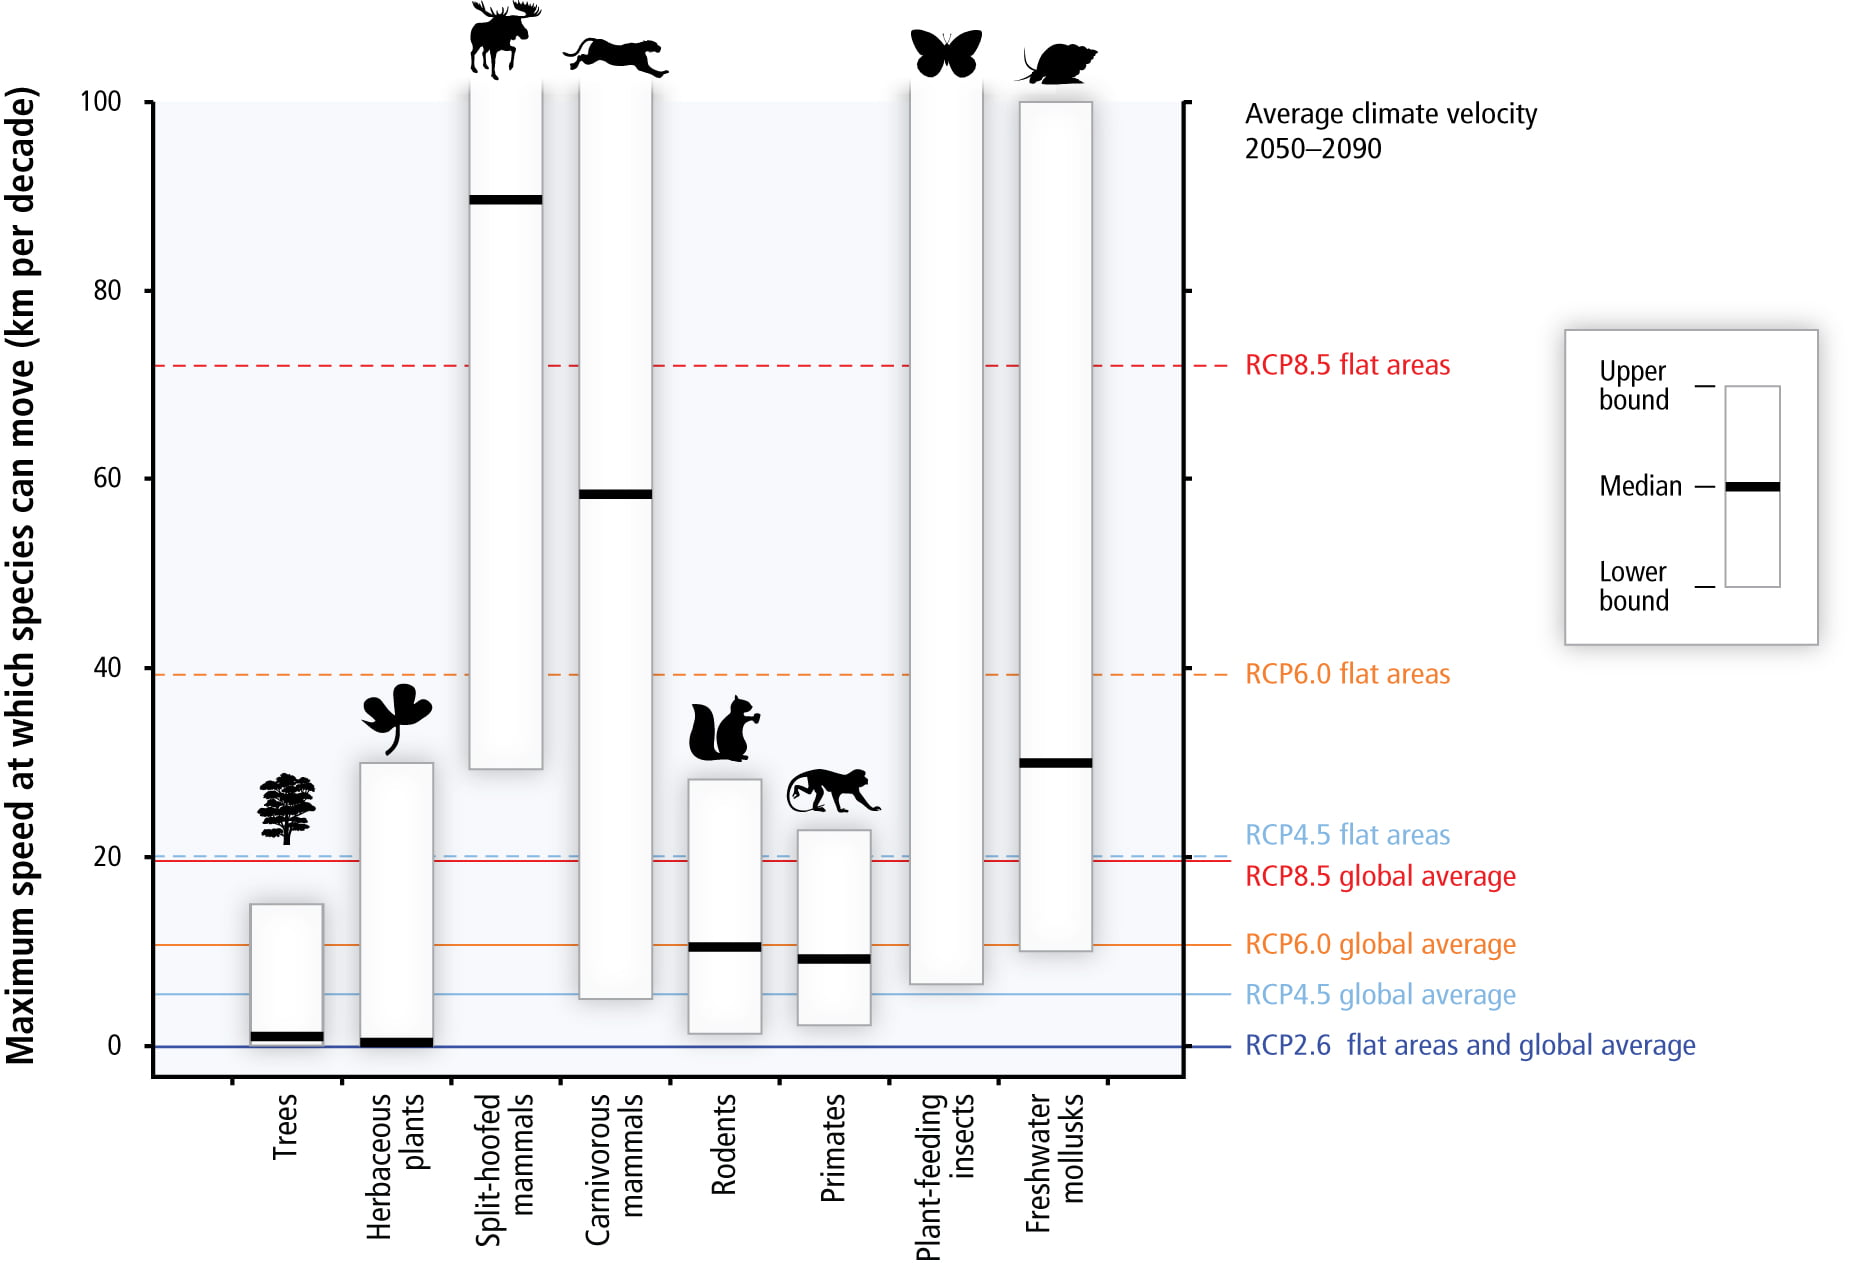
Maximum speeds at which species can move across landscapes. Human interventions, such as habitat fragmentation, can change the speeds of movement. The coloured horizontal lines show the speeds at which temperatures are expected to move across landscapes according to different projected warmings – RCP8.5 being a scenario where greenhouse emissions are high and the world warms most quickly. Species with maximum speeds below each line are expected to be unable to track warming in the absence of human intervention (such as assisted migration). They may still be able to adapt to new climates. The numbers of those which can neither move nor adapt will fall.WG2 Summary for Policy Makers, Figure 5.
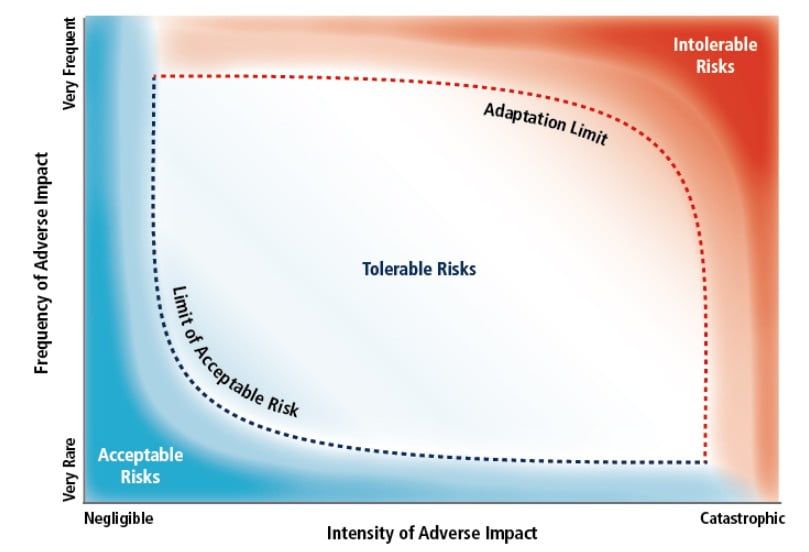
A conceptual model of the determinants of acceptable, tolerable and intolerable risks – according to an individual or a society. Adaptation efforts try to keep impacts within the tolerable risk space, although these may be limited by opportunities and constraints. The shape of the shaded regions and dotted lines can change over time as attitudes and capacities change. WG2 Chapter 16, Figure 1.
Acceptable risks are those deemed so low that additional efforts at risk reduction, in this case climate adaptation efforts, are not justified. Tolerable risks relate to situations where adaptive, risk management efforts are required and effective for risks to be kept within reasonable levels. The scope of risks that fall within the tolerable area is influenced by adaptation opportunities and constraints. Therefore, the categorization of risks varies across spatial, jurisdictional, and temporal. Opportunities and constraints may be physical, technological, economic, institutional, legal, cultural, or environmental in nature.
Intolerable risks may be related to threats to core social objectives associated with health, welfare, security or sustainability. Risks become intolerable when practicable or affordable adaptation options to avoid escalating risks become unavailable. Therefore, a limit is a point when an intolerable risk must be accepted; the objective itself must be relinquished; or some adaptive transformation must take place to avoid intolerable risk. Such a discontinuity may take several forms such as individual’s decision to relocate, an insurance company’s decision to withdraw coverage, or a species’ extinction. The alternative to such discontinuities is an escalating and unmediated risk of losses. While individuals have their own perspectives about what are acceptable, tolerable or intolerable risks, collective judgements about risk are also codified through mechanisms such as engineering design standards, air and water quality standards, and legislation that establishes goals for regulatory action. There are also international agreements that establish norms and rights relevant to climate change risks, such as the Universal Declaration of Human Rights, the International Covenant on Civil and Political Rights, and the International Covenant on Economic, Social and Cultural Rights. Further, these high level responses often shape the constraints and opportunities to adaptation and responses to risk at lower levels through the distribution of resources, institutional design, and support of capacity development. If these risks and discontinuities have global-scale consequences, they can be linked to ‘key vulnerabilities’ to climate change. Consistent with our framing of adaptation limits, such key vulnerabilities would need to be assessed in terms of the limits they imply for specific social actors, species and ecosystems.
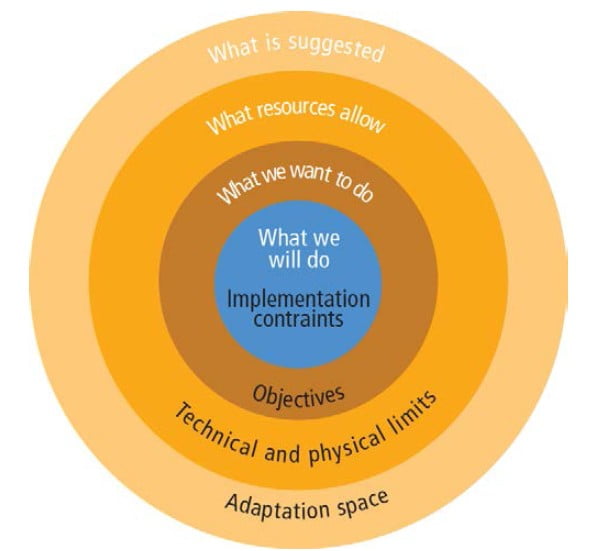
The narrowing of adaptation from the space of all possible adaptations (pale yellow) to what will be done (blue). The factors written in black show the constraints on the size of the circle, i.e. the factors preventing the blue circle being as large as the pale yellow one. WG2 Chapter 17, Figure 1.
A number of factors will limit strategy adoption and preclude elimination of all climate change effects. The first outside circle represents the “adaptation needs”, i.e. the set of adaptation actions that would be required to avoid any negative effect (and capture all positive effects) from climate change. It can be reduced by climate change mitigation, i.e. by limiting the magnitude of climate change.
The second circle represents the subset of adaptation actions that are possible considering technical and physical limits. Improving what can be done, for instance through research and development, can expand this circle. The area between the first and second circles is the area of “unavoidable impacts” that one cannot adapt to (for instance, it is impossible to restore outdoor comfort under high temperature). The third circle represents the subset of adaptation actions that are desirable considering limited resources and competing priorities: some adaptation actions will be technically possible, but undesirable because they are too expensive and there are better alternative ways of improving welfare (e.g., investing in health or education). This circle can be expanded through economic growth, which increases resources that can be dedicated to adaptation. Finally, the last circle represents what will be done, taking into account the fact that market failures or practical, political, or institutional constraints will make it impossible to implement some desirable actions. The area between the first and the last circles represents residual impacts (i.e. the impacts that will remain after adaptation, because adapting to them is impossible, too expensive, or impossible due to some barriers).
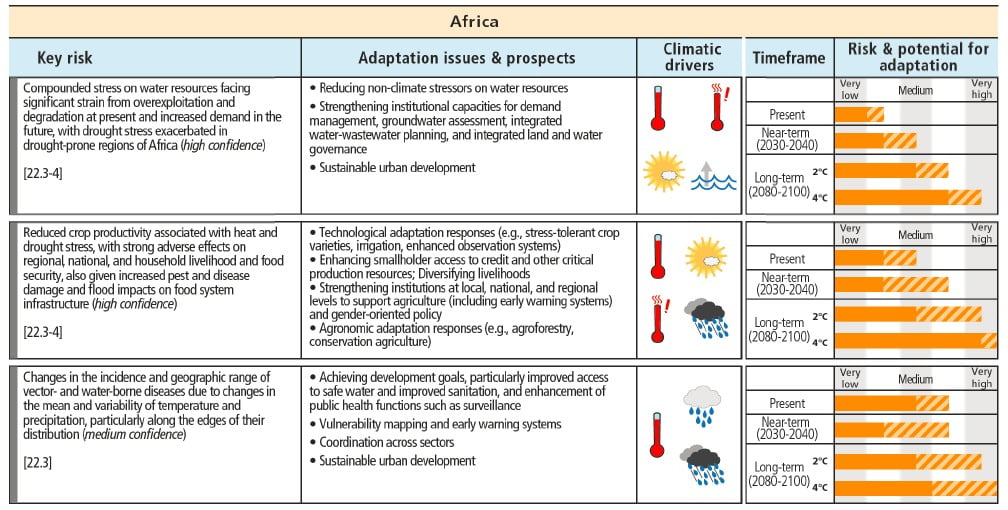
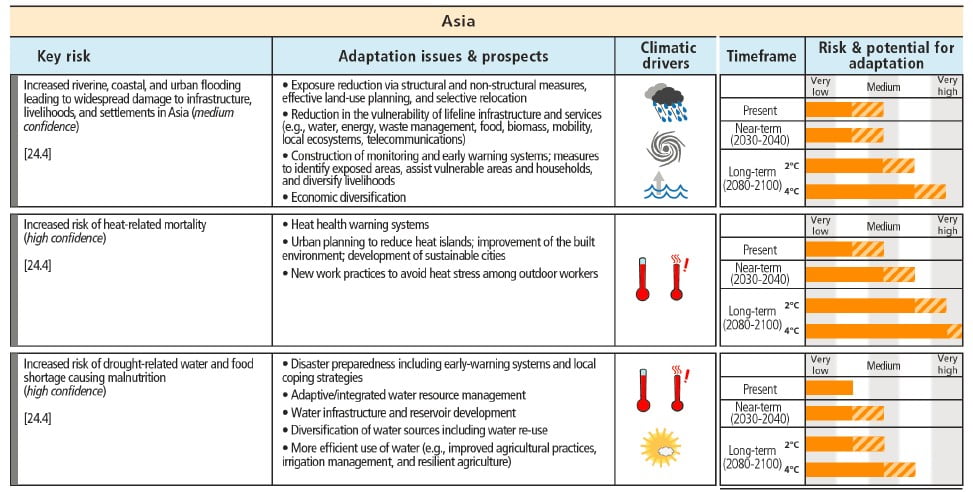
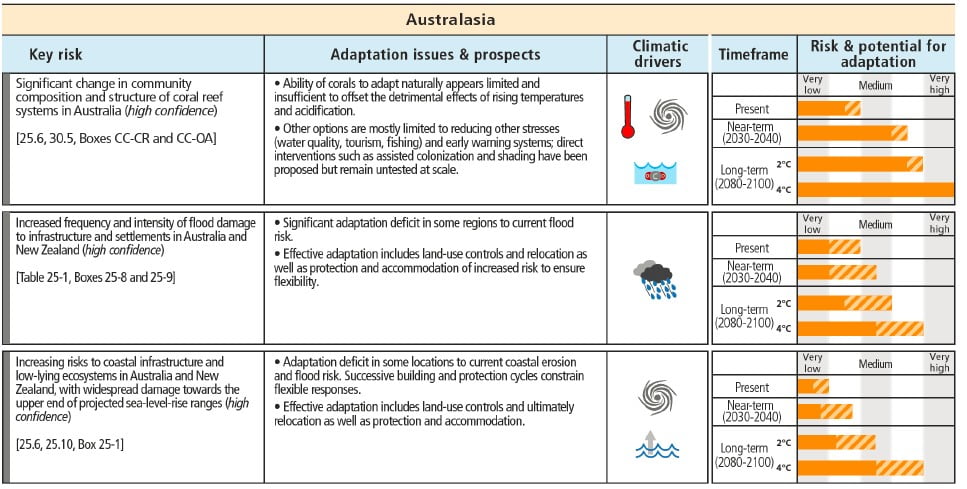
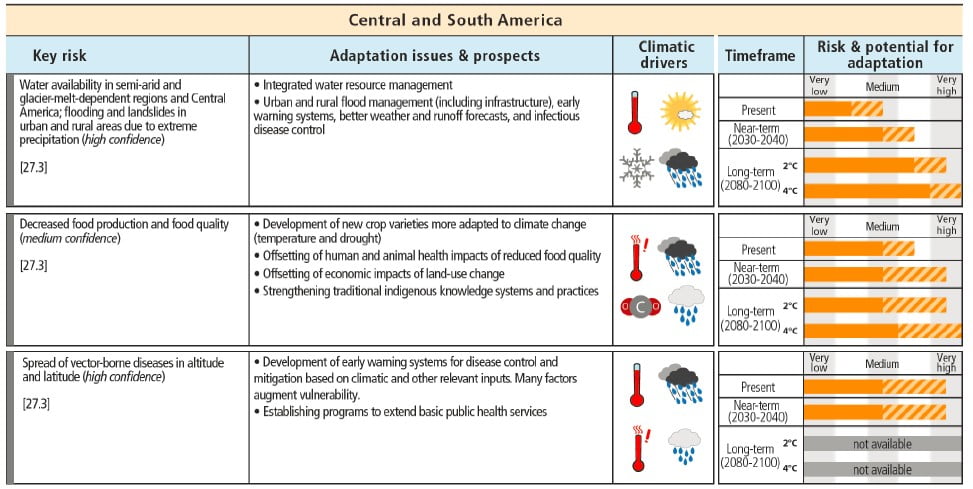
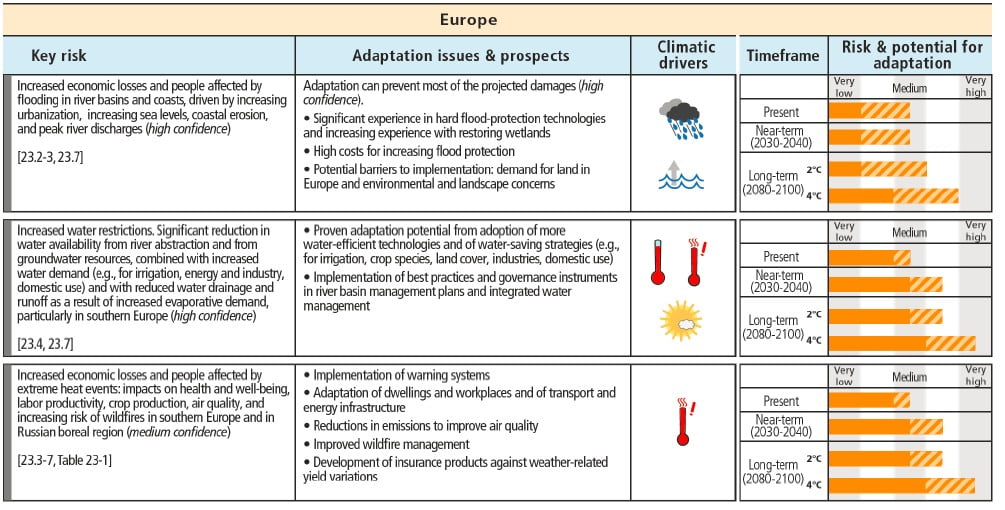
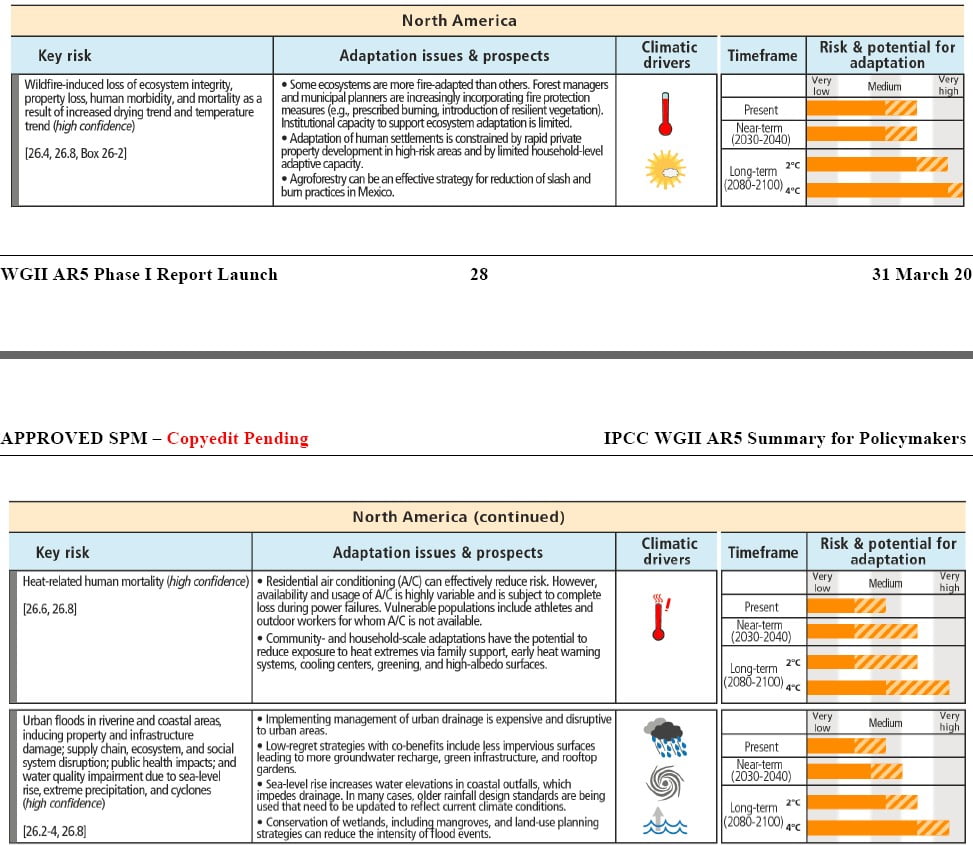
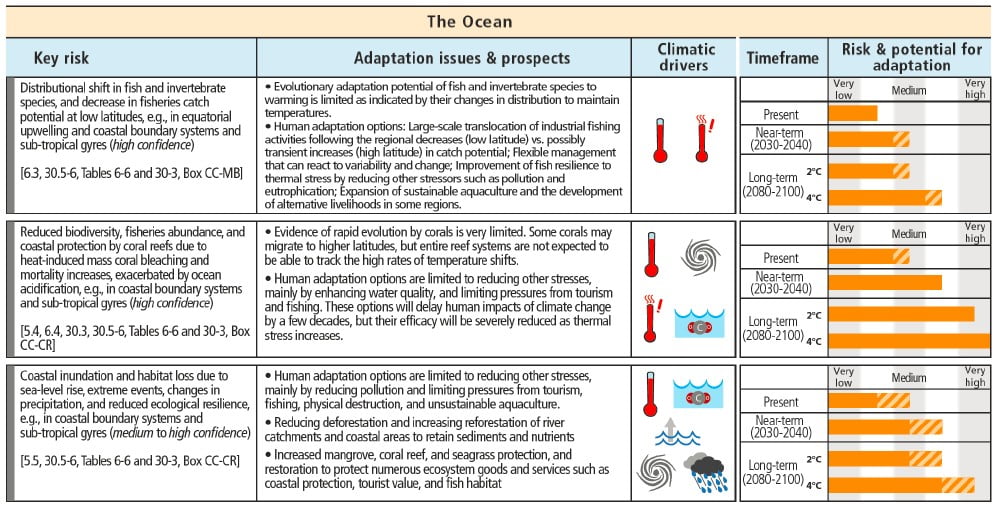
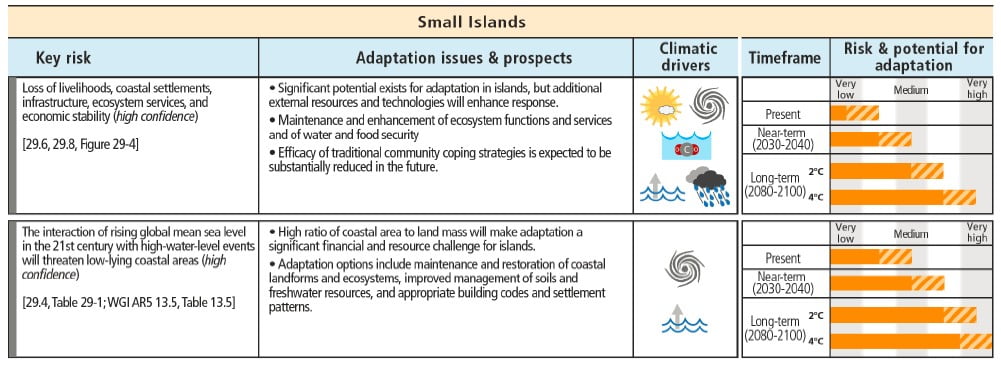
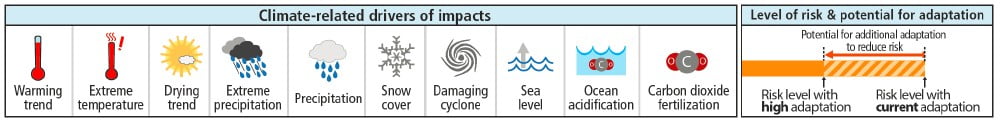
Key regional risks from climate change and the potential for reducing risks through adaptation and mitigation
Could economic approaches bias adaptation policy and decisions against the interests of the poor, vulnerable populations, or ecosystems?
(WG2 FAQ 17.2)
A narrow economic approach can fail to account adequately for such items as ecosystem services and community value systems, which are sometimes not considered in economic analysis or undervalued by market prices, or for which data is insufficient. This can bias decisions against the poor, vulnerable populations, or the maintenance of important ecosystems. For example, the market value of timber does not reflect the ecological and hydrological functions of trees nor the forest products whose values arise from economic sectors outside the timber industry, like medicines. Furthermore some communities value certain assets (historic buildings, religious sites) differently than others. Broader economic approaches, however, can attach monetary values to non-market impacts, referred to as externalities, placing an economic value on ecosystem services like breathable air, carbon capture and storage (in forests and oceans) and usable water. The values for these factors may be less certain than those attached to market impacts, which can be quantified with market data, but they are still useful to provide economic assessments that are less biased against ecosystems. But economic analysis, which focuses on the monetary costs and benefits of an option, is just one important component of decision making relating to adaptation alternatives, and final decisions about such measures are almost never based on this information alone. Societal decision making also accounts for equity – who gains and who loses – and for the impacts of the measures on other factors that are not represented in monetary terms. In other words, communities make decisions in a larger context, taking into account other socioeconomic and political factors. What is crucial is that the overall decision-framework is broad, with both economic and non-economic factors being taken into consideration. A frequently used decision-making framework that provides for the inclusion of economic and non-economic indicators to measure the impacts of a policy, including impacts on vulnerable groups and ecosystems, is multicriteria analysis (MCA). But as with all decision making approaches, the a challenge for MCA and methods like it is the subjective choices that have to be made about what weights to attach to all the relevant criteria that go into the analysis, including how the adaptation measure being studied impacts poor or vulnerable populations, or how fair it is in the distribution of who pays compared to who benefits.
The impact of 3 urban policies in Paris on climate change adaptation and mitigation
Urban policies have many goals, such as enhancing the quality of life and the city’s economic competitiveness by means of affordable housing and office space, amenities and efficient public services.
They also have social objectives aimed at poverty and social segregation issues, safety and security, and public health and environmental goals, such as reducing air and water pollution and preserving natural areas. Urban policies now also face new challenges from climate change, including adaptation and mitigation needs.
Five possible policy goals:
Climate change mitigation: reducing greenhouse gas emissions (from transport, heating and air conditioning).
Adaptation and natural risk reduction: reducing the number of people living in flood prone areas.
Natural area and biodiversity protection: minimising the total urbanised area.
Housing affordability: access to affordable housing has impacts on the quality of life and competitiveness of a city.
Policy neutrality: all geographical areas benefit equally from policies.
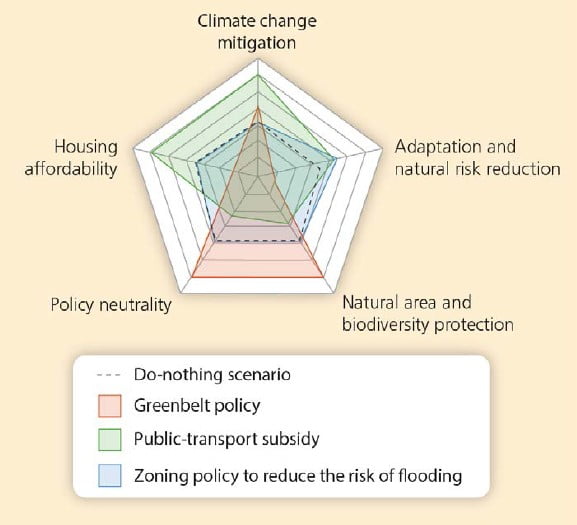
The graph below shows the effectiveness of 3 policies in Paris as measured against these policy goals. The three policies are:
1) a greenbelt policy, 2) a public transport subsidy and 3) a zoning policy to reduce the risk of flooding with building prohibited in flood prone areas.
Consequences of three policies in the Paris agglomeration: a greenbelt policy, a public transport subsidy and a zoning policy to reduce the risk of flooding (building prohibited in flood prone areas). The axes are orientated such that moving towards the edge of the plot represents a positive outcome. WG2 Chapter 17, figure 3.
By implementing all three policies, the outcome, considering both positive and negative impacts on the five policy goals, is better than a ‘do nothing scenario’ measured against the five policy goals. Therefore, climate goals can be reached more efficiently and with higher social acceptability, if they are implemented through taking into account existing strategic urban planning, rather than by creating new, independent climate-specific plans.
Additional Source:
Trade-offs and synergies in urban climate policies, V. Viguié & S. Hallegatte, Nature Climate Change 2, 334–337 (2012), doi:10.1038/nclimate1434
Case studies of UK air masses (November 2010, November 2011 and the end of September 2010) with answers for teachers and a case study of arctic maritime air (Jan/ Feb 2015) can be found on our case studies page.
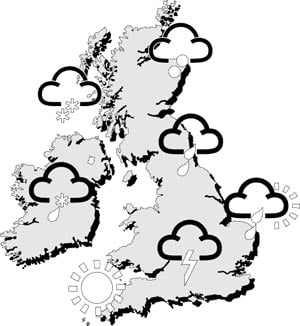
What is the weather? Work out what the weather is like at several UK locations based on some simplified weather maps.
Isotherm and Isobar drawing exercise based on a depression: student worksheet. A simpler version of the T/ isotherm map can be found here or the full version including solutions may be found on the A level page.
We’ve pulled together some resources about ex-hurricane Ophelia, bringing together information about tropical cyclones, depressions, anticyclones and air masses to explore the extremely unusual weather we experienced in October 2017 Ophelia.pptx.
An excellent resource (first published by the GA) investigating weather conditions needed for the various Olympic sporting events using weather station or WOW data.
This image shows the warming stripes for the whole globe from 1850 – 2019. These ‘warming stripe’ graphics are visual representations of the change in temperature as measured in each country over the past 100+ years. Each stripe represents the temperature in that country averaged over a year.
How has the temperature of your region changed over the period?
Roughly what proportion of the graph is mainly blue, and what proportion is mainly red? You could use a ruler to measure the graph to help you estimate this: Width of mainly blue area (w1) = Width of mainly red area (w2) = Total width (w1+w2) = Proportion of blue (w1 / total) = Proportion of red (w2/ total) = .
How does that compare to the graph for the whole world, shown above? Width of mainly blue area (w1) = Width of mainly red area (w2) = Total width (w1+w2) = Proportion of blue (w1 / total) = Proportion of red (w2/ total) = .
Looking at the stripes for your region, when does it look like the temperatures were changing fastest?
Looking at the stripes for the whole world, when does it look like the temperatures were changing fastest?
Extension Question: How do the climate stripes demonstrate the difference between weather and climate?
The Climate Change Schools Resources were developed by the Climate Change Schools Project, based at the then Science Learning Centre in Durham and led by Krista McKinzey. A large number of teachers and schools in North East England were involved in their development.
They have subsequently been updated by the Royal Meteorological Society.
Lesson overview: In this lesson we explore the language used to talk about climate change and look in detail at sea level rise, tipping points and UN climate negotiations.
The Climate Crisis movement grew during 2018 with the formation of Extinction Rebellion and Greta Thunberg’s Schools Climate Strike. The language used by both politicians and the public to describe climate change was transformed over the space of a few months; Blue Planet 2 sensitised the UK public to the environmental impacts of our lives, Extinction Rebellion was formed to demand greater and faster action to reduce the impacts of climate change and Greta Thunberg’s Schools Climate Strike spread across the world. The discourse changed and legally binding commitments were demanded from national governments to reduce emissions and limit warming to 1.5oC following an IPCC report.
Learning objectives:
To consider a range of facts and opinions on climate change.
To decide if we are in a climate crisis.
To understand what tipping points are and their impact on climate change.
Lesson overview: In this lesson we use the Central England Temperature record to explore changing UK weather and look at the projected impacts of climate change on the UK.
The UK climate has always changed and in over recent decades has become warmer. Over the coming century it is projected to become warmer and wetter in winter and hotter and drier in summer. Although change is unlikely to be dramatic, its cumulative impact will be significant and will affect human populations, landscapes and the natural world. Adaptation and mitigation can help to ameliorate some of the negative impacts of our changing climate, though some populations, landscapes and ecosystems could be severely affected if the most extreme forecasts are realised.
Learning objectives:
To understand how climate (precipitation and temperature) has changed over time in the UK
To be able to classify the potential impacts of changing climate on the UK.


