Air Masses
An air mass is a large body of air with relatively uniform characteristics (temperature and humidity). Air masses are classified according to their source region and track.
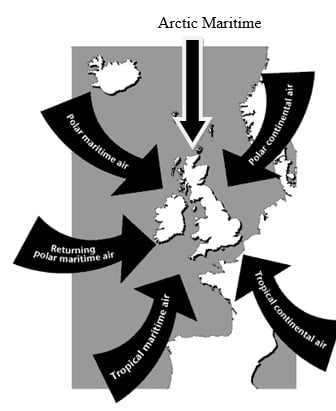
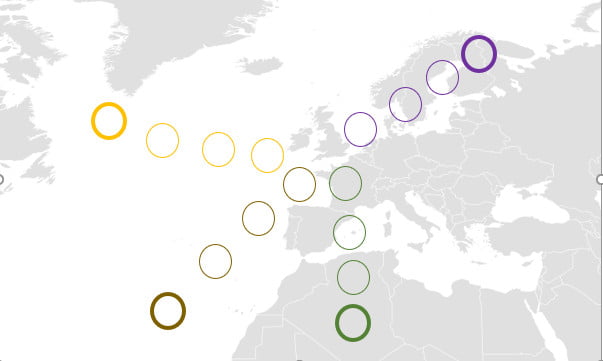
There are six air masses (Figure 1) which can affect the weather in the UK – Polar Maritime is the most common, but we can also experience Polar Continental, Tropical Maritime, Tropical Continental, Arctic Maritime and Returning Polar Maritime air.
The source regions tend to be semi-permanent anticyclones (associated with the sinking regions of the global atmospheric circulation) in the sub-tropics and polar regions (‘tropical’ or ‘polar’ air). Air masses acquire their characteristics by contact with the underlying surface in the source region.
The UK sometimes also get Arctic air, which has travelled straight south from the Arctic. Returning polar air is polar air which changed direction over the Atlantic, hitting the UK from the west or even south of west, but still polar in nature. 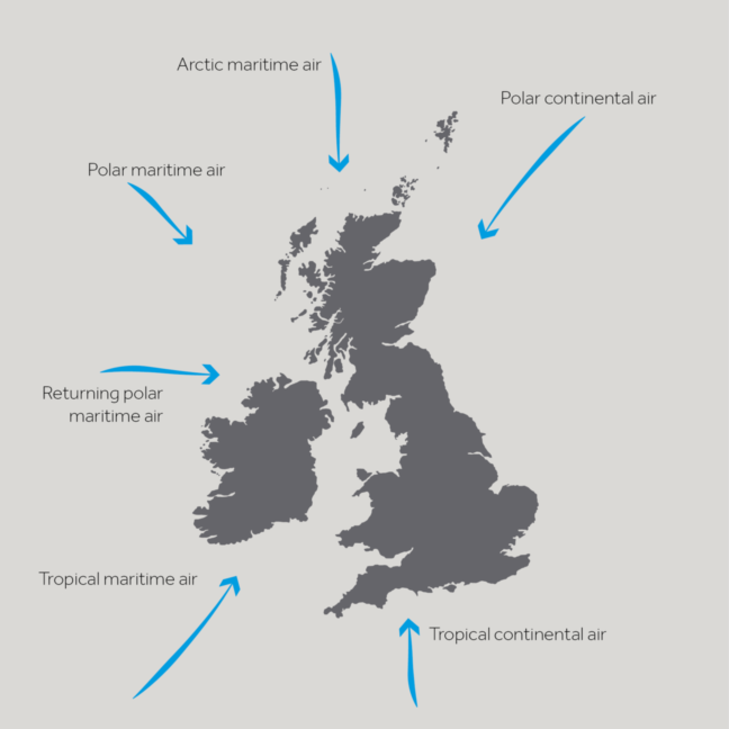
FIGURE 1: THE 6 AIR MASSES WHICH CAN AFFECT THE WEATHER IN THE UK
Southward moving air is warmed from below as it passes over warmer land and water and becomes more unstable, eventually rising and producing convective cloud – eg puffy cumulus clouds. When you look at these clouds you can sometimes watch the air rising and the cloud bubbling up. In contrast, northward flowing air is cooled from below and becomes more stable.
Air travelling over the sea is moistened and we refer to this as ‘maritime’ air, whereas the moisture in air with a continental track hardly changes and so this is known as ‘continental’ air.
Looking at Figure 1, it’s easy to think that the North East of the UK always experiences Polar Continental air, whilst the South West always experiences Tropical Maritime air etc, but this is not the case. Usually, the whole country experiences the same air mass at the same time. A front is where two air masses meet.
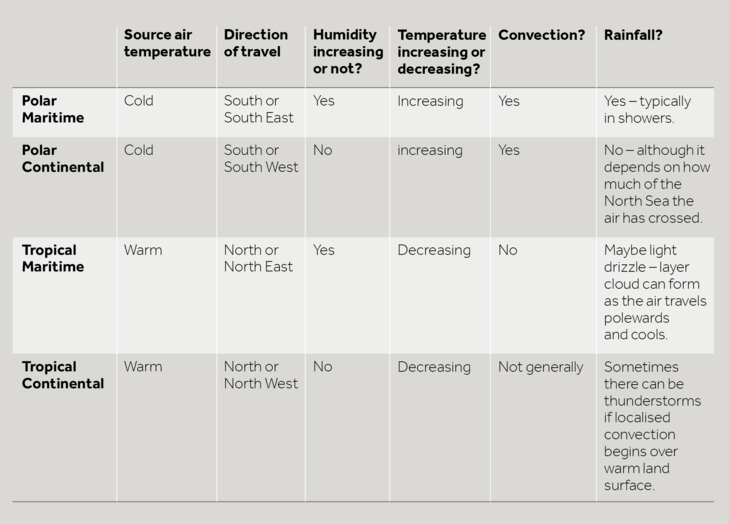
The table below which summarises what is happening to the air from the four major air masses as they approach the UK.
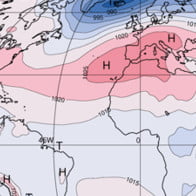
The satellite image in Figure 1, shows Tropical Continental air over much of continental Europe and the UK. Although there is a front coming in from the west, before it arrives much of the UK is cloud free and sunny. However, it’s worth noting those small, puffy blobs of cloud over the centre of Spain and France. In small areas, the sun has warmed the ground enough to make the air there rise and form localised summer thunderstorms.
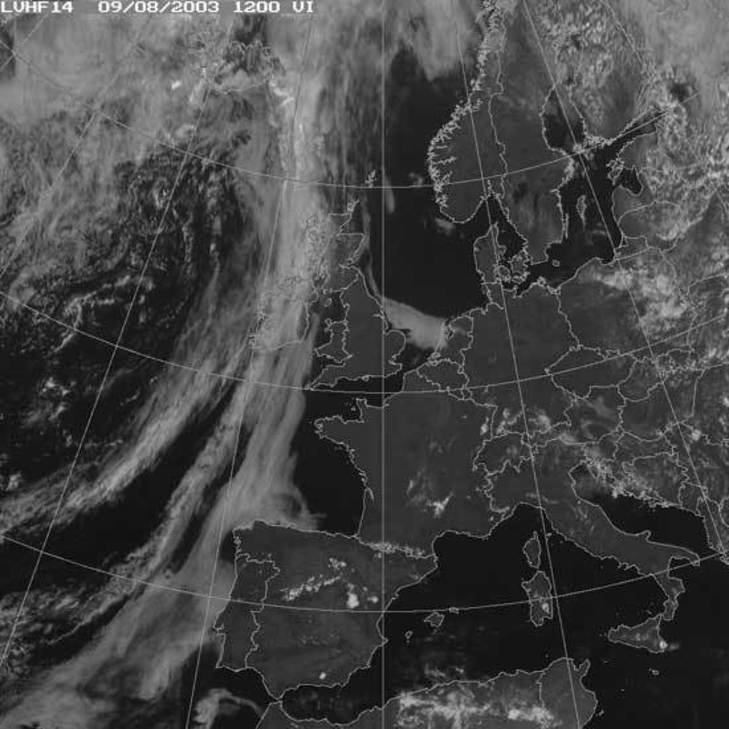
FIGURE 1: A SATELLITE IMAGE SHOWING TROPICAL CONTINENTAL AIR OVER MUCH OF THE UK AND CONTINENTAL EUROPE.© COPYRIGHT EUMETSAT/MET OFFICE
In Figure 2 you can see a typical satellite image showing Polar Continental air. Air blowing off Scandinavia is initially very cold and dry, giving a clear band of sky in the east North Sea and Baltic. However, as it travels over the water it picks up moisture and eventually cloud forms – over the western North Sea and the first bit of the UK it reaches – the east coast.
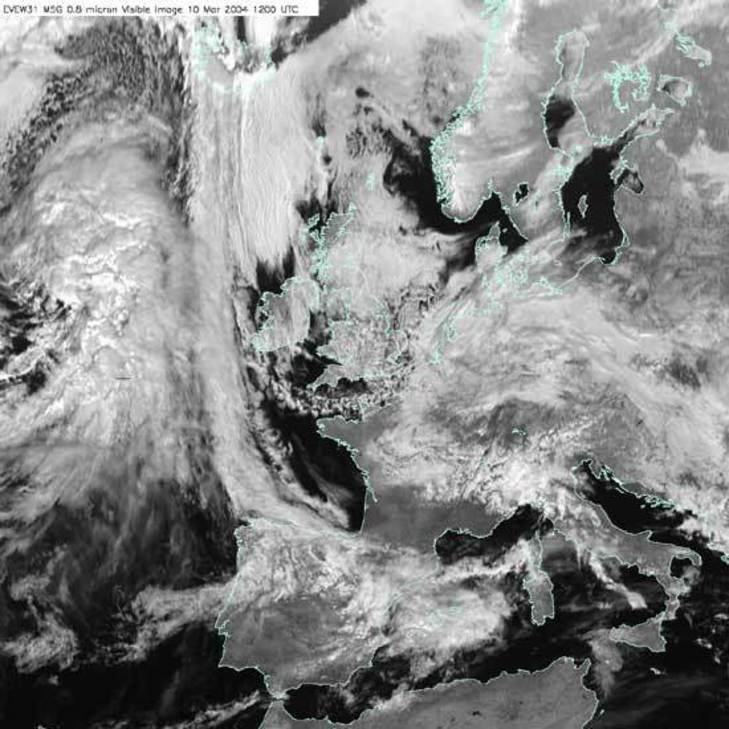
FIGURE 2: A SATELLITE IMAGE SHOWING POLAR CONTINENTAL AIR OVER THE UK AND NORTH SEA © COPYRIGHT EUMETSAT/MET OFFICE
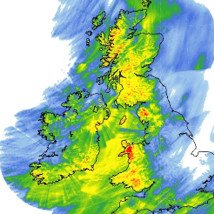
Figure 3, shows a very characteristic winter satellite image, as Polar Maritime air dominates UK weather. In the winter, the ocean is warmer than the land as well as being the moisture source – most of the convection (warm air rising) and rainfall occurs there. You can see the small blobs of convective cloud – puffy, cumulus clouds. The first bit of land the air reaches will be the west coast of Ireland, Wales, Scotland and England. As the air rises over the land, it cools further and more cloud, and rain, form.

FIGURE 3: A SATELLITE IMAGE SHOWING POLAR MARITIME AIR OVER MUCH OF THE NORTH ATLANTIC AND EUROPE © COPYRIGHT EUMETSAT/MET OFFICE
In Tropical Maritime air (Figure 4), the air is cooling as it travels North, so the cumulus clouds associated with convection don’t form. However, the air is cooling without rising, so cloud can still form – this time in large horizontal sheets of stratus cloud. Again, the water source is the ocean, so the cloud mainly forms there. This cloud won’t produce rainfall as heavy as that associated with polar air, but might give a steady drizzle.
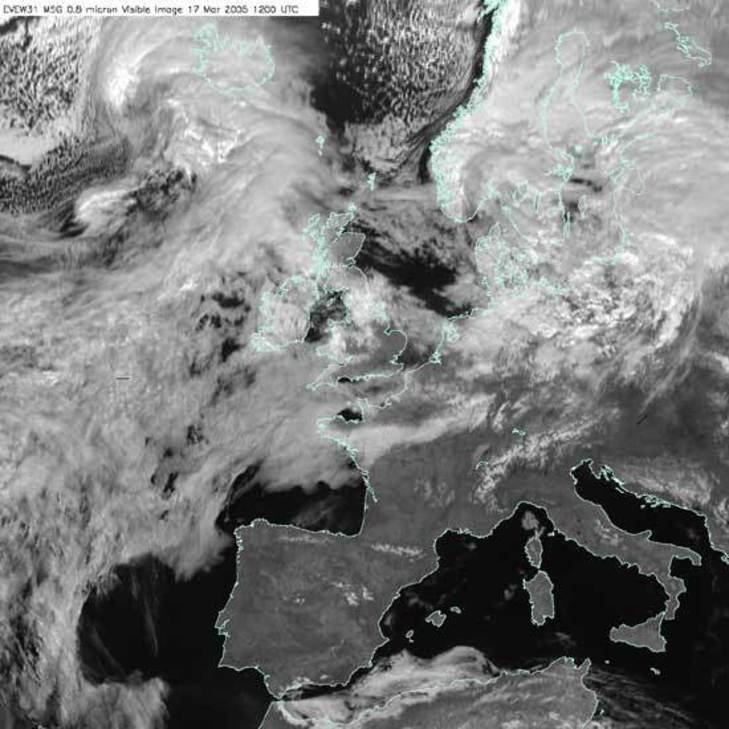
FIGURE 4: A SATELLITE IMAGE SHOWING TROPICAL MARITIME AIR © COPYRIGHT EUMETSAT/MET OFFICE
Teaching Resources
The animations in this YouTube film can also be found here
Air Mass resources from Weather and Climate: a Teachers’ Guide (with classroom resources and support information for teachers)
https://www.metlink.org/secondary/key-stage-4/airmasses-2/
http://www.metoffice.gov.uk/learning/learn-about-the-weather/how-weather-works/air-masses
https://www.metlink.org/secondary/key-stage-4/airmasses/
Case studies of UK air masses (November 2010, November 2011 and the end of September 2010) with answers for teachers and a case study of arctic maritime air (Jan/ Feb 2015) can be found on our case studies page. Tc air mass and Saharan Dust. Arctic Maritime air case study (May 2020).
Data and Image Sources
Take a look at the current surface air flow on earth.nullschool.net. Which air mass is affecting the UK now?
The followingYouTube clip from the BBC programme, The Great British Weather gives a great introduction to air masses.
For this investigation you will use the Weather Observations Website which collects weather data from around the world.
An air mass is a large body of air with relatively uniform characteristics (temperature and humidity) in the horizontal.
The properties of an air mass depend upon:
a) Its source – air originating in tropical regions is warm, whereas air originating in polar regions is cold.
b) Its track – air travelling over the sea is moistened, whereas the moisture in air with a continental track is hardly changed.
Go to the WOW website wow.metoffice.gov.uk.
Case Study 1
Use the calendar to go to 4th February 2013 at 1100-1159.
In the ‘filters’ menu select both ‘WOW observations’ and ‘Official Observations’.
Select ‘present weather’ from the ‘layers’ menu.
What is the weather like?
Select ‘rainfall rate’. Is it raining anywhere? If so, where?
How does the pattern of rainfall change as day turns to night?
Go back to 1100-1159 and select ‘snowfall’. Is it snowing anywhere? If so, where?
Select ‘temperature’. What is the air temperature around the UK? Would you say that was normal, high or low for the time of year?
Now look at the wind direction. Where is the wind coming from?
Which air mass is affecting the UK at this time?
Use the calendar to go to 21st February 2013 at 1100-1159.
Select ‘present weather’ from the ‘layers’ menu. What is the weather like?
Select ‘rainfall rate’. Is it raining anywhere? If so, where?
How does the pattern of rainfall change as day turns to night?
Go back to 1100-1159 and select ‘snowfall’. Is it snowing anywhere? If so, where?
Select ‘temperature’. What is the air temperature around the UK? Would you say that was normal, high or low for the time of year?
Now look at the wind direction. Where is the wind coming from?
Which air mass is affecting the UK at this time?
Use the calendar to go to 4th January 2013 at 1100-1159.
Select ‘present weather’ from the ‘layers’ menu. What is the weather like?
Select ‘rainfall rate’. Is it raining anywhere? If so, where?
How does the pattern of rainfall change as day turns to night?
Go back to 1100-1159 and select ‘snowfall’. Is it snowing anywhere? If so, where?
Select ‘temperature’. What is the air temperature around the UK? Would you say that was normal, high or low for the time of year?
Now look at the wind direction. Where is the wind coming from?
Which air mass is affecting the UK at this time?
Use the calendar to go to 11th August 2012 at 1100-1159.
Select ‘present weather’ from the ‘layers’ menu. What is the weather like?
Select ‘rainfall rate’. Is it raining anywhere? If so, where?
How does the pattern of rainfall change as day turns to night?
Go back to 1100-1159 and select ‘snowfall’. Is it snowing anywhere? If so, where?
Select ‘temperature’. What is the air temperature around the UK? Would you say that was normal, high or low for the time of year?
Now look at the wind direction. Where is the wind coming from?
Which air mass is affecting the UK at this time?
Use the calendar to go to 6th February 2013 at 1100-1159.
Select ‘present weather’ from the ‘layers’ menu. What is the weather like?
Select ‘rainfall rate’. Is it raining anywhere? If so, where?
How does the pattern of rainfall change as day turns to night?
Go back to 1100-1159 and select ‘snowfall’. Is it snowing anywhere? If so, where?
Select ‘temperature’. What is the air temperature around the UK? Would you say that was normal, high or low for the time of year?
Now look at the wind direction. Where is the wind coming from?
Which air mass is affecting the UK at this time?
Investigating the Link Between Between Pressure and Rainfall
Here is some data collected by a weather station on the outskirts of Edinburgh, at the start of 2019.
Date | Atmospheric Pressure (hPa) | Rainfall (mm) |
10/12/2018 | 1025 | 0.0 |
11/12/2018 | 1020 | 0.0 |
12/12/2018 | 1019 | 0.0 |
13/12/2018 | 1022 | 0.0 |
14/12/2018 | 1017 | 0.0 |
15/12/2018 | 988 | 1.0 |
16/12/2018 | 1005 | 5.1 |
17/12/2018 | 1005 | 0.3 |
18/12/2018 | 996 | 1.5 |
19/12/2018 | 995 | 0.3 |
20/12/2018 | 995 | 0.5 |
21/12/2018 | 1000 | 0.5 |
22/12/2018 | 1014 | 0.0 |
23/12/2018 | 1027 | 0.0 |
24/12/2018 | 1032 | 0.3 |
25/12/2018 | 1026 | 0.3 |
26/12/2018 | 1023 | 0.0 |
27/12/2018 | 1023 | 0.0 |
28/12/2018 | 1022 | 0.0 |
29/12/2018 | 1030 | 2.3 |
30/12/2018 | 1030 | 0.3 |
31/12/2018 | 1026 | 0.0 |
01/01/2019 | 1044 | 0.0 |
02/01/2019 | 1043 | 0.0 |
03/01/2019 | 1041 | 0.0 |
04/01/2019 | 1039 | 0.0 |
05/01/2019 | 1034 | 0.0 |
06/01/2019 | 1031 | 1.0 |
07/01/2019 | 1024 | 0.0 |
08/01/2019 | 1033 | 0.0 |
09/01/2019 | 1031 | 0.0 |
Using this data, draw a graph of rainfall against pressure.

Now use this information to complete the following sentences:
The most it rained in one day was _______________mm.
It didn’t rain at all on ____________ days.
The highest pressure recorded was ______________hPa (a hPa is the same as a millibar).
The lowest pressure recorded was _______________hPa.
Does it always rain when the pressure is low? Use figures to justify your answer.
____________________________________________________________________________________________________________________________________________________________________________________________________________________________________________________________________________________________________________________________________________________________________________________________
Does it ever rain when the pressure is high? Use figures to justify your answer.
____________________________________________________________________________________________________________________________________________________________________________________________________________________________________________________________________________________________________________________________________________________________________________________________
Many weather apps assume that if the pressure is low, it will rain. Does your graph justify this assumption?
_____________________________________________________________________________________________________________________________________________________________________________________________________________________________________________________________________________________________
Extension:
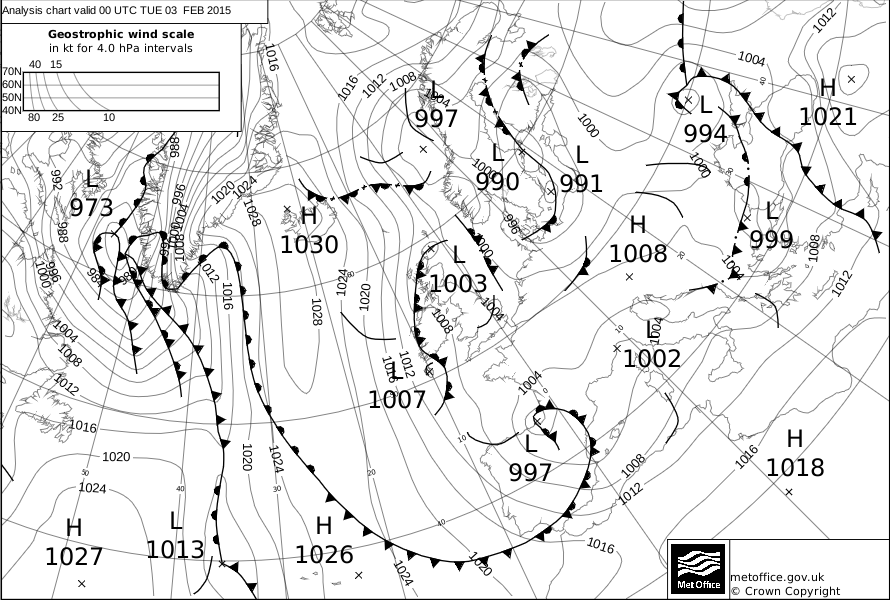
Here are the weather maps for 4 of the days when it rained: the first 3 show when the pressure was low and the 4th shows when the pressure was high and it rained.
1)
2)
3)
4)

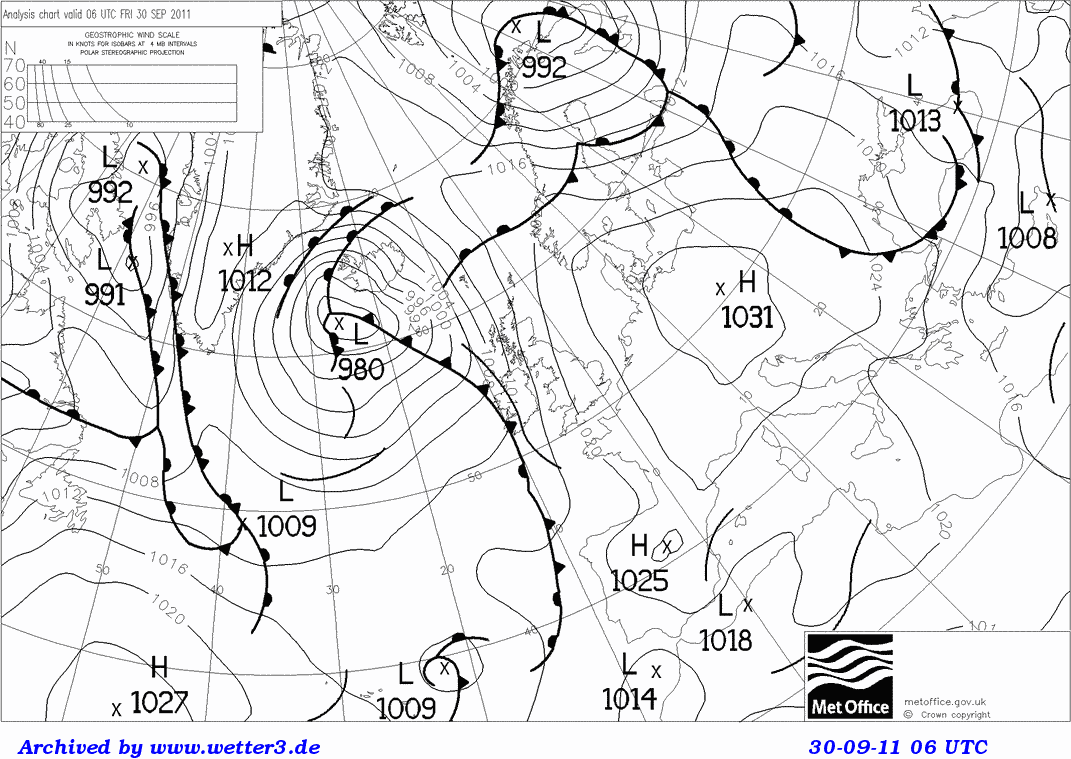
Pick one of the synoptic charts below. Can you work out where the wind over the UK is coming from? Try to ignore any fronts, and don’t think about how things might have changed in the past or be about to change in the future.
Now answer the following questions:
What is the wind direction over the UK?_______________
What is the air mass affecting the UK?_________________
Describe the weather, in terms of wind speed, direction, temperature, cloud and precipitation.
____________________________________________________________________________________________________________________________________________________________________________________________________________________________________________________
Would you expect any difference in the weather between day and night? __________________________________________________________________________________________________
Would you expect any difference in the weather between the sea/ the windward coast and inland regions? ____________________________________________________________________________________________________________________________________________________________
February 2015
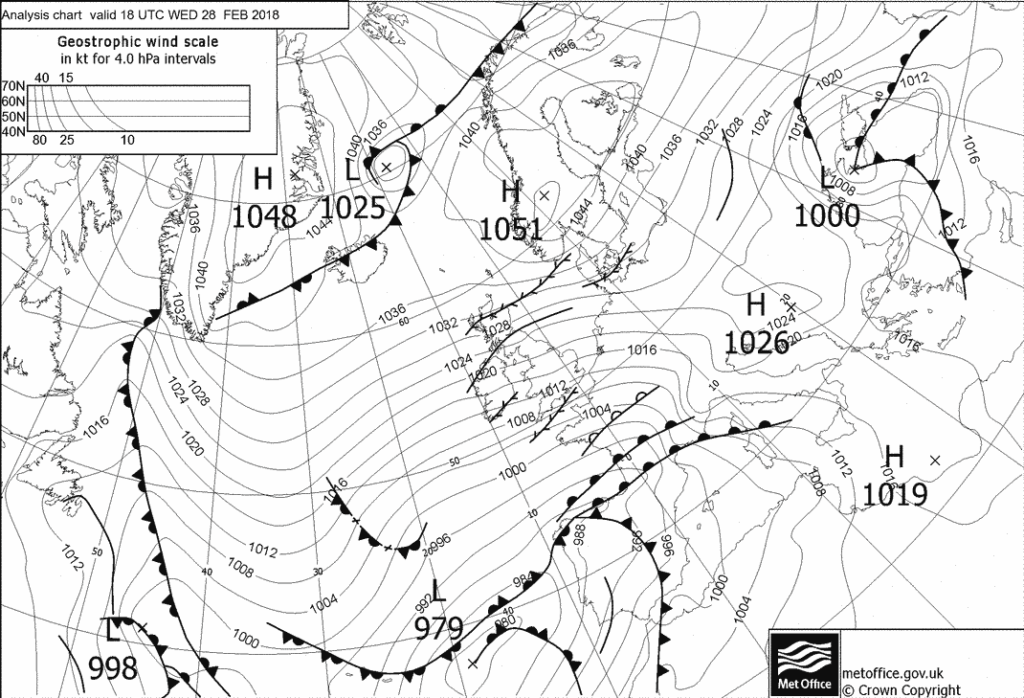
February 2018
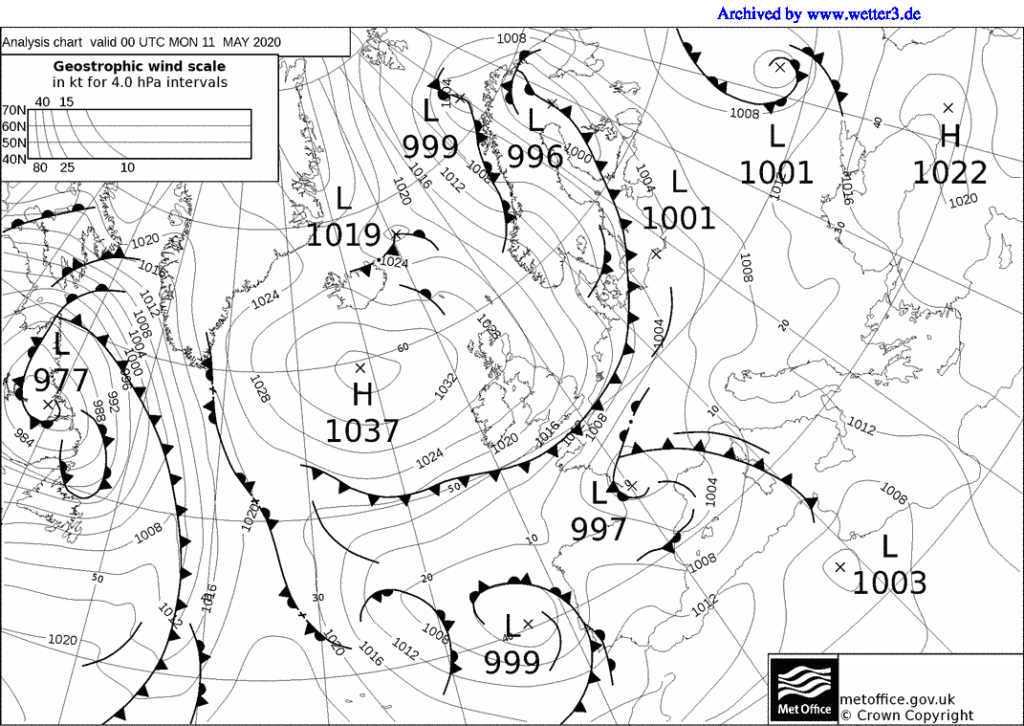
May 2020

October 2011
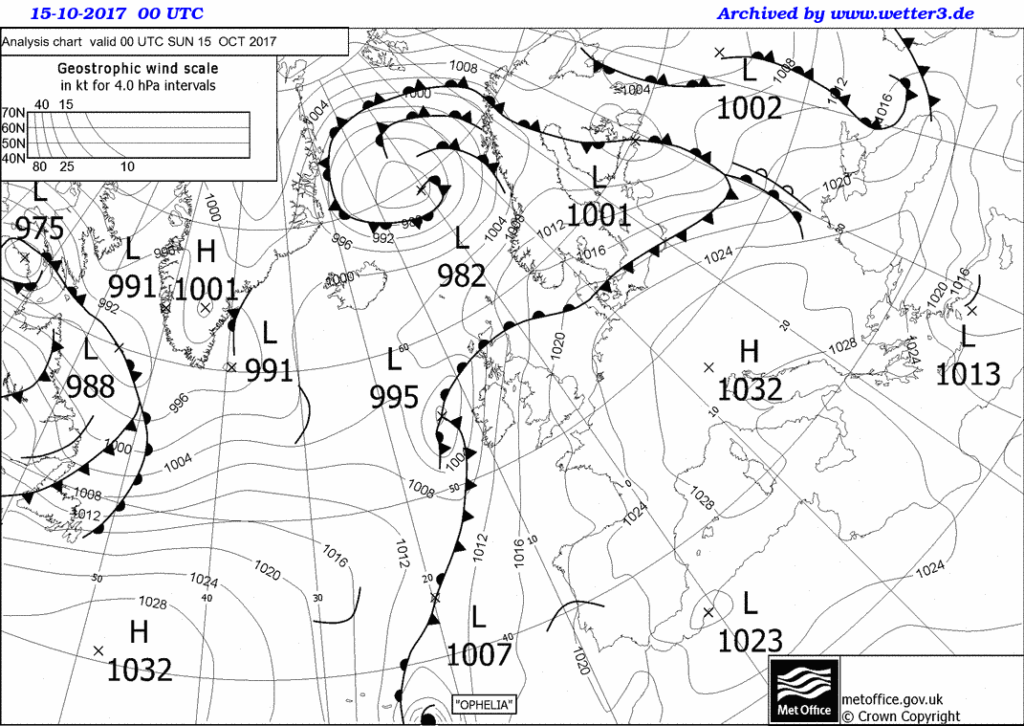
October 2017
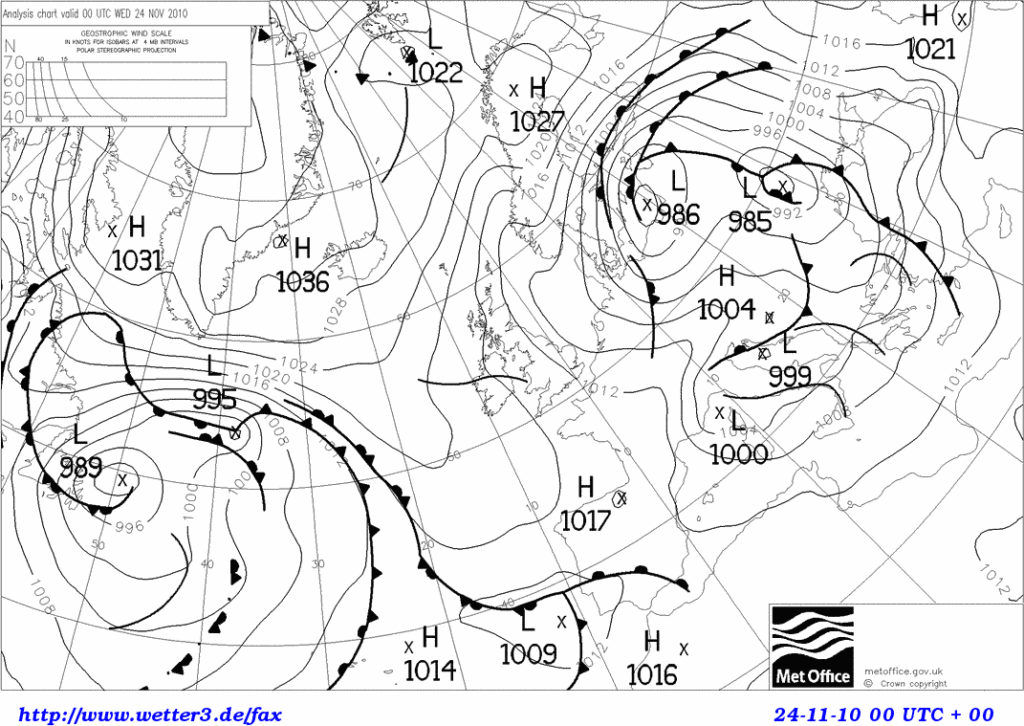
November 2010
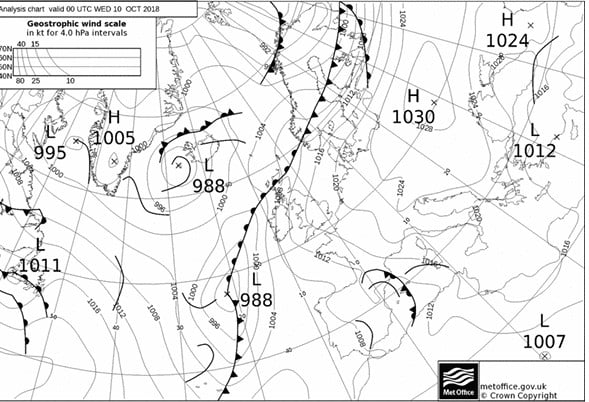
October 2018
May/ June 2023
Go outside, and chalk the outline of the world’s continents on a suitable surface
Add board game style places to the map, as shown below:
Assign 4 students to be one each of tropical maritime, tropical continental, polar maritime and polar continental air. Ask them to go and stand on their starting position (bold circles above).
They take it in turns to move one position closer to the UK.
Print each of these statements and distribute them amongst your students. Ask them to give one to the appropriate air mass when they think it is appropriate (you can’t have 2 identical statements join an air mass at the same time):
To start with, I am cold
To start with, I am cold
To start with, I am warm
To start with, I am warm
I have travelled South, moving over a warmer part of the Earth’s surface
I have travelled South, moving over a warmer part of the Earth’s surface
I have travelled South, moving over a warmer part of the Earth’s surface
I have travelled South, moving over a warmer part of the Earth’s surface
I have travelled South, moving over a warmer part of the Earth’s surface
I have travelled South, moving over a warmer part of the Earth’s surface
I have picked up heat
I have picked up heat
I have picked up heat
I have picked up heat
I have picked up heat
I have picked up heat
I have cooled down
I have cooled down
I have cooled down
I have cooled down
I have cooled down
I have cooled down
I have travelled North, moving over a colder part of the Earth’s surface
I have travelled North, moving over a colder part of the Earth’s surface
I have travelled North, moving over a colder part of the Earth’s surface
I have travelled North, moving over a colder part of the Earth’s surface
I have travelled North, moving over a colder part of the Earth’s surface
I have travelled North, moving over a colder part of the Earth’s surface
I have picked up moisture
I have picked up moisture
I have picked up moisture
I have picked up moisture
I have picked up moisture
I have picked up moisture
I have picked up moisture
I have picked up moisture
I have deposited moisture
Convective cloud can form
Convective cloud can form
Convective cloud can form
Convective cloud can form
Layer cloud can form
Layer cloud can form
Layer cloud can form
Layer cloud can form
It is raining in heavy showers
It is raining in heavy showers
It is raining in heavy showers
It is drizzling
It is drizzling
There may be a summer thunderstorm
At the end, have a look at the statements the air masses have ended up with, and discuss whether it looks right.
The statements provided are the correct number, but you could always throw a few extra in for more debate!
Suggested Solution
Tropical maritime
To start with, I am warm
I have travelled North, moving over a colder part of the Earth’s surface
I have cooled down
I have picked up moisture
Layer cloud can form
I have travelled North, moving over a colder part of the Earth’s surface
I have cooled down
I have picked up moisture
Layer cloud can form
It is drizzling
I have travelled North, moving over a colder part of the Earth’s surface
I have cooled down
I have picked up moisture
Layer cloud can form
It is drizzling
Tropical Continental
To start with, I am warm
I have travelled North, moving over a colder part of the Earth’s surface
I have cooled down
I have travelled North, moving over a colder part of the Earth’s surface
I have cooled down
I have picked up moisture
Layer cloud can form
I have travelled North, moving over a colder part of the Earth’s surface
I have cooled down
There may be a summer thunderstorm
I have deposited moisture
Polar Maritime
To start with, I am cold
I have travelled South, moving over a warmer part of the Earth’s surface
I have picked up heat
I have picked up moisture
Convective cloud can form
It is raining in heavy showers
I have travelled South, moving over a warmer part of the Earth’s surface
I have picked up moisture
I have picked up heat
Convective cloud can form
It is raining in heavy showers
I have travelled South, moving over a warmer part of the Earth’s surface
I have picked up heat
I have picked up moisture
Convective cloud can form
It is raining in heavy showers
Polar Continental
To start with, I am cold
I have travelled South, moving over a warmer part of the Earth’s surface
I have picked up heat
I have travelled South, moving over a warmer part of the Earth’s surface
I have picked up heat
I have travelled South, moving over a warmer part of the Earth’s surface
I have picked up heat
I have picked up moisture
Convective cloud can form
(you could have a heavy showers statement here)
Use this Global Atmospheric Circulation practice exercise.
Changes to the Global Atmospheric Circulation as the climate changes.
Other Useful Links

Air masses and fronts – introductory text
Air Masses – an introduction to the major air masses affecting the UK
Case studies of UK air masses (November 2010, November 2011 and the end of September 2010) with answers for teachers and a case study of arctic maritime air (Jan/ Feb 2015) can be found on our case studies page.
Air Masses – worksheet and the Met Office’s air mass video .
AWS data to study air masses and depressions (adapted from LGfL)
Resources to teach the climate of the last 2.6 million years.
Climate negotiations resource:
https://www.youtube.com/watch?v=Cn-ZqGJxpk4&
A case study of orographic rainfall in Scotland with images for students Image 1, Image 2, Image 3, Image 4, Image 5.
An introduction to weather systems
Anticyclones, depressions and fronts
Understanding weather charts – excercises
Weather systems plenary, revision or homework exercise – an investigation into why the forecast showed the temperature rising at night.
What is the weather? Work out what the weather is like at several UK locations based on some simplified weather maps.
Isotherm and Isobar drawing exercise based on a depression: student worksheet. A simpler version of the T/ isotherm map can be found here or the full version including solutions may be found on the A level page.
Using WOW data to investigate a depression passing across the UK with worksheets for students
Use WOW data to track a cold front across the UK and work out its speed.
Weather Maps – basic information on synoptic charts, with Isotherm map excercise and Synoptic chart excercise.
We’ve pulled together some resources about ex-hurricane Ophelia, bringing together information about tropical cyclones, depressions, anticyclones and air masses to explore the extremely unusual weather we experienced in October 2017 Ophelia.pptx.
Using GIS to study hurricane tracks and tropical storm risk (developed by Bob Lang, teacher and GA consultant)
Some useful links about Super typhoon Haiyan/ Yolanda
Urban Heat Island Fieldwork and a simple and effective lesson plan which uses WOW data to identify Urban Heat Islands. The supporting PowerPoint presentations can be found here.
A wide range of animations from the Met Office suitable for geography and science topics.
Resources looking at change of state, latent heat, data handling and the Electromagnetic Spectrum from the NCAS/ DIAMET project (scroll down to the bottom of the page).
An excellent resource (first published by the GA) investigating weather conditions needed for the various Olympic sporting events using weather station or WOW data.
Pathway: Basic weather
Weather and Climate – Atmospheric and Oceanic Circulation – Climate Zones – Air Masses
Lesson overview: In this lesson we investigate
the characteristics of the major air masses which can affect the British Isles
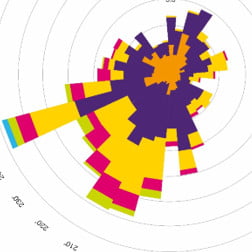
and introduce wind roses to investigate common wind directions and associated
air masses.
Air masses are large volumes of air that have relatively uniform characteristics and can extend over hundreds of miles. Classified according to the region in which they formed and the path they take to reach us, air masses strongly influence the weather we experience in the UK. Air masses that affect the UK are predominantly Polar maritime and Tropical maritime but also Polar continental, Tropical continental and Arctic maritime. The source regions of air masses are the high pressure regions associated with the Global Atmospheric Circulation. One air mass brings different weather to different parts of the country, for instance warming as they travel southwards, or drying out as they progress over land. The temperature and humidity characteristics of air masses will change with climate change.
Learning objectives:
To be able to describe the five major air masses that affect the UK.
To be able to draw and interpret a wind-rose diagram.
To be able to describe and explain the weather associated with different air masses and how they affect day-to-day life in the UK.
Key Teaching Resources
Air Masses PowerPoint
Air Masses PowerPoint (easier)
Air Masses Information Sheet
Wind Rose
Air Masses Table
Air Masses Table (easier)
Teacher CPD/ Extended Reading
Read
Air Masses – More for Teachers
Or watch
A Blog post with simple animations also in the context of a short explainer YouTube video.
Alternative or Extension Resources
Air Masses – a Human Board Game
Air Masses – identifying case studies on Synoptic charts (advanced)
The vertical structure of the atmosphere
Unequal heating of the Earth’s surface
Definition and history of the Earth’s atmosphere
An atmosphere is defined as the gaseous envelope that surrounds a celestial body. Therefore, the Earth, like other planets in the solar system, has an atmosphere, which is retained by gravitational attraction and largely rotates with it.
Compared with the radius of the Earth, its atmosphere is very thin. 99% of the mass of the atmosphere lies below 30 km, or 0.5% of the equatorial radius.
Meteorology is the subject that studies the chemical and physical properties of the atmosphere together with its fields of motion, mass and moisture.
At the time of the Earth’s formation around 4.5 billion years ago there was probably no atmosphere. It is believed to have come into existence as a result of the volcanic expulsion of substances from its interior, ejecting mainly water vapour, with some carbon dioxide, nitrogen and sulphur. The atmosphere can only hold a certain amount of water vapour, so the excess condensed into liquid water to form the oceans.
It is thought that the first stage in the evolution of life, around 4,000,000,000 years ago, required an oxygen-free environment. At a later date, primitive forms of plant life developed in the oceans and began to release small amounts of oxygen into the atmosphere as a waste product from the cycle of photosynthesis, as shown by the following equation.
H2O + CO2 + sunlight → sugar + O2
This build-up of atmospheric oxygen eventually led to the formation of the ozone layer. This layer, approximately 8 to 30 km above the surface, helps to filter the ultraviolet portion of the incoming solar radiation spectrum. Therefore, as levels of harmful ultraviolet radiation decreased, so plants were able to move to progressively higher levels in the oceans.
This helped to boost photosynthesis and thereby the production of oxygen. Today, this element has reached levels where life has been sustainable on the surface of the planet through its presence, and it should be remembered that oxygen is an element which is not commonly found in the universe.
The atmosphere is well mixed below 100 km, and apart from its highly variable water vapour and ozone contents, its composition is as shown below, excluding solid and liquid matter in suspension (aerosols).
| COMPOSITION OF THE ATMOSPHERE | |||
Gas | Symbol | % by weight | % by volume |
Nitrogen | N2 | 75.52 | 78.09 |
Oxygen | O2 | 23.15 | 20.95 |
Argon | A | 1.28 | 0.93 |
Carbon dioxide | CO2 | 0.046 | 0.035 |
Neon | Ne | 0.012 | 0.0018 |
Helium | He | 0.0007 | 0.0005 |
Methane | CH4 | 0.0008 | 0.00015 |
Krypton | Kr | 0.003 | 0.0001 |
Ozone | O3 | 0-0.01 | Variable |
Water vapour | H20 | 0-4 | Variable |
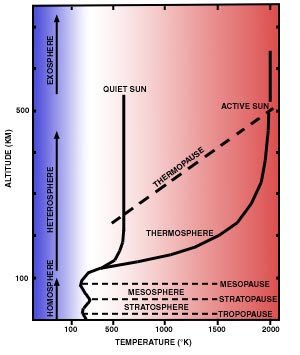
The vertical structure of the atmosphere
The Earth’s atmosphere is most commonly divided into four isothermal layers or ‘spheres’: troposphere, stratosphere, mesosphere and thermosphere.
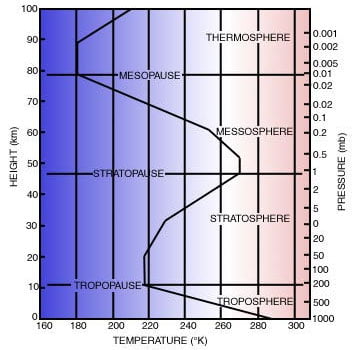 Fig 1: Vertical temperature profile of the ICAO Standard Atmosphere
Each layer is characterised by a uniform change in temperature with increasing altitude. In some layers there is an increase in temperature with altitude, whilst in others it decreases with increasing altitude. The top or boundary of each layer is denoted by a ‘pause’ where the temperature profile abruptly changes, as shown in Figure 1.
The troposphere contains about 80% of the atmosphere and is the part of the atmosphere in which we live, and make weather observations. In this layer, average temperatures decrease with height. This is known as adiabatic cooling, i.e. a change in temperature caused by a decrease in pressure. Even so, it is still more prone to vertical mixing by convective and turbulent transfer, than other parts of the atmosphere. These vertical motions and the abundance of water vapour make it the home of all important weather phenomena.
The troposphere’s thermal profile is largely the result of the heating of the Earth’s surface by incoming solar radiation. Heat is then transferred up through the troposphere by a combination of convective and turbulent transfer. This is in direct contrast with the stratosphere, where warming is the result of the direct absorption of solar radiation.
The troposphere is around 16 km high at the equator, with the temperature at the tropopause around -80 °C. At the poles, the troposphere reaches a height of around 8 km, with the temperature of the tropopause around -40 °C in summer and -60 °C in winter.
Therefore, despite the higher surface temperatures, the tropical tropopause is much cooler than at the poles.
In contrast to the troposphere, temperatures in the stratosphere rise with increasing altitude. Another distinctive feature of the stratosphere is the absorption of ultraviolet radiation by ozone (O3). This is greatest around 50 km, which is where the stratopause occurs. Temperatures reach a maximum here, and according to latitude and season, they range from -30 °C over the winter pole to +20 °C over the summer pole.
As well as a noticeable change in temperature, the move from the troposphere into the stratosphere is also marked by an abrupt change in the concentrations of the variable trace constituents. Water vapour decreases sharply, whilst ozone concentrations increase. These strong contrasts in concentrations are a reflection of little mixing between the moist, ozone-poor troposphere and the dry, ozone-rich stratosphere.
Despite the dryness of the stratosphere, some clouds have developed in winter months over high latitudes at altitudes between 17 and 30 km, stretching into the stratosphere. They generally display iridescence and are known as nacreous clouds.
The stratosphere extends up to around 48 km above the surface, and together with the troposphere, they account for 99.9% of the Earth’s atmosphere.
Temperatures in the mesosphere decrease with height from the stratopause up to the mesopause, at around 85 km. Temperatures at the mesopause vary from as low as -120 °C at high latitudes in summer to -50 °C in winter. The cold summer temperatures and the warm winter temperatures are therefore a reverse of what happens at the stratopause.
As in the troposphere, the unstable profile means that the vertical motions are not inhibited. During the summer, there is enough lifting to produce clouds in the upper mesosphere at high latitudes – it is then that the stratopause achieves its highest temperature due to the optimum amount of solar radiation being received. These clouds are known as noctilucent, and are very thin. Even so, they are visible against a night sky when the sun is at a small angle below the horizon, so that they are high enough to be in sunlight. By using triangulation techniques, these clouds have been estimated to form up to 80 km above the surface.
The thermosphere extends upwards to altitudes of several hundred kilometres, where temperatures range from 500 K to as high as 2,000 K (Kelvin), depending on the degree of solar activity. The temperature changes between day and night amount to hundreds of degrees. The height of the thermopause varies from about 200 to 500 km, again depending on solar activity. Above 500 km temperatures are very difficult to define. Molecules are so widely spaced that they move independently, and there is no reason why their temperatures should be the same.
Unequal heating of the Earth’s surface
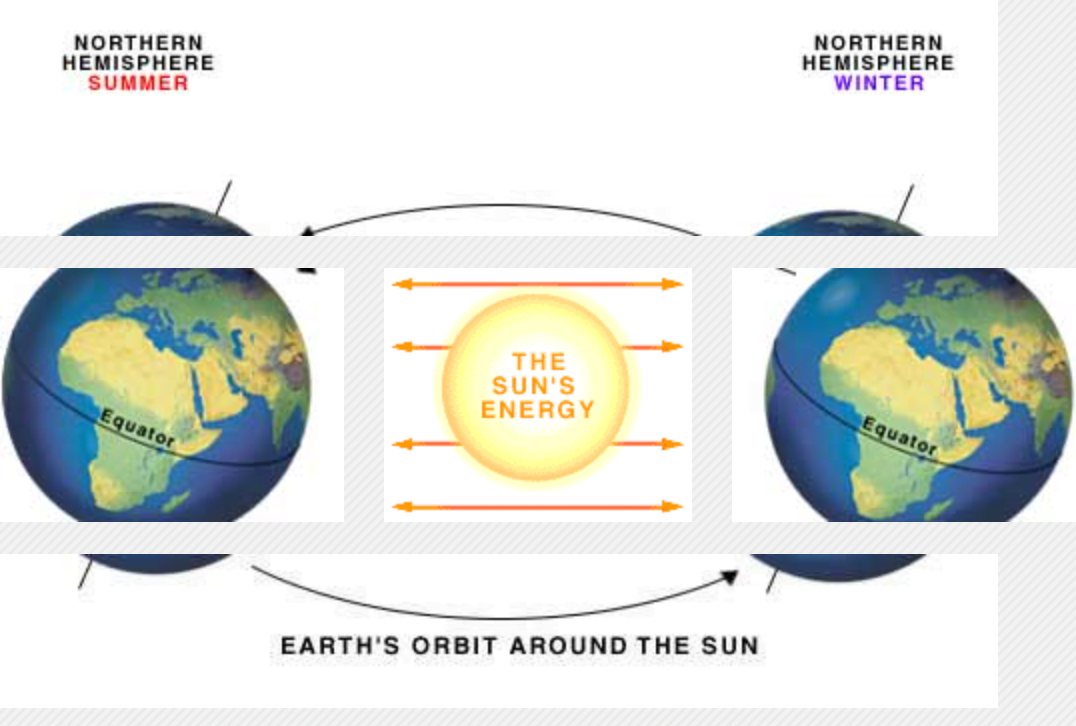
There are many reasons which explain the unequal or differential heating from pole to pole of the Earth’s surface. The principal factor is the change in the Sun’s elevation due to the latitude and season. The Earth orbits the Sun approximately every 365 days. The Earth also rotates on its own axis once every 24 hours, giving us our daily and diurnal variation. As the Earth orbits the Sun, we get seasonal variations which result from changes in the amount of solar radiation reaching each part of the Earth, hence the variation between daylight and darkness throughout the year.
The Earth’s rotational axis is not vertical, but tilted at an angle of 23.5° to the vertical. Because of this the apparent motion of the overhead sun appears to move from the Tropic of Cancer (23.5° N) at northern hemisphere midsummer (21-22 June) to the Tropic of Capricorn (23.5° S) at northern mid winter (21-22 December). Summer/winter alternate as the northern and southern hemispheres are alternately tilted towards/away from the Sun.
If the Earth did not tilt on its axis, there would be no seasons at all, and most places, except the poles, would have 12 hours daylight each day throughout the year.
Every year the polar areas have at least one complete 24-hour period of darkness and one of daylight. In theory, the poles themselves should have six months of daylight followed by six months of darkness. In reality, this is not the case because some light from the Sun is bent towards the Earth making nights slightly shorter than they otherwise would be.
The equatorial regions do not really have seasons as we know them, as the relative position of the overhead Sun does not change significantly enough throughout the year.
At high latitudes the Sun’s rays reach the Earth’s surface more obliquely, so that the energy is spread over a greater surface area. In addition, more radiation is lost to scattering and absorption as the path through the atmosphere is longer. In the winter at high latitudes, days are short with continuous darkness in polar regions at mid-winter. Here there is a net loss of outgoing long-wave radiation into space with no incoming short-wave radiation to compensate. Nearer the equator, where the sun is near the vertical, at midday the sun’s rays strike with greater intensity, as shown in Figure 4.

A and B are equal and parallel clusters of light rays from the Sun. At A the Sun is overhead and the rays are at right angles to the atmosphere and the surface of the Earth. At B the rays approach the atmosphere from an angle and consequently have more atmosphere to travel through – distance A compared with distance B on Figure 4. Also, being at an angle illuminates a larger surface area of the Earth’s surface. Effectively the energy arriving has to be distributed over a greater area from source B compared with source A.
Another contributory factor in determining the weather and climate is the amount of the Sun’s energy which is absorbed by the Earth’s surface. The amount of reflection by the Earth’s surface is known as albedo. The lower the albedo of a particular surface the more solar radiation is absorbed. The polar ice sheets reflect incoming short-wave radiation so effectively that there is little heat available for a rise in temperature. Deserts, on the other hand, reflect only about 25% of radiation from the Sun and consequently the high rate of absorption means they can get very hot.
| TYPICAL ALBEDOS (%) | |
| Surface type | Albedo |
| Water (solar elevation 90°) | 3 |
| Water (solar elevation 30°) | 7 |
| Water (solar elevation 10°) | 24 |
| Sea ice | 30-40 |
| Fresh snow | 75-95 |
| Old snow | 55 |
| Forests | 5-10 |
| Dry sand | 20-30 |
| Dark soil | 5-15 |
| Grassland | 15-20 |
| Thin cloud | 35-50 |
| Thick cloud | 70-90 |
The amount of albedo can also depend on the angle of the Sun’s rays. For example when the Sun is high in the sky, the sea absorbs much of the radiation, when it is low in the sky the sea acts rather like a mirror, reflecting most of the incoming radiation. More solar radiation reaches the atmosphere above the summer pole during the continuous daylight period than reaches the atmosphere at the equator. The high albedo and low angle of the sun ensure that this is spread out over a larger angle than at the equator, reducing its heating effect, and a significant proportion of what reaches the surface is reflected back into space. Total planetary albedo is estimated at around 40%, so four tenths of the incoming radiation is reflected back into space.
The next question which needs answering is why do the poles get colder and colder, whilst the equator gets hotter and hotter? The answer involves the presence of water and the general circulation of air.
Without water in the atmosphere there would be no weather, no rain, no snow, or even clouds. Water, in the form of water vapour in the atmosphere, or currents in the ocean is responsible for transferring heat energy from the equator towards the poles.
Water is the only substance to occur naturally in the atmosphere as either a solid (ice), liquid (water, rain) and a gas (water vapour). The energy absorbed and released during its changes from one state to another is the main method of energy transfer in the atmosphere.
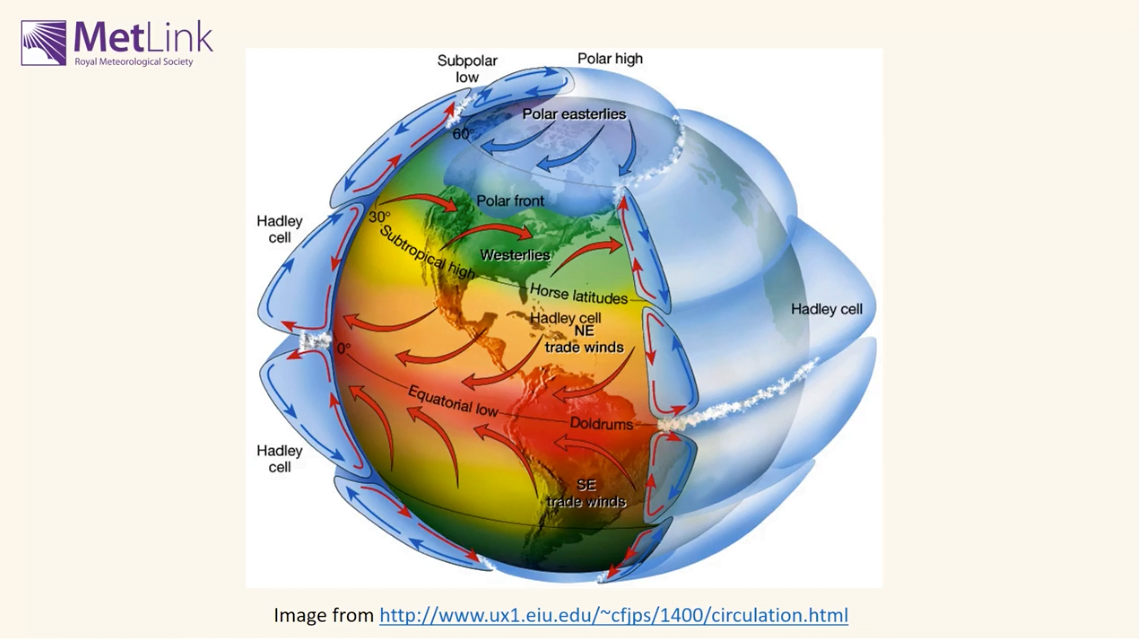
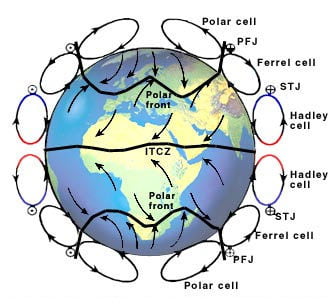
High temperatures over the equator and low temperatures over the poles result in a series of circulatory cells which form part of a theory known as the tricellular model. There is an added complication to this model in that the Earth is rotating. This has the effect of splitting the circulation between the equator and the poles into three cell zones – the Hadley, Ferrel and Polar (see Figure 5).
Within the equatorial region, surface air rises and flows towards the poles. At about 30° latitude, the air starts to descend, with the returning branch flowing at the surface toward the equator. However, the Coriolis force acts upon this surface flow, deflecting the air to the right (east) in the northern hemisphere and to the left (west) in the southern hemisphere. The resulting surface winds are named the trade winds, because of the important role they played in opening up the New World to trade. The cell in the tri-cellular model, closest to the equator, is named after the English meteorologist, George Hadley (1685-1768) who first postulated the existence of the cell to explain these trade winds. In doing so, he clearly recognised the importance of what much later was to be named the Coriolis force.
Between the Hadley cell and the Polar cell is the Ferrel Cell – named after William Ferrel, an American meteorologist. This cell lies between about 30° to about 60° latitude, and it is not directly thermally driven (as it is in the opposite direction to the Hadley cell and the Polar cell). It represents an area of cyclonic disturbances that intermittently transport heat and westerly momentum between the tropical cell and polar regions. The British Isles lie within the area of influence of the Ferrel cell.
Low pressure regions exist at points where air rises. These occur where:
High pressure occurs where air descends. There are two main areas of descending air, compensating for the rising air of low pressure.
In both regions, the amounts of precipitation are rather small. The hot deserts are to be found in the region of the subtropical high, whilst the polar regions are rather dry because evaporation is rather slow and precipitation remains on the ground for some time.
1. Define the term ‘atmosphere’.
2. Explain how photosynthesis allowed the initial release of oxygen, allowing the Earth’s atmosphere to form.
3. What is ozone? What important role does it perform?
4. Which of the following are the two major gases in the Earth’s atmosphere; nitrogen, hydrogen, oxygen, methane or carbon dioxide?
5. Arrange the following atmospheric layers into the correct order, starting with the layer, nearest the Earth’s surface; mesosphere, stratosphere, troposphere, thermosphere.
6. What is meant by the term ‘adiabatic cooling’?
7. How high is the troposphere over the equator; 4, 8, 16 or 32 km?
8. Do temperatures increase, or decrease with increasing altitude, in the stratosphere?
9. How high is the troposphere over the poles; 4, 8, 16 or 32 km?
10. Explain the differences between nacreous and noctilucent clouds.
11. Describe how the Earth’s tilt and rotational axis causes differences in the amount of heat received at the Earth’s surface.
12. What is albedo? How does it vary with different types of surface?
13. What are trade winds?
14. Describe the factors which cause:
(a) high pressure, and
(b) low pressure.
Web page reproduced with the kind permission of the Met Office