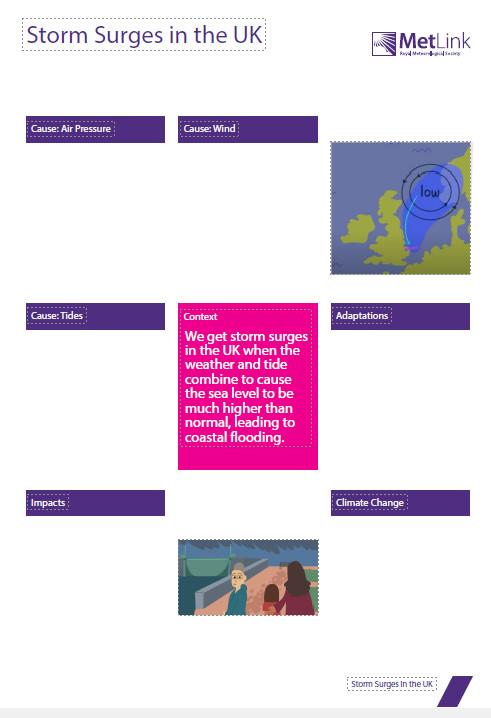

Watch this short animation to learn about the causes and impacts of storm surges in the UK, as well as the expected impact of climate change on them.
At the bottom of the page, you can download a Knowledge Organiser to complement the animation.
With thanks to the students and staff at Boston College for their contribution to the animation.


A diverse range of questions based on applications of physics in weather and climate, including sea level rise, radar frequencies, aerosols, oceanic circulation, tidal barrages etc.
Isaac Physics is an online study tool developed by the University of Cambridge. Isaac Physics questions are self marking practice questions for secondary school and undergraduate scientists.
Isotrope Concentrations and Ocean Circulation
Radar wavelengths and frequencies
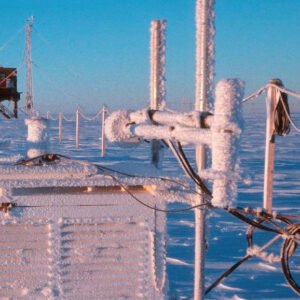
Some ideas, data sources and guidance for students wishing to include weather measurements in their NEA or EPQ.
Updated November 2022
https://www.rgs.org/CMSPages/GetFile.aspx?nodeguid=59f46632-ae51-4ea7-ab94-a0c537eb3c71&lang=en-GB
https://www.metlink.org/wp-content/uploads/2020/12/depression_wow_teacher_Eva.pdf
Data source:
Data source: http://wow.metoffice.gov.uk
Using Wow data to look at urban heat islands https://www.metlink.org/resource/using-wow-to-illustrate-the-urban-heat-island-effect/
Urban winds: fieldwork guidance can be found on https://www.metlink.org/fieldwork-resource/fieldwork-in-geography/
Urban temperature https://www.metlink.org/fieldwork-resource/urban-heat-island-introduction/
Data source: http://wow.metoffice.gov.uk
https://www.metlink.org/fieldwork-resource/using-usb-temperature-dataloggers/
https://www.rgs.org/schools/teaching-resources/quick-and-easy-ideas/
Data source: http://wow.metoffice.gov.uk
https://www.manchester.ac.uk/discover/news/tuesday-wettest-day-of-week-suggests-new-analysis/
https://rmets.onlinelibrary.wiley.com/doi/10.1002/joc.2321
Orographic rainfall https://www.metlink.org/resource/orographic-relief-rainfall-and-the-foehn-effect/
https://www.metlink.org/resource/red-sky-teachers/ with an introductory concept cartoon from the ASE
https://www.metlink.org/blog/folklore/weather-folklore/
https://www.metlink.org/blog/extreme-weather/when-will-it-snow/
https://www.exploringoverland.com/constantapprentice/2021/8/10/making-a-cyanometer-to-measure-sky-moisture-through-color with https://uk-air.defra.gov.uk/interactive-map pollution forecast and pollen forecast http://www.metoffice.gov.uk/health/public/pollen-forecast
Data source: National River Flow Archive http://nrfa.ceh.ac.uk/ and https://environment.data.gov.uk/hydrology/index.html#/landing
http://www.coolgeography.co.uk/GCSE/AQA/Coastal%20Zone/Sea%20level%20rise/Sea%20level%20rise.htm
Data source: http://wow.metoffice.gov.uk
https://earth.nullschool.net/
http://www1.wetter3.de/Archiv/archiv_ukmet.html
various links on https://www.metlink.org/teaching-resources/?_sft_topic=air-masses
including https://www.metlink.org/resource/pressure-and-rainfall/
Data source: http://wow.metoffice.gov.uk
https://www.metlink.org/fieldwork-resource/instruments-and-fieldwork/
https://www.rgs.org/schools/teaching-resources/key-stage-five/extreme-weather/
https://www.metlink.org/fieldwork/
https://www.rgs.org/schools/teaching-resources/a-student-guide-to-the-a-level-independent-investi/
https://www.field-studies-council.org/resources/16-18-geography/route-to-enquiry/


These resources are designed to be used in one session with year 6 (10/ 11 year old) students. Although they will support numeracy, literacy and various other aspects of the curriculum, they are designed to prepare students for secondary school rather than support the year 6 curriculum.
There are 6 suggested activities. Although they are designed to be run sequentially, you may choose to use only some of the activities, or to supplement them with your own ideas.
You may like to ask them to summarise their learning after each activity – this could be on post it notes on a cloud, or …
It should be possible to use these activities with any class size.
Many people, including Ellie Highwood, Cristina Charlton-Perez, Helen Johnson and Laila Gohar, have contributed to these resources.
Time: 30 minutes
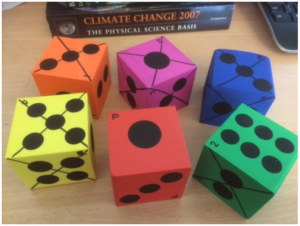
You will need: Weather or Climate.pptx, one printed copy of Weather or Climate.docx for each pair of students and two dice per pair of students.
a) Show the images in the PowerPoint presentation and ask the students what each image shows and whether it is ‘weather’ or ‘climate’. Some may not have a clear answer!
b) Ask the students to get into pairs and give each pair one sheet and two dice.
c) Give them 5 minutes to roll both dice and record the combined score each time they roll as a tally chart.
d) Optional: ask them to turn this tally into a bar chart on the graph paper provided.
e) Can they predict what number they would roll next, if they had the chance?
f) Talk about how the graph shows the most likely score (the climate) but also the complete range of possible scores (the weather). What scores are ‘extreme’?
g) What happens to the numbers if the ‘1’ on one of the dice is changed into a ‘7’?
Time: 30 minutes
You will need: 120 multicoloured lollipop sticks (at least 10 sticks each of 6 colours), Climate_Change_Picture.pptx, lollipop.xls, blue tack or similar
Note: this probably works best with groups of about 6 students working on each graph, with larger groups more teacher involvement will be required to keep the whole group engaged.
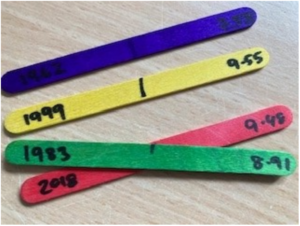
a) Before the event, mark on the middle of each lollipop stick. On each stick, write the year and the temperature for one of the data points in the spreadsheet (e.g. 1970 14.47), differentiating between global and CET data. Use a different coloured lollipop for each decade – so the 60s are all one colour etc.
b) You’ll also need to print a blank graph – the document supplied will work on A3 paper.
c) Divide the students into two groups. Within each group, divide out the lollipop sticks.
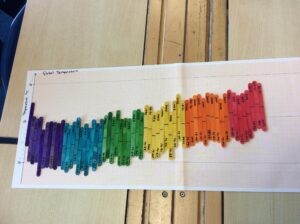
d) They should then work together to stick the sticks to the graphs in the right places, using the line in the middle of the stick as the marker.
e) Whilst doing so, they can look at years that mean something to them – the year they were born, their parents were born etc.
f) When they’ve finished, ask them to complete the table on the ppt
g) What does their graph show? What surprises them? What are the similarities and differences between the graphs?
h) Optional: take the sticks back off the graph and, within their groups, line the sticks up in temperature order with the coldest on the left and the warmest on the right. What does this show?
Time: 30 – 60 minutes
You will need: Lucky dip bag of things that have some link (vague or otherwise) to climate change. Each group takes an object, and then together works out what the connection is. After 10 mins groups swap
objects until all groups have seen all objects. (You could make a simple worksheet with a box for them to write their ideas for each item).
At the end – ask for feedback on each object and give them the “correct answer” – this can take a while – if you have 4 objects, this would make a 60 minute activity. I think they lose interest after 4 objects.
Example objects, depending on what you have available. Try and use objects which have both obvious and higher level ideas associated with them. Try and balance ‘doom and gloom’ with ‘opportunity and hope’ ideas.
Toy car: Emissions of greenhouse gases, also ozone and air pollution. Move talk
onto electric vehicles, nighttime charging etc.
Tree ring slice: Tree rings are an indirect way of measuring our climate etc, trees remove
carbon dioxide from the atmosphere, forestation and deforestation.
Cuddly cow: Methane – but you could also talk about the climate impact of beef etc. as
that is now much more talked about.
Butterfly brooch: Most of the kids talk about different species adapting to climate change (they do evolution in year 6) but you can also refer to chaos and internal links between different parts of the climate system
Mini trainer shoe: Some “air” trainers used to have SF6 in which is a really strong
greenhouse gas. You could also use baby shoes to represent babies and population growth. Also transportation – where were these shoes made?
Mirror: Geo-engineering and space mirrors – but can also explain albedo in this
way.
Solar powered toy: Renewable energy sources
Windmill: Renewable energy sources, changing weather patterns
Bag of rice: Methane production, plants as absorbers of CO2
Cuddly polar bear, puffin or other iconic animal threatened by climate change.
Sponge: Link to bleaching coral reefs and plankton as photosynthesisers equivalent to land plants.
Chocolate bar: Clearing of rainforests for production and threat to cocoa plants as
temperature rises.
Bottle of frozen water: Melting glaciers and ice caps; link to albedo and positive feedback;
hydrogen fuel
Piece of charred wood: Sustainable fuels; increased forest fires.
Time: 30 minutes
You will need: money.docx printed in colour, WeatherRiskGame.pptx, 6 dice – large ones which the whole class can see work best. I got some foam ones very cheaply.
a) Before the event, mark the dice ‘p’ and 1-5. On the die marked 1, cross out or otherwise mark one side, on the die marked 2 cross out or otherwise mark two sides etc. Crossed-out sides represent good weather and sides which aren’t crossed out represent bad weather. The more sides are crossed out, the lower the chance of bad weather!
b) Use the ppt to guide the activity.
c) The students will need to get into 6 groups. Give each group one colour of money and ask them to cut it up. You should keep the ‘insured’ slips.
d) Each time you play, roll the P dice first. On the basis of which side it shows, the students should decide whether to insure their businesses or not (if a 6 is shown, then there is no chance of bad weather and presumably no-one will insure). If they choose to insure, they should pay you the appropriate sum in return for an ‘Insured’ slip. Then, roll the appropriate die (so if the P die gave a 3, next roll the die labelled 3). If a crossed-out side is rolled, then anyone who was not insured should pay you the appropriate sum.
e) Collect in all the insured slips and start again.
f) Continue until either one team, or all teams except one are out, depending on time.
Time: 2.5 hours
You will need: Laptop and projector (for PowerPoint)
Whiteboard or flipchart for recording “purchases” by teams and competition results
5 or 6 small ziplock bags containing soil or sand and representing the crops of the garden.
Large and deep plastic box for use as “lake”
Towels
Access to water
Bundles of building materials e.g. plastic straws, lolly sticks, willow sticks, elastic bands, string, corks
Tape dispenser and scissors for each team
Additional materials for teams to “purchase” e.g. small plastic bottles with lids, plastic trays, bubble wrap, bags (anything else you can think of).
Topic: Flooding and climate change, developing world, adaptation.
Skills: teamwork, raft building, communication, budgeting, testing
Based on the Flooding Gardens activity from Practical Action.
Summary:
• Short powerpoint on flooding and impact of climate change. (15 mins)
• Set up problem of agriculture in Bangladesh (5 mins)
• Design and build of floating garden rafts according to specification in the power point (see also
below) – 40 mins including one opportunity for testing design
• Public competition – 20 mins
• Final few slides on real life application – 10 mins
Plus need a bit of time to set up in advance and definitely some to pack / clear up afterwards
Raft building part:
Each team needs to build a raft that could hold a floating garden. The winner is the team that builds a raft that can hold the most weight (small bags of soil) without the top surface of the raft being inundated with water. If using the budgeting version, secondary awards for cheap designs that work (although maybe not quite as well as the expensive ones).
Students are provided with a bag containing e.g. straws, willow sticks, elastic bands, sellotape dispenser, scissors, corks, lolly sticks. These represent “free” and available materials.
Also available are plastic bottles, plastic trays, bubble wrap and anything else you can think of – but these are kept at the front and have a price attached to them. The actual value you give them is arbitrary but they are supposed to represent things that are scarce in the communities we are considering. For example, plastic bottles might represent sealed oil drums, bubble wrap might be tarpaulins etc.
(Note, all materials can and should be recovered at the end of the session – the rafts are broken down and materials reused on other occasions).
With a year 6 group, you should be able to get them to discuss and draw out their design as a team first (maybe first 10 mins of building section), then send one person to get what they need (including paying – I haven’t given them a budget as such, just kept a record of what they have “spent”, but you could give each group a fixed budget if you wanted to (and then judge your winner differently).
Time: 30 minutes
You will need: A playground. Chalk or similar. Hats or sashes (see below).
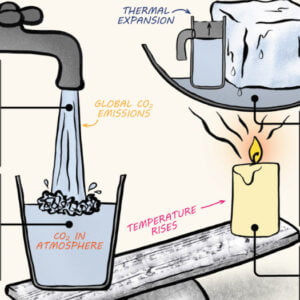
This playground game demonstrates the way Greenhouse gases return energy to the Earth’s surface – as well as allowing the students to run off some energy!
a) With chalk or similar, mark a Sun and an Earth at opposite ends of the school playground. If possible also draw a line across the playground, a third of the way between the Earth and the Sun.
b) Choose 2 students to be greenhouse gases – if possible give them a hat or sash to identify them.
Which greenhouse gases have they heard of? One could be water and the other carbon dioxide.
They are allowed to move only along the line you have drawn. Their role is to try and touch the other students as they run past but only when they are running from the Earth towards the Sun!
c) The other students are all ‘energy’ and start off by the Sun.
d) The ‘energy’ should run to the Earth and back again, repeatedly. If the ‘greenhouse gas’ students manage to touch them, then they have to run 10 times between the greenhouse gas line and the Earth before being allowed to return to the Sun.
e) After a few minutes of doing this, stop the students and increase the numbers of ‘greenhouse gas’ students – you could add a methane, or another water.
f) Again, let them play this for a while, then stop them and ask what has changed. They should notice that there is now more ‘energy’ trapped near the Earth.
g) You could increase the amount of greenhouse gas again and let them see what happens.
h) Finish by talking about how greenhouse gases are essential to maintaining our climate, but that increasing the amount of greenhouse gas leads to heating. You may need to talk a little bit about the different forms energy can take – light, heat etc.

Precipitation has been recorded in the British Isles for over 200 years. Through the dedication and enthusiasm of W R Symons, the mid-19th century saw the formation of the British Rainfall Organisation whose main objective was to establish a countrywide network of rain gauges where daily measurements were made. This network has grown to over 7,000 gauges today, including many that are automatic.
As most people in the British Isles know, precipitation can be extremely variable, both in intensity and duration. The spatial distribution of precipitation during an individual month is very uneven, just as it is on an individual day. Rainfall in Britain is associated with several distinct synoptic situations; all places may get rain from most such types, but some areas get more from some types than others. Therefore, it is not surprising that patterns of temporal variation of rainfall are complex.
Precipitation over the British Isles is the result of one or more, of three basic mechanisms.
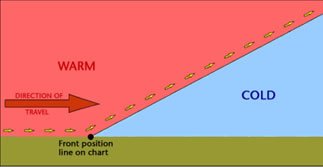
1. Cyclonic, or frontal, rain associated with the passage of low-pressure systems. Bands of rain are associated with the passage of warm and cold fronts across the UK. These rain events are caused by the uplift and cooling of moist air parcels.
2. Convectional, with local showers and thunderstorms, caused by the localised thermal heating and overheating of the ground surface. Large towering cumulonimbus clouds may be generated, producing heavy rain.
3. Orographic, or relief rain, with precipitation increasing with altitude over upland areas. The mechanism for relief rain is the uplift and cooling of moist air over upland areas. The normal rate of cooling (environmental lapse rate) is 6.5 °C per 1,000 metres. Therefore, near the summit on the windward side of the hill or mountain, the air will have cooled sufficiently for thick cloud, rain and possibly snow to fall.
Air will descend and warm on the leeward side, so there is little or no rain on this leeward side of the hill or mountain. This is called a rain shadow, and sometimes there are warm winds in these sheltered areas as the air, now much drier than during its ascent, descends quickly and warms up. This is called a föhn effect, and the warm winds are called föhn winds.
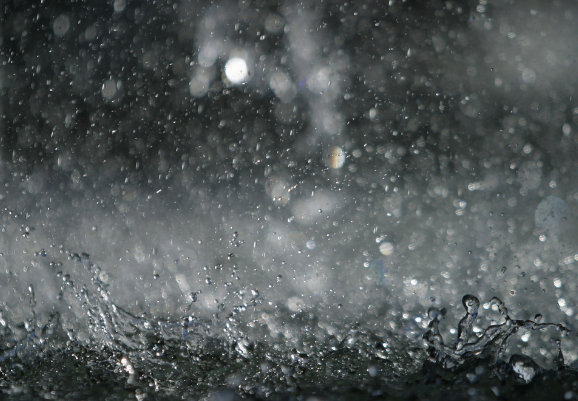
Rain forms when air cools, the rate of condensation becomes faster than the rate at which water is evaporating and cloud droplets form. If these get big enough, they form as rain – or snow, sleet or hail.
There are various ways in which the air can cool to form rain – three common types which are often talked about are frontal, orographic or relief and convective rain. Frontal Rain
This is found where warm air meets cold at the cold and warm fronts in a depression.
Convective Rain
Convection is the term given to warm air rising. Convection is normally marked by cumulus clouds which billow upwards as the air rises. The base of such clouds is usually flat, marking the level where temperatures are cold enough for more condensation to be going on than evaporation.
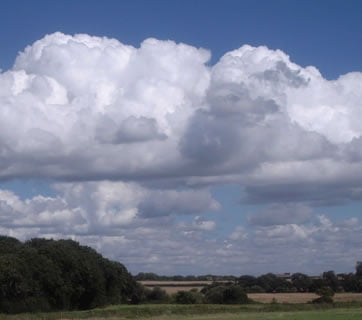
Image copyright RMetS
Extreme convection can be found in thunder clouds – towering cumulonimbus, which can reach all the way up to the top of the troposphere – the lowest 10km or so of the atmosphere in which our weather is found. As air can’t rise into the stratosphere above, the top of the cumulonimbus cloud spreads out, giving it a characteristic ‘anvil’ shaped top. Such convection can occur where the ground has become particularly warm, heating the air above it. It is particularly associated with the Tropics, characteristically giving heavy rain in the late afternoon.
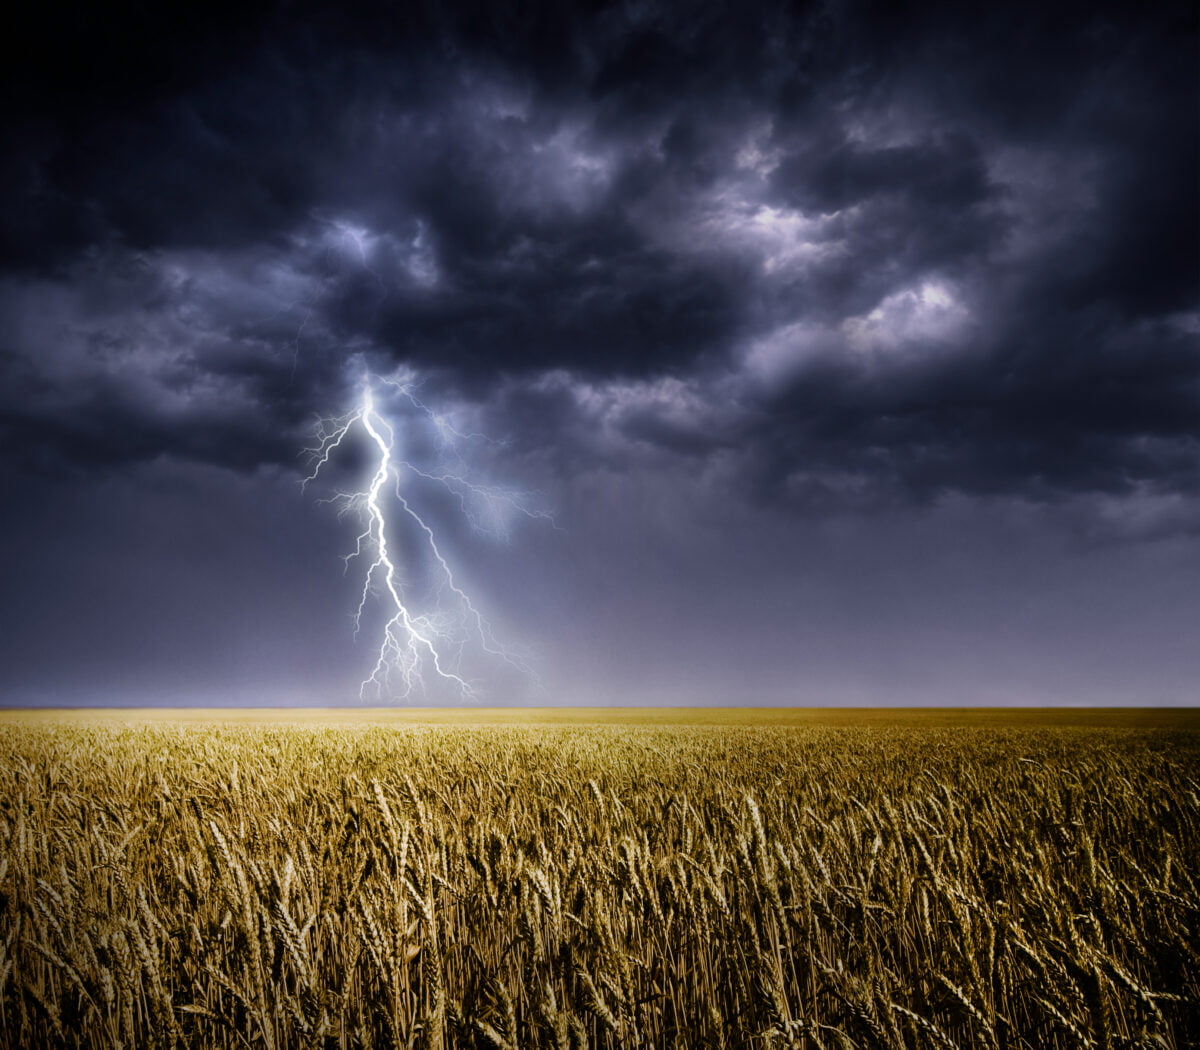
Cumulonimbus clouds can give heavy rain, hail, thunder lightning and sometimes tornadoes.

Cumulonimbus cloud over Kettering, UK, August 2014
Image copyright Sylvia Knight
Orographic or Relief Rain
When air is forced to rise over land, particularly higher ground such as hills and mountains, it cools as the pressure falls. Dry air cools at 9.8°C per 1000m it rises. Eventually, the air can cool enough for cloud to form.
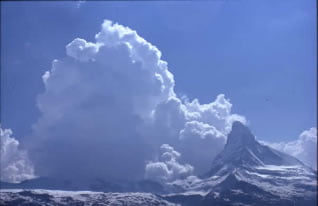
Orographic cloud forming upstream of the Matterhorn
Image copyright RMetS
The cloud droplets may get big enough to fall as rain on the upstream side of the mountain. If that happens, then, when the air has passed over the top of the mountain and starts to descend, and warm, on the far side, there will be less water to evaporate back into the air. The air will end up drier than it was on the upstream side of the mountain.
This can produce ‘rain shadow’ – an area of land downstream from some mountains (for the prevailing wind direction, in the UK, this would be to the east) where there is noticeably less rainfall. The Gobi desert in Mongolia and China is so dry because it is in the rain shadow of the Himalayas.
Orography can enhance frontal or convective rain; for example, we have explored how polar maritime air, our prevailing air mass, brings convective rain to the Atlantic. As the air reaches the UK and rises over the land, the precipitation is increased.
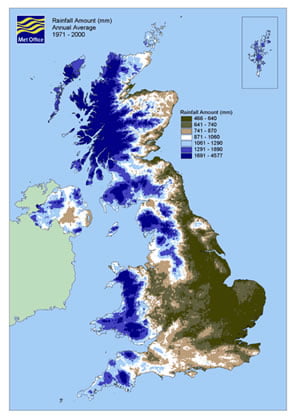
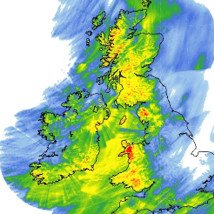
A precipitation map showing the rainfall ‘climate’ (averaged over 30 years) of the UK. With prevailing westerly winds, there is clearly more rain on the western side of the country, enhanced by the mountains of Wales and Scotland and the English Pennines.
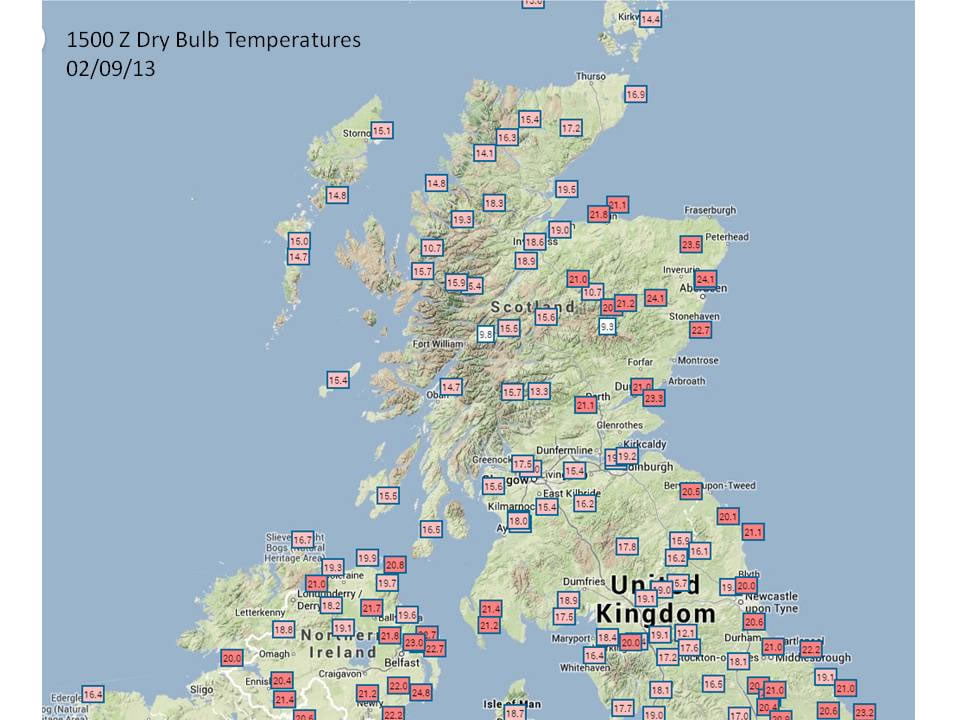
As well as being drier on the downwind side of the mountains, it can also be warmer. Remember that water releases heat into the atmosphere as it condenses and takes it up as it evaporates. If there is less water in the air on the downwind side, then there is less to evaporate and not all the heat that was released on the upwind side will be taken up again. This is known as the Föhn Effect.
The onset of a Föhn is generally sudden. For example, the temperature may rise more than 10°C in five minutes and the wind strength increase from almost calm to gale force just as quickly. Föhn winds occur quite often in the Alps (where the name originated) and in the Rockies (where the name chinook is used). They also occur in the Moray Firth and over eastern parts of New Zealand’s South Island. In addition, they occur over eastern Sri Lanka during the south-west monsoon.
Where there are steep snow-covered slopes, a Föhn may cause avalanches from the sudden warming and blustery conditions. In Föhn conditions, the relative humidity may fall to less than 30%, causing vegetation and wooden buildings to dry out. This is a long-standing problem in Switzerland, where so many fires have occurred during Föhn conditions that fire-watching is obligatory when a Föhn is blowing.
Teaching Resources
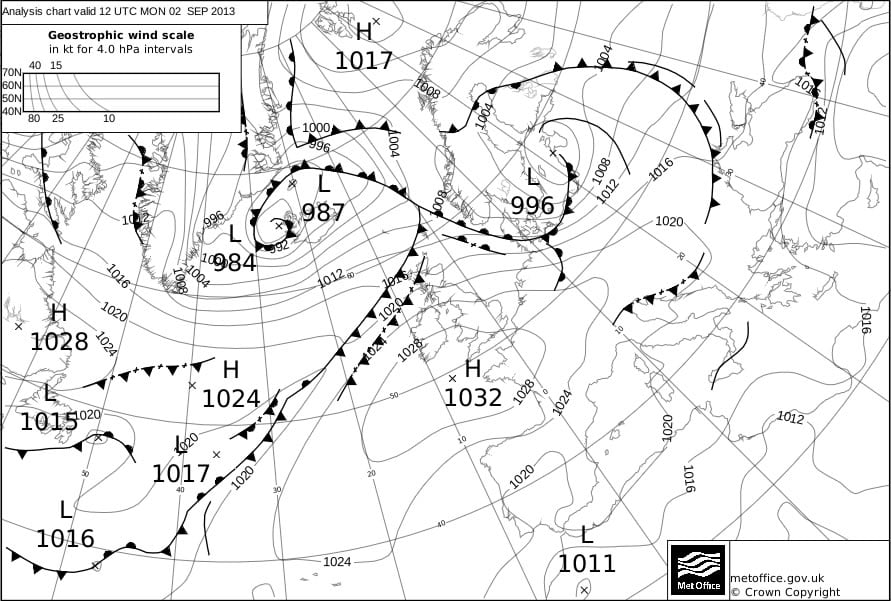
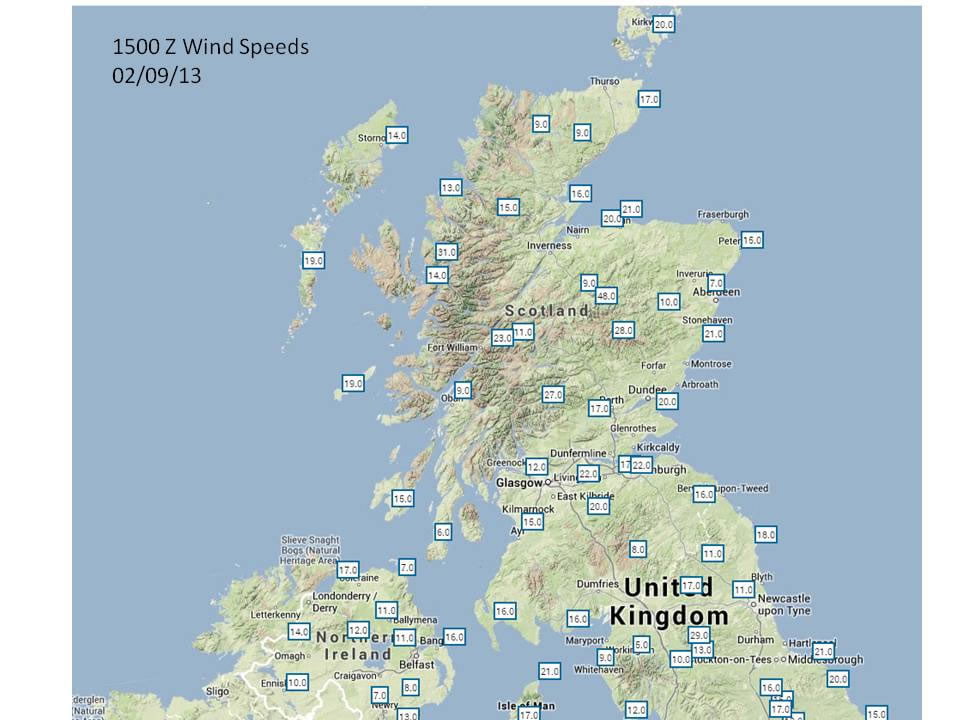
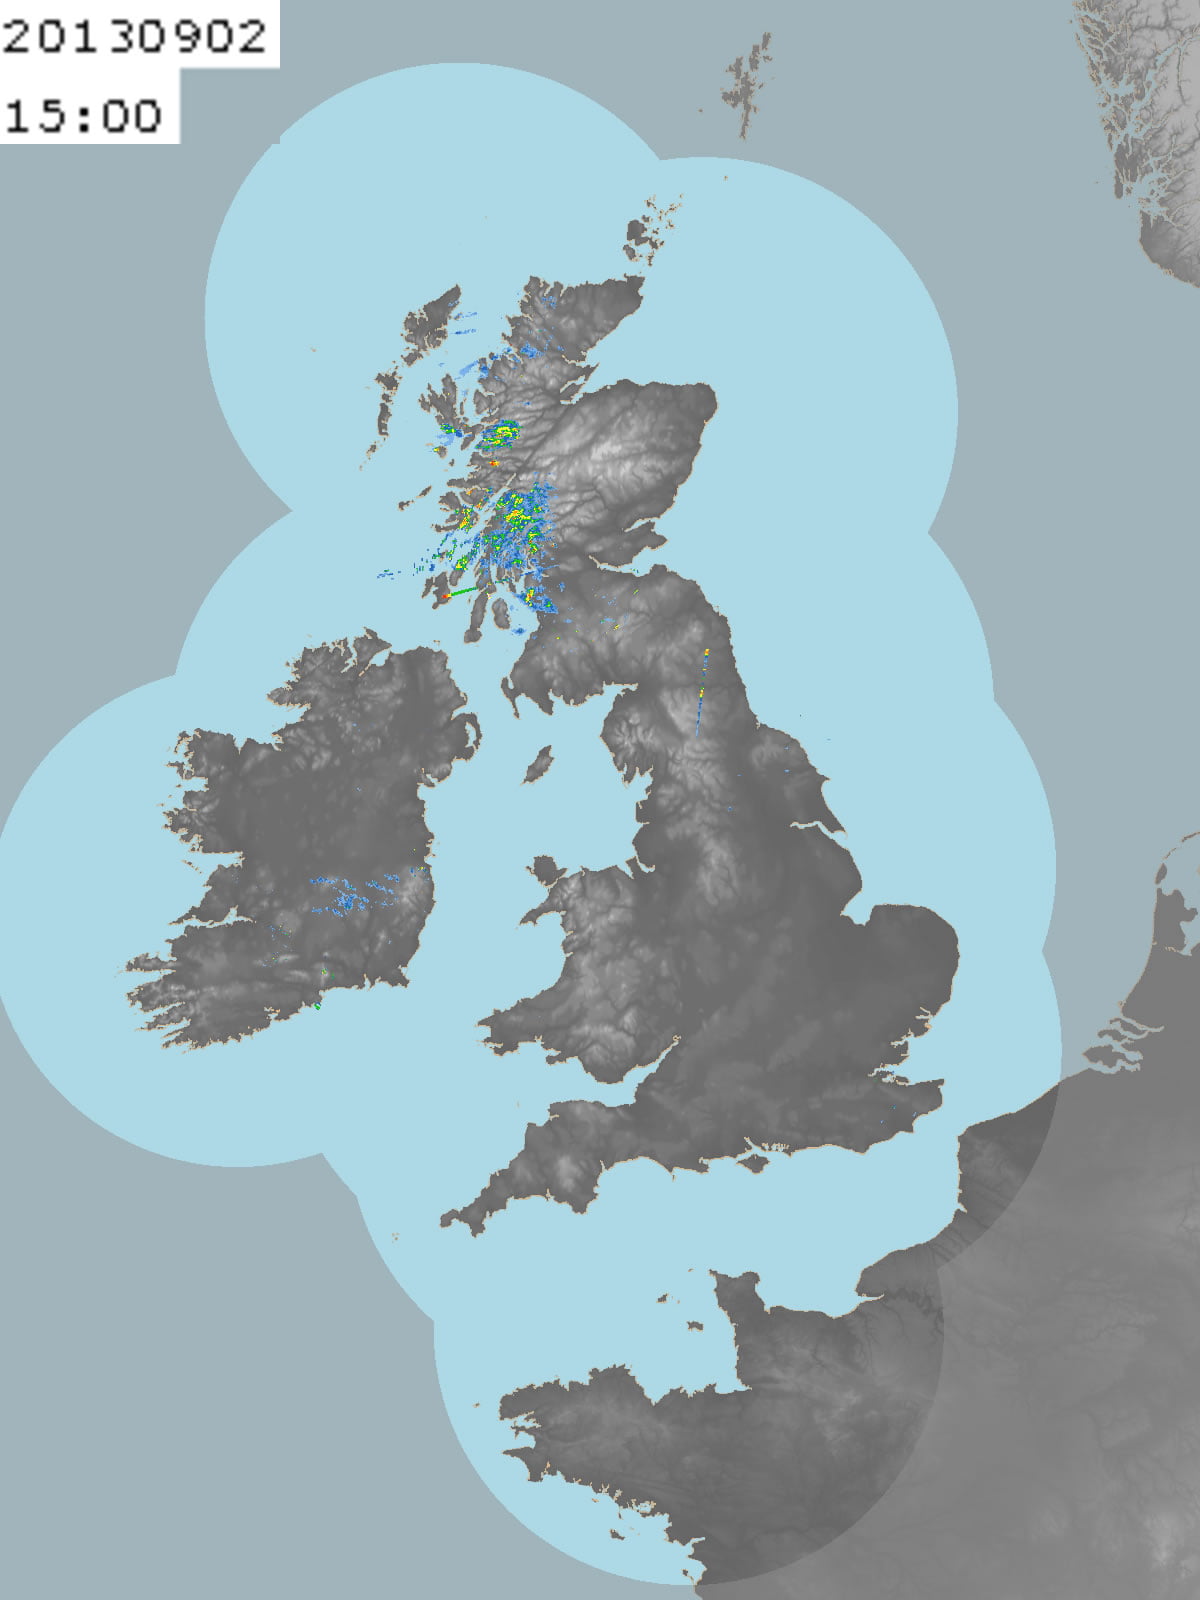
A case study of orographic rainfall and Foehn winds in Scotland with images for students Image 1, Image 2, Image 3, Image 4, Image 5.
Water in the Atmosphere from Weather and Climate: a Teachers’ Guide
Data and Image Sources


This resource links to Figure 11.12 in the IPCC report of 2021. The aim of this resource is to answer the question how will the flow of water around the world be altered with climate change?
It was written with the Royal Geographical Society with IBG.
The global atmospheric circulation is described by the Met Office as ‘the world-wide system of winds by which the necessary transport of heat from tropical to polar latitudes is accomplished’. Figure 1 shows the different cells of this global system, in Idealized Earth and Actual Earth projections.
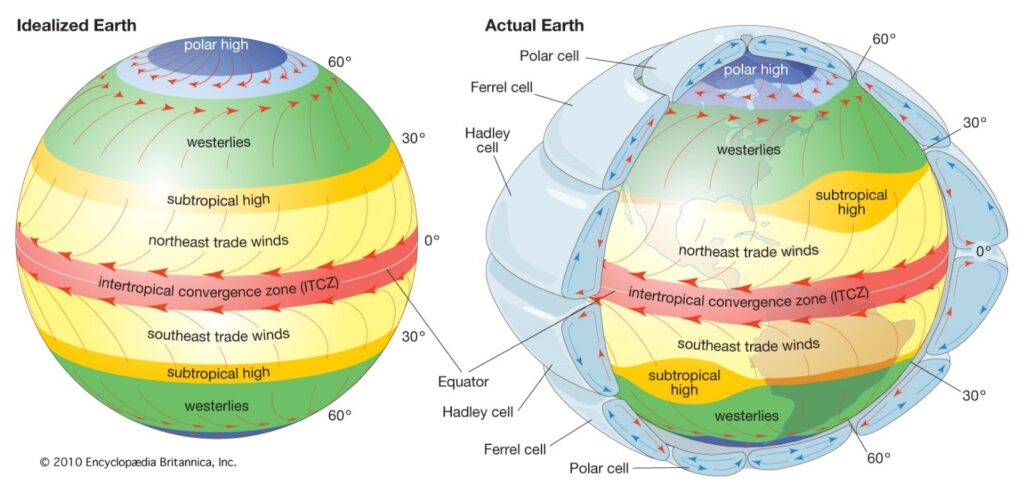
Figure 1 the different cells of the global atmospheric circulation © 2010 Encyclopædia Britannica Inc
Due to changes in our climate, there will be both small-scale and large-scale changes to the flow of water around the world in the twenty-first century.
a) +0.6 mm to 1 mm increase.
b) -0.6 mm to -1 mm decrease.
There are multiple atmospheric triggers for changes to the water cycle, termed climate drivers. Figure 3 in Appendix B shows how an increase in precipitation, solar radiation, temperature, wind, and carbon dioxide (CO₂) and a decrease in humidity can influence the water cycle. The diagram flows down to illustrate the outcome on water availability and drought.
Precipitation has increased steadily over Eurasia, most of North America, south-eastern South America, and north-western Australia. Whilst in Africa, eastern Australia, the Mediterranean region, the Middle East, and parts of East Asia, central South America, and the Canadian Pacific coast it has decreased. Records from 1910 onwards show Scandinavia, north-west Russia, the UK, and Iceland have all experienced increased precipitation trends. The amount of, frequency, and intensity of precipitation is forecast to continue to increase for these areas, which will worsen the severity of flooding. Across Europe there has been a reduction in snowfall, an important component in precipitation, in high latitude and mountain watersheds. Per decade, there has been a reduction of 0.52 million km² of annual mean potential snowfall over Northern Europe, with the greatest loss occurring in the Alps.
There have been substantial changes to runoff, streamflow, and flooding around the world. Although there are no significant global trends many human-induced drivers of change have been identified and linked to changes in the flow of water. Examples include decreasing runoff in the dry season in the Peruvian Amazon, a decline in streamflow in the Colorado River, and earlier snowmelt in Northern Europe. As a result, in the UK, there will continue to be problems over increased water availability and streamflow during winter, and a worsening decrease in water availability and streamflow during the summer months. These changes are caused by the difference between winter flooding, which occurs from storm precipitation falling on already waterlogged ground, and summer flooding, when precipitation falls on ground that has been baked hard by the Sun. These scenarios have been compounded by dam construction and water withdrawal, land use and land cover change, all leading to alterations of seasonality, amount, and variability of river discharge, especially in human-dominated small catchments.
Climate change is increasing the risk of both flooding and drought in the UK with flooding now being the most common form of natural disaster. The risk of flooding is increasing due to the anthropogenic drivers of climate change. Quite simply this is because, as the atmosphere warms, there is more evaporation from the surface and more condensation of water vapour into cloud droplets in the atmosphere. Intense precipitation will remain the main cause of flooding. However, there are other factors (such as local topography and geology, for example). In 2017 research by the Met Office found that climate change means there is a high chance of exceeding the observed record monthly rainfall totals in many regions of the UK. Further analysis in 2020 (again by the Met Office) shows that, on average, for the decade 2010 to 2019, UK summers were 13% wetter, and winters 12% wetter, than in the period 1961 to 1990. 7 of the 11 wettest years since records began (in 1862) in the UK have occurred since 1998. The five wettest winters have been from 1990 onwards. Overall, in the UK there is a trend towards wetter winters and drier summers.
Using all the work you have completed answer the final question below.
Answer the question: assess whether global flooding will become more severe or more frequent as a result of climate change? This means you must consider the different arguments, likelihoods, and levels of certainty, after weighing them up, to come to a conclusion.
Large Scale Circulation projected changes and their effect on the water cycle
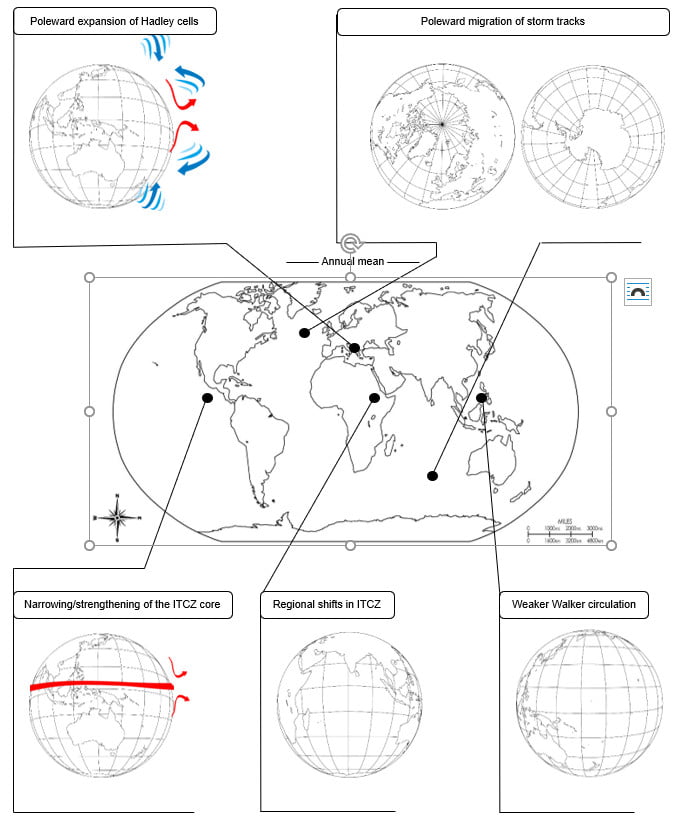
Figure 2 circulation projected change maps © freeusandworldmaps.com arrows © cliparts.co and getdrawing.com
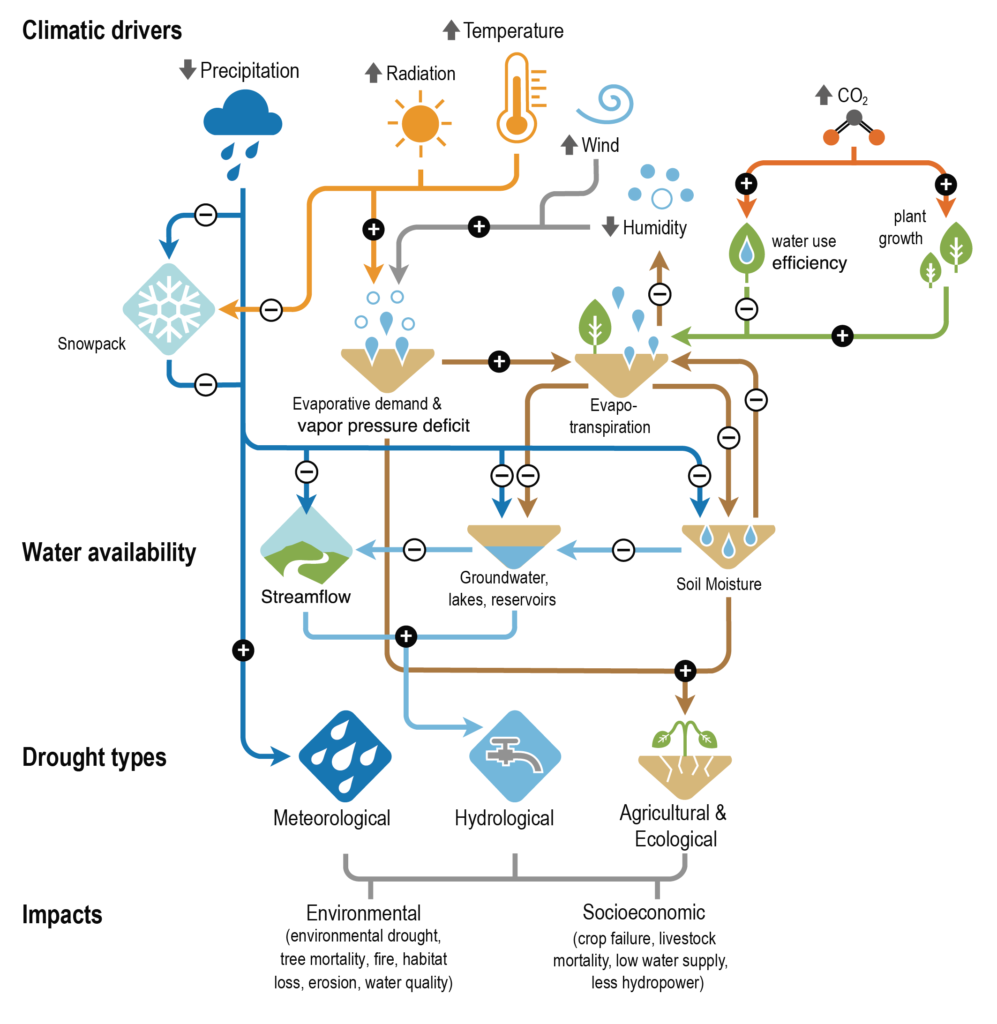
Figure 3 climate drivers © The IPCC report
Pathway: Basic weather
Climate Zones – Air Masses – Pressure and Wind – Water in the Atmosphere
Lesson overview: In this lesson, we focus on cloud formation due to convection, orography (relief) and frontal uplift.
The atmosphere is one of the smallest reservoirs of water in the hydrosphere. Clouds form when air is cooled. Air can cool due to convection, when air is heated from below and rises, or when air is forced to rise at a front between two air masses. When air is forced to rise over hills and mountains, cloud formation is enhanced. Climate change will intensify the water cycle, increasing the amount of water vapour in the atmosphere. As water vapour is a greenhouse gas this creates a positive feedback loop, amplifying climate change.
Learning objectives:
To understand why clouds form in the atmosphere.
To be able to explain two ways in which clouds form
Key Teaching Resources
Water in the Atmosphere PowerPoint
Water in the Atmosphere PowerPoint (easier)
Water in the Atmosphere Worksheet
Water in the Atmosphere Worksheet (easier)
Back-to-back image
Teacher CPD/ Extended Reading
Water in the Atmosphere – More for Teachers
Alternative or Extension Resources
Global Atmospheric Circulation and Global Precipitation Patterns
A ‘mystery’ – a case study of orographic rainfall in Scotland (with optional extension looking at the Foehn Effect)
Resources required
Computers with Internet access would be desirable. Alternatively if Internet access is not available, printed copies of student sheets and worksheets should be made.
Prior knowledge required
A basic background of weather and climate.
Students can visit the following pages to gain a basic background into the topics covered:
The information on the student sheets can be delivered by the teacher and activities completed individually. Alternatively students can work through the whole lesson themselves.
Part A – Isobars, pressure and wind
Part B – Identifying pressure systems and fronts
Part C – Plotted weather charts
Three worksheets with exercises are provided to consolidate learning.
A series of additional exercises are provided for more able students, or those who have already studied pressure systems and fronts in more detail prior to this lesson.
Any of the worksheet activities can be completed. Alternatively students can collect weather charts from the Internet or a newspaper and repeat the exercises using these.
Web page reproduced with the kind permission of the Met Office
A series of downloadable lesson plans and teacher’s notes prepared on extreme weather for A level geography.
Produced by Rob Pugh
UK extreme weather information can be found here and on the Met Office website
© 2024 Royal Meteorological Society
RMetS is a registered charity No. 208222
By clicking any link on this page you are giving your consent for us to set cookies. More info
Strictly Necessary Cookie should be enabled at all times so that we can save your preferences for cookie settings.
If you disable this cookie, we will not be able to save your preferences. This means that every time you visit this website you will need to enable or disable cookies again.
