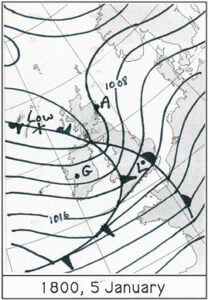
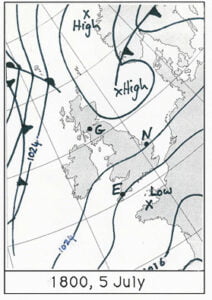
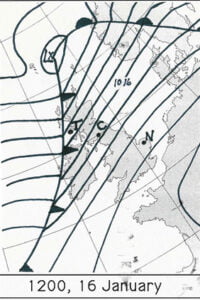
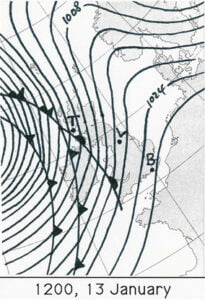

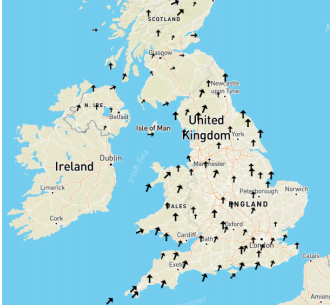
For each location marked on each map, what do you expect the weather to be doing? Think about whether it is windy, what the wind direction is, whether it is raining and whether it is warmer or colder.
Galway __________________________________________________________________
Aberdeen __________________________________________________________________
London __________________________________________________________________
Glasgow __________________________________________________________________
Norwich __________________________________________________________________
Exeter __________________________________________________________________
Tiree __________________________________________________________________
Carlisle __________________________________________________________________
Norwich __________________________________________________________________
Tiree __________________________________________________________________
Leeds __________________________________________________________________
Brighton __________________________________________________________________
Go to the WOW website wow.metoffice.gov.uk
Use the pop up calendar to select 24th December 2015 and the drop down box to choose 0600 to 0659 in the morning.
Use the Layers menu on the right to select wind speed/ direction.
Use the Filters menu to select only official observations.
Where is the wind coming from?
Is the wind weak or strong?
Change the time to 0800-0859. How does the wind look now?
Change the time to 1200-1259. How does the wind look now?
Capture the image, stick it into a work book
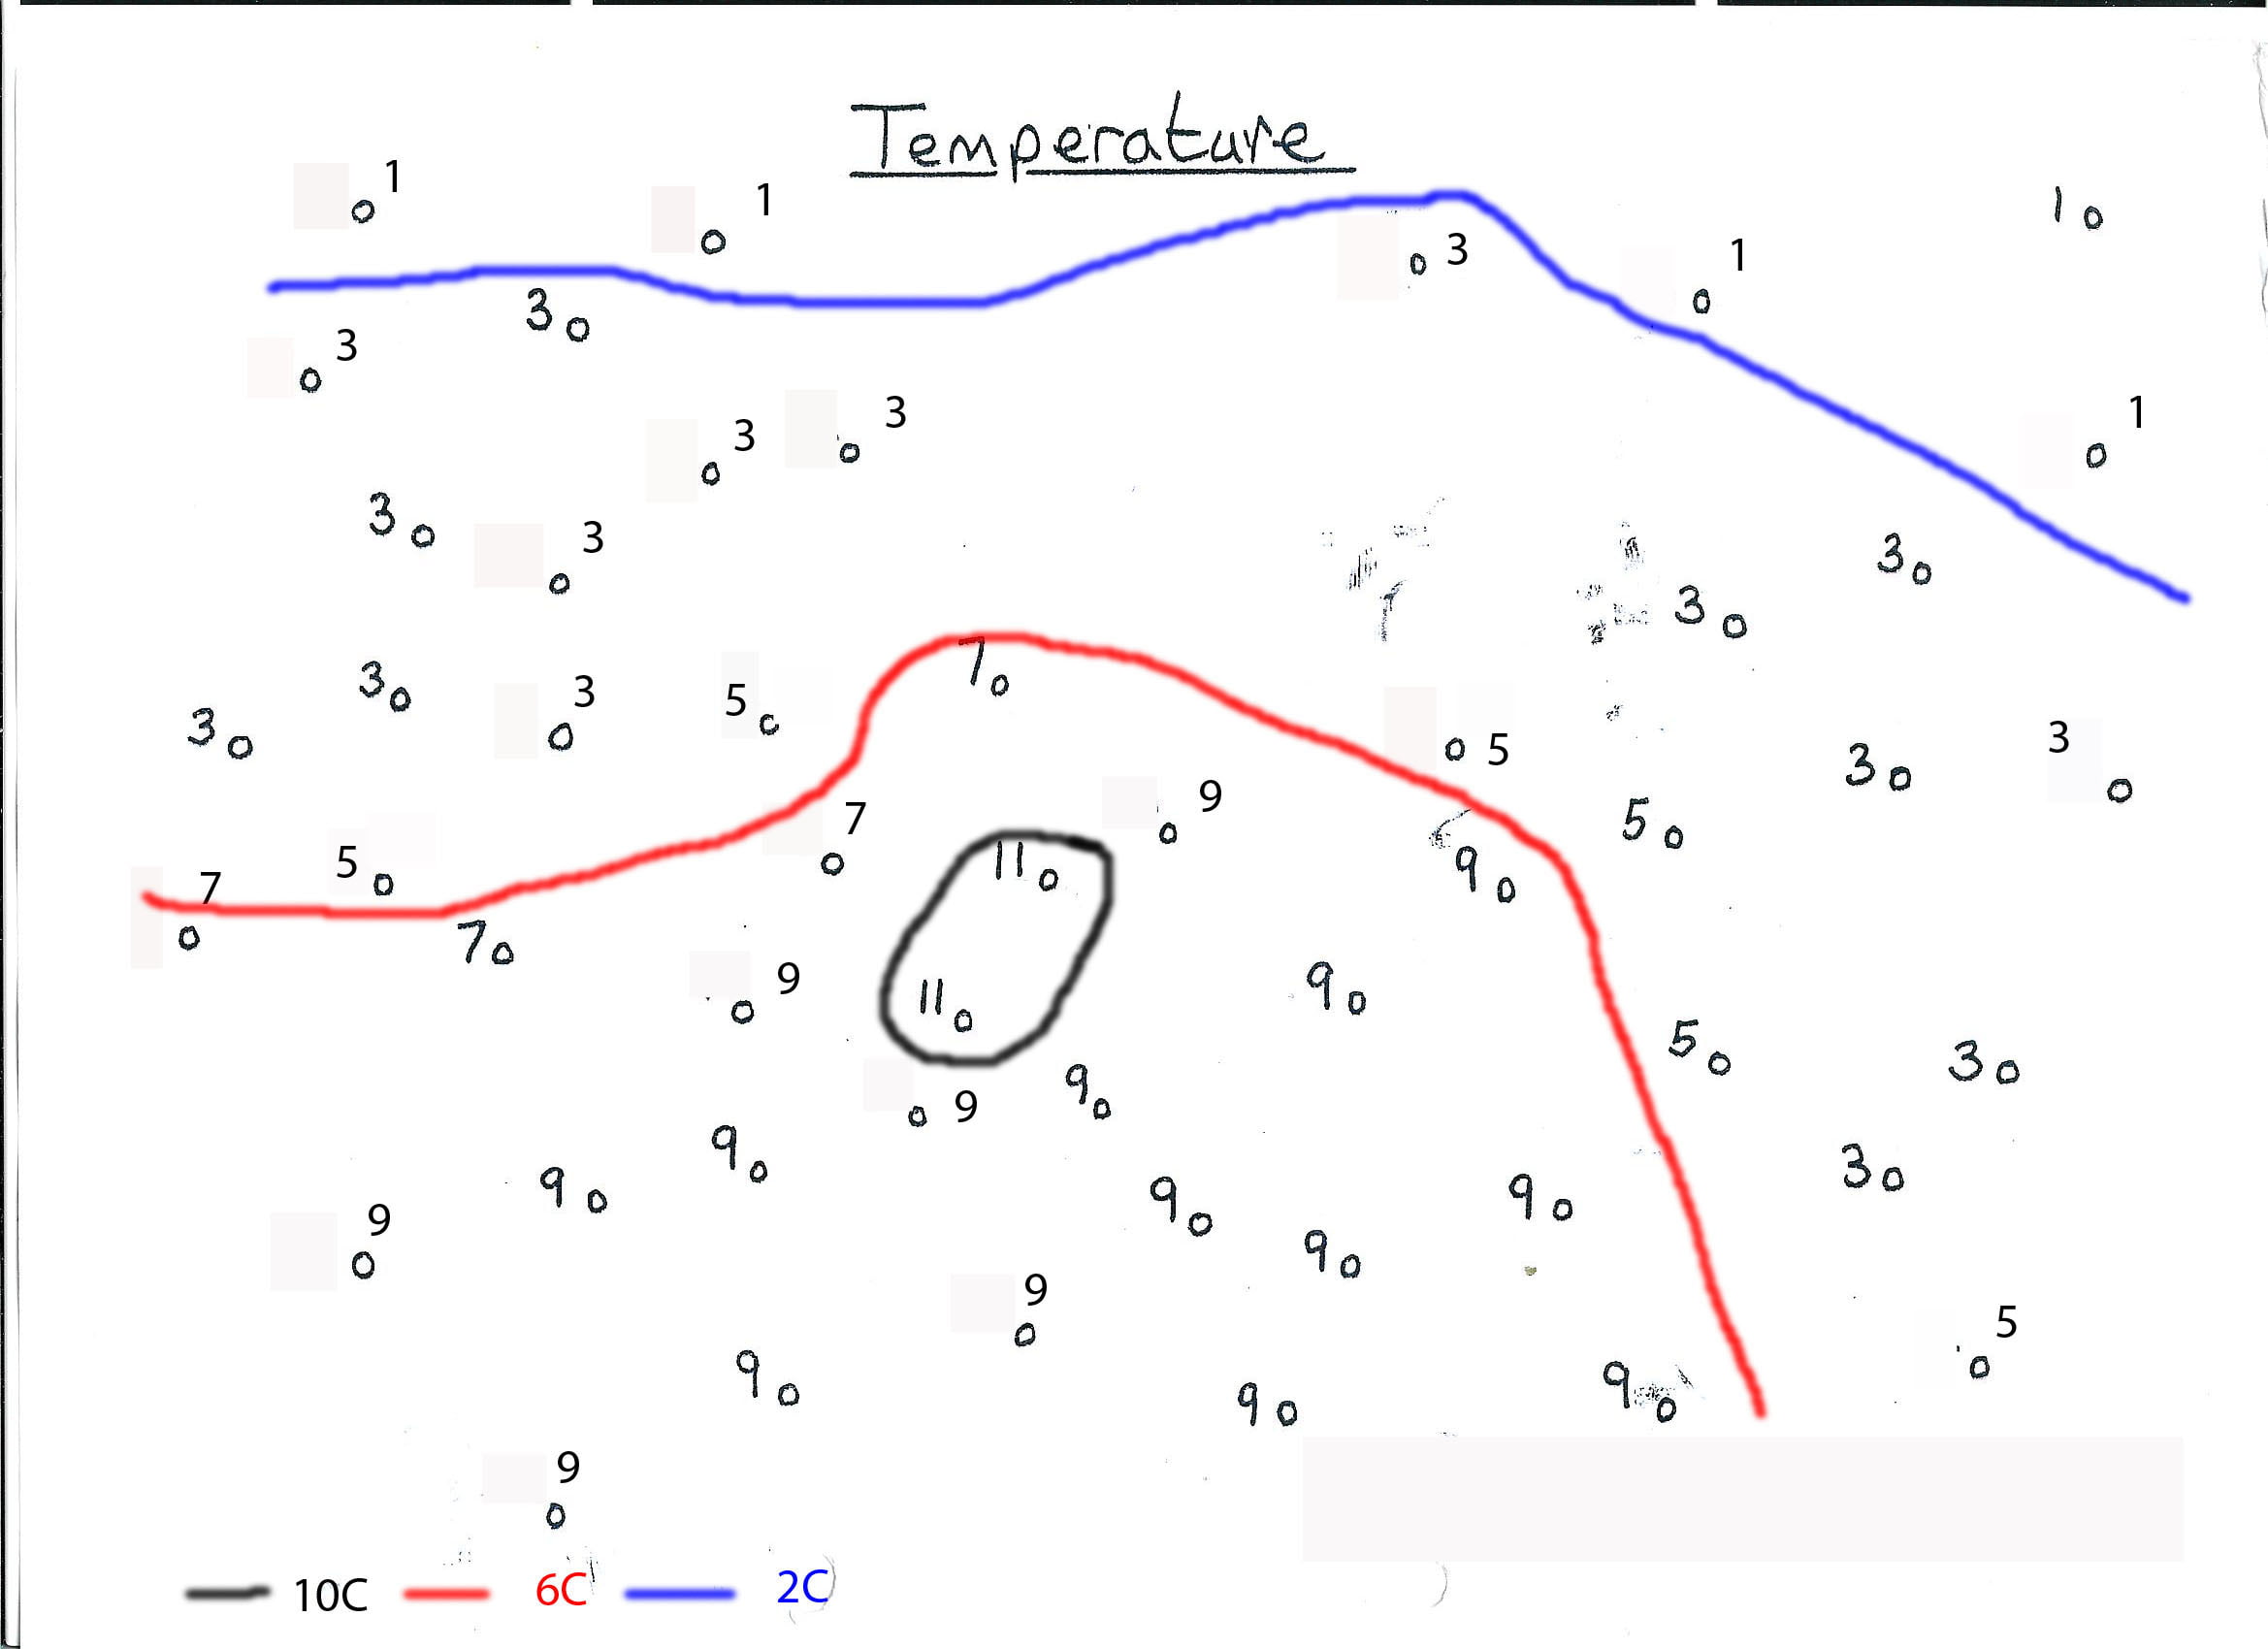
At 0600-0659, what are the temperatures across the U.K.? (You may need to click on some dots to work out exactly what the temperature is)
Capture the image, stick it into a work book at draw a line roughly dividing colder and warmer temperatures. What is a line dividing cold and warm temperatures called?
Now look at the temperature between 0800-0859. What is the pattern of temperatures?
Now look at the temperature between 1200-1259. What is the pattern of temperatures?
Capture the image, stick it into a work book at draw a line dividing colder and warmer temperatures.
Now compare this image and the line you have drawn on it with the wind image you captured earlier. What do you notice?
Find the Met Office Weather Station in Glasgow/ Bishopton, and click on it. Click on ‘View Full Observation’ and use the Graph view and the calendars to select from
23/12/15 to 25/12/15. How does the air temperature change?
You’ll also need to add ‘WOW observations’ from the Filter menu because the official observations don’t include rainfall. Where is it raining?
Go back in time, hour by hour, what happens to where the rain is?
Investigate how that changes through the day.
Find the Met Office Weather Station in Glasgow/ Bishopton again, and click on it. Click on ‘View Full Observation’ and use the Graph view and the calendars to select from 23/12/15 to 25/12/15. How does the mean sea level pressure change?
Capture the pressure image from 1200-1259 on 24th December 2015.
Can you sketch pressure contours for 992, 996, 1000, 1004, 1008 and 1012hPa?
Summarise what you think is going on with the weather on the 24th December 2015.
Key Stage 4 – A series of downloadable lesson plans and teacher’s notes prepared on weather systems for GCSE geography.
Produced by Tony Cassidy
A front is the boundary between two different types of air mass. In our latitudes a front usually separates warm, moist air from the tropics and cold, relatively dry air from polar regions.
Fronts move with the wind, so in the UK this is normally from west to east because our prevailing winds are from the west or southwest. At a front, the heavier cold air undercuts the less dense warm air, causing the warm air to rise up over the wedge of cold air.
As the air rises there is cooling and condensation, thus leading to the formation of clouds and rainfall. Consequently, fronts tend to be associated with cloud and rain. Three types of front can be identified; warm fronts, cold fronts and occluded fronts.
A warm front marks the leading edge of a warm air mass. The presence of a warm front means that the warm air is advancing and rising up over the cold air. This is because the warm air is ‘lighter’ or less dense, than the colder air. Warm air is thus replacing cold air at the surface.
Cloud extends well ahead of the front, becoming thicker as the front approaches, accompanied by falling pressure. Rain then starts to fall, usually becoming heaviest on the front itself.
The passage of the front is followed by a rise in temperature and humidity and a veer in the wind, while the pressure also stops falling. Although the rain dies out, it often stays cloudy.
On windward coasts and hills, the cloud base may be low enough to give fog and thick enough to produce drizzle. Inland and to the lee of hills, the cloud may break, allowing for some warm sunshine.
This marks the leading edge of colder air. The presence of a cold front means that cold air is advancing and pushing underneath warmer air. This is because the cold air is ‘heavier’ or denser, than the warmer air. Cold air is therefore replacing warmer air at the surface.
Pressure begins to fall increasingly rapidly as the front approaches and rain usually starts not long before it arrives, becoming heavy for a short time. This is often accompanied by an increase in and a backing of the wind. In some cases, there may also be hail and thunder.
The passage of the front is usually marked by a sharp change from falling to rising pressure and a veer in the wind.
As the rain dies away, the cloud lifts and breaks and, although there is sunshine, the air temperature falls.
After a time, cumulus clouds begin to form, often bringing showers. Sometimes the showers may become heavy, perhaps even accompanied by hail and thunder. On the other hand, in some cases, pressure will rise rapidly after a cold front has passed and this causes there to be few, if any, showers.
Occlusions are slightly more complex than warm or cold fronts. They occur because cold fronts travel more quickly than warm fronts and eventually this results in the cold front ‘catching up’ with the warm front.
This causes the warm air to be undercut and lifted up from the surface.
The characteristics of an occlusion are similar to those of a cold front in that the rain belt is narrow.
Cloud lifts and breaks after the front has moved through and there may be a change in temperature and a veer in the wind, though these tend to be small.
Whereas fronts separate air masses, which are different in temperature, troughs generally develop in cold air and are characterised by an increase in the frequency and intensity of showers. Pressure begins to fall as the trough approaches and often rises sharply once it has passed. As with fronts, the wind tends to back ahead of the trough and to veer immediately behind it. There are also particularly strong gusts of wind in the showers
Introduction
Development of a depression
Weather associated with a classic depression
A depression is an area of low pressure and is associated with unsettled weather. This is due to the fact that the air within the depression is rising, causing it to cool and the water vapour within it to condense into clouds. This rising air within a depression causes an area of low pressure at the surface. The deeper the depression (or low), the more unsettled the weather.
Consequently, the weather associated with a depression is often cloudy, wet and windy. However, weather is not uniformly distributed around a depression. Different parts of it have very different types of weather, which also vary through its lifetime. The most significant weather (cloud and precipitation) occurs in discrete lines or fronts. In the northern hemisphere winds blow anticlockwise around areas of low pressure; this is reversed in the southern hemisphere.
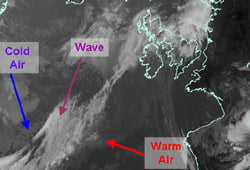
The depression usually starts life as a wave, shown on a chart by ‘buckling’ on a front. At this stage, the air is warm to the south of the front and relatively cold to the north of it. The weather in the warm air can vary from fine and sunny to cloudy, sometimes with drizzle and perhaps even with fog. The type of cloud is layered or stratiform and is not very thick. In the cold air, there is usually some cloud, but it tends to be more broken, appearing as discrete speckles on a satellite image. The cloud is cumuliform and can often be large enough to produce showers. Figure 7 shows an example of a ‘wave’ on a synoptic chart, whilst Figure 8 shows the infrared satellite image for the same time.
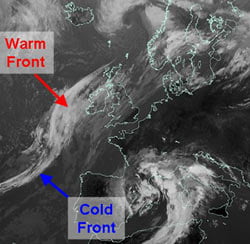
As the depression develops, the pressure around it falls, leading to more tightly packed isobars. This causes winds to be stronger and, at the same time, the buckle in the front becomes much more marked (see Figure 9), with distinct warm and cold fronts being formed. Warm air is pushed towards the north while colder air drives southwards. The region between the warm and cold front is called the warm sector. The cloud near the fronts thickens and the frontal zone becomes broader, which means that rain is more prolonged, becoming heavier nearer the front. However, it is often the case that one front is more active than the other. At this stage, the heaviest rain occurs near the centre of the low. Figure 9 shows an example of a mature ‘depression’ on a synoptic chart, whilst Figure 10 shows the infrared satellite image for the same time.
The fronts move at a speed indicated by the separation between the isobars along them, although the speed of the warm front is about two-thirds of this. Consequently, the cold front is usually faster than the warm front. Cold air is denser than warm air, which it replaces at the surface, causing the warm air to lift and the warm sector to become progressively smaller. The cold air increasingly undercuts the warm air, initially from near the centre of the low, leading to the development of an occluded front, or occlusion (see Figure 11).
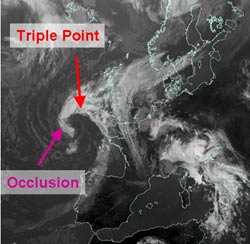
The rainfall usually becomes more sporadic on an occlusion, with the heaviest rain occurring near the triple point (see Figure 11), where all three types of front meet. By this stage, a depression is now in its mature stage, the pressure of its centre stops falling and starts to rise. Cold air has been brought well to the south, often over areas with higher surface temperatures. This can lead to particularly heavy showers, some of which may be thundery. Showers sometimes become organised into lines, which can be indicated on the weather chart by troughs (see Figure 11). Figure 11 shows an example of an occluded depression on a synoptic chart, whilst Figure 12 shows the infrared satellite image for the corresponding time.
Eventually the frontal system dies as all the warm air has been pushed up from the surface and all that remains is cold air. The occlusion dies out as temperatures are similar on both sides of the front.
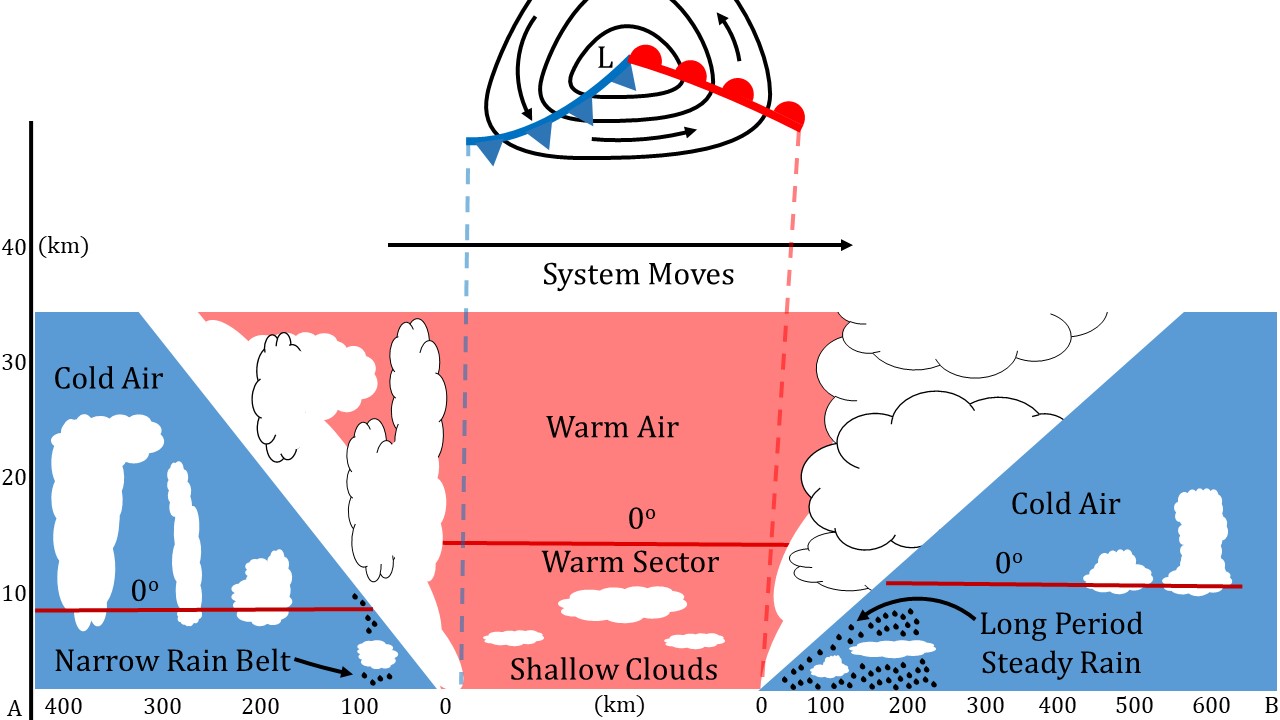
Every depression is different and hence the weather associated with each depression is also unique. However the weather associated with the passage of a classic depression does follow some general trends. Table 1 details the changes associated with the passage of both warm and cold fronts, whilst Figure 14 shows a cross section through a mature depression.
| TABLE 1: WEATHER ASSOCIATED WITH THE PASSAGE OF A CLASSIC DEPRESSION | |||||
|---|---|---|---|---|---|
| AHEAD OF THE WARM FRONT | PASSAGE OF THE WARM FRONT | WARM SECTOR | PASSAGE OF THE COLD FRONT | COLD SECTOR | |
| Pressure | starts to fall steadily | continues to fall | steadies | starts to rise | continues to rise |
| Temperature | quite cold, starts to rise | continues to rise | quite mild | sudden drop | remains cold |
| Cloud cover | cloud base drops and thickens (cirrus and altostratus) | cloud base is low and thick (nimbostratus) | cloud may thin and break | clouds thicken (sometimes with large cumulonimbus) | clouds thin with some cumulus |
| Wind speed and direction | speeds increase and direction backs | veers and becomes blustery with strong gusts | remain steady, backs slightly | speeds increase, sometimes to gale force, sharp veer | winds are squally |
| Precipitation | none at first, rain closer to front, sometimes snow on leading edge | continues, and sometimes heavy rainfall | rain turns to drizzle or stops | heavy rain, sometimes with hail, thunder or sleet | showers |
For more background information about mid-latitude weather systems and their associated weather, watch our weather systems video.
Polar lows
Thundery lows
Lee lows
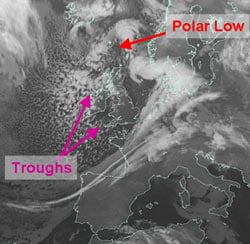
Polar lows form in cold air, mainly in winter or spring, and tend to be quite small. They usually originate from eddies that form to the lee of high ground. They produce showers that are wintry in nature and which sometimes become aligned into troughs. When they come across land, they can produce quite large amounts of snowfall. Figure 15 shows an example of a polar low on a synoptic chart, whilst Figure 16 shows the infrared satellite image for the corresponding time.
Thundery lows form over hot land in summer and can produce a large number of thunderstorms. These thunderstorms can also become aligned into troughs, giving spells of particularly intense downpours with hail, occasionally accompanied by tornadoes or waterspouts.
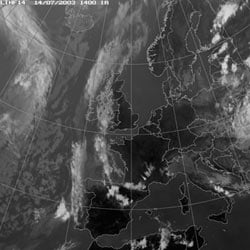
Figure 17 shows an example of thundery lows over France and Spain on a synoptic chart. Figures 18 and 19 show satellite images for the same day, showing the development of thunderstorms during the day.
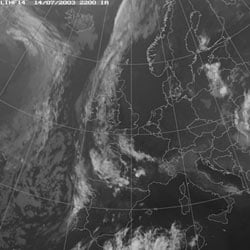
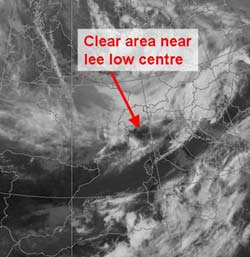
Lee lows form to the lee of high ground when strong winds are blowing directly against a ridge. They don’t produce any particular type of weather, but winds around them can be very unpredictable in both speed and direction. Figures 20 and 21 show an example of a lee low over the Gulf of Genoa on both a synoptic chart and satellite image.
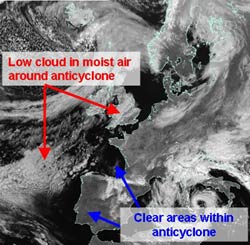
An anticyclone is a region of high pressure. This is the result of the air in the atmosphere subsiding towards the earth’s surface. This subsidence, or sinking motion, leads to the air becoming drier and warmer. In the northern hemisphere winds blow clockwise around areas of high pressure, this is reversed in the southern hemisphere.
When anticyclones form over land, the skies above are often clear of cloud. During the summer, this means long, sunny days and clear nights. In winter, the longer nights mean that temperatures fall lower, with frost often forming, which may persist all day. The falls in temperature overnight and light winds can lead to fog forming.
When anticyclones are over the sea, the weather can vary from fine and sunny to overcast cloud. This cloud may be thick enough to give drizzle and may fall low enough to produce fog. This happens most often during spring and is least frequent in autumn. If the anticyclone extends over both land and sea, cloud and fog can spread across coastal regions, sometimes reaching quite far inland.
Now why not have a go at answering some questions about the weather shown on a weather chart.
Web page reproduced with the kind permission of the Met Office.
The figure below shows the synoptic pressure chart at midnight on Wednesday, 17 May.
1. Name the pressure feature running from the Baltic States (Estonia, Latvia and Lithuania) south to the Adriatic Sea.
2. What is the name of the pressure feature extending south from Iceland into Scotland, Wales and England?
3. What is type of pressure feature to the south-west of Greenland?
4. From which direction would you expect the wind direction to be blowing over south-west England?
5. Compare the pattern of isobars to the south-west of Iceland, with the pattern of isobars in the bay of Biscay.
(a) In which area might you expect faster wind speeds?
(b) Explain your answer, with reference to the isobar patterns.
6. Imagine that the pressure system, observed at 1033 millibars, to the west of Ireland moved east in the next 12 hours and then remained over the United Kingdom for several days.
(a) What is the technical term given to this type of pressure system which remains stationary over the country?
(b) Outline the weather patterns and hazards associated if this was to happen in June or July.
(c) What differences in weather features might occur if this happened in November or December?
Web page reproduced with the kind permission of the Met Office

Weather systems
Fronts
Relationship between isobars and wind
Understanding station plots on a weather map
Plotting a station plot
Weather charts consist of curved lines drawn on a geographical map in such a way as to indicate weather features. These features are best shown by charts of atmospheric pressure, which consist of isobars (lines of equal pressure) drawn around depressions (or lows) and anticyclones (or highs). Other features on a weather chart are fronts and troughs. These are drawn to highlight the areas of most significant weather, but that does not mean that there is nothing of significance elsewhere on the chart.
Anticyclones are areas of high pressure, whose centres are often less well defined than depressions, and are associated with quiet, settled weather. Winds blow in a clockwise direction around anticyclones in the northern hemisphere, this is reversed in the southern hemisphere.
Depressions are areas of low pressure, usually with a well-defined centre, and are associated with unsettled weather. Winds blow in an anticlockwise direction around depressions in the northern hemisphere, this is reversed in the southern hemisphere.
Early weather charts consisted simply of station plots and isobars, with the weather being written as comments, like ‘Rain, heavy at times’. During the 1920s, a group of Scandinavian meteorologists, known collectively as the Bergen School, developed the concept of representing the atmosphere in terms of air masses. Since the air masses could be considered as being in conflict with each other, the term ‘front’ was used to describe the boundary between them. Three types of front were identified which depend on the relative movement of the air masses.
A cold front marks the leading edge of an advancing cold air mass. On a synoptic chart a cold front appear as a blue line with triangles. The direction in which the triangles point is the direction in which the front is moving.
![]()
A warm front marks the leading edge of an advancing warm air mass. On a synoptic chart a warm front appears as a red line with semi-circles. The direction in which the semi-circles point is the direction in which the front is moving.
![]()
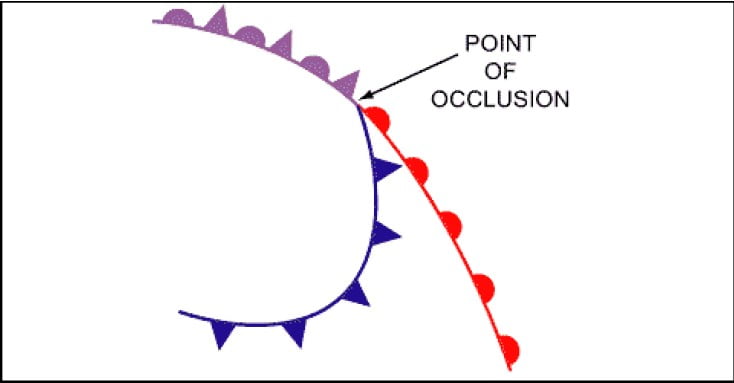
Occlusions form when the cold front of a depression catches up with the warm front, lifting the warm air between the fronts into a narrow wedge above the surface. On a synoptic chart an occluded front appears as a purple line with a combination of triangles and semi-circles. The direction in which the symbols point is the direction in which the front is moving.
![]()
Fronts describe thermal characteristics. They also happen to be where there is significant precipitation. However, precipitation is not confined to fronts. Drizzle in warm sectors or showers in cold air occur fairly randomly, but occasionally, lines of more organised precipitation can develop. These are called troughs.
![]()
Isobars are lines joining places with equal mean sea-level pressures (MSLP).
![]()
Wind is a significant feature of the weather (see Figure 4). A fine, sunny day with light winds can be very pleasant.
Stronger winds can become inconvenient and, in extreme cases, winds can be powerful enough to cause widespread destruction. The wind can easily be assessed when looking at a weather map by remembering that:
Good quality observations are one of the basic ‘tools of the trade’ for a weather forecaster.
The weather conditions at each individual station can be represented on a surface chart by means of station plot.
This means that information which would take up a lot of space if written on to a chart can be displayed in a quick easy to understand format.
Figure 5 shows an example of a plotted chart.
The land station plot can represent all the elements reported from that station, these typically include:
|
|
Traditionally station plots for manned observing sites were based around a central station circle. However, increasingly, automatic weather observations are replacing these and being plotted on weather charts. To differentiate between the two, automatic observations are plotted around a station triangle. Each element of the observation, with the exception of wind, is plotted in a fixed position around the station circle or triangle so that individual elements can be easily identified.
Total cloud amount
The total amount of the sky covered by cloud is expressed in oktas (eighths) and is plotted within the station circle for manned observations or station triangle for automatic stations, by the amount of shading.
The symbols used for both manual and automatic observations are shown below.
The surface wind direction is indicated on the station plot by an arrow flying with the wind. Direction is measured in degrees from true North. Therefore a wind direction of 180 is blowing from the south. The wind speed is given by the number of ‘feathers’ on the arrow. Half feathers represent 5 knots whilst whole feathers indicate 10 knots. A wind speed of 50 knots is indicated by a triangle. Combinations of these can be used to report wind speed to the nearest 5 knots. The symbols used are as follows.
Air temperature is plotted to the nearest whole degree Celsius, i.e. 23 would indicate 23 degrees Celsius.
Dew point temperature is plotted to the nearest whole degree Celsius, i.e. 18 would indicate a dew point of 18 degrees Celsius.
Pressure is recorded in millibars and tenths and the last three digits are plotted. Therefore 1003.1 would be plotted as 031 and 987.1 would be plotted as 871.
In total the Met Office has 100 codes for recording the current weather at the time of the observation. Different types of weather are represented using different weather symbols, a key to which can be found below.


A simplified version of the present weather plots is used to indicate past weather.
Pressure trend shows how the pressure has changed during the past three hours, i.e rising or falling, and pressure tendency shows by how much it has changed. The tendency is given in tenths of a millibar, therefore ’20’ would indicate a change of two millibars in the last three hours. Pressure tendency is indicated by the following symbols.
Visibility, which is how far we can see, is given in coded format, in either meters or kilometres. Visibilities below five kilometres are recorded to the nearest 100 metres, whilst those above five kilometres are given to the nearest kilometre.
For visibilities equal to and less than five km:
|
For visibilities greater than five km:
|
The type of low cloud present is provided in coded format, using the symbols below.

The type of medium cloud present is provided in coded format, using the symbols below.
The type of high cloud present is provided in coded format, using the symbols below.
Cloud heights are measured in hundreds or thousands of feet. The way these are plotted varies depending on whether the station is an automatic or manned observing site.
For automatic stations, indicated by a station triangle, the following codes are used.
|
For manned stations, indicated by a station circle, the following codes are used.
|
Gust speeds are measured in knots and proceeded by the letter G. Gust speeds are normally only recorded if they exceed 25 knots and are plotted as whole knots, i.e. G35 indicates a gust of 35 knots.
The decode of this station plot is as follows:
Type of observation: | Manned |
Total cloud amount: | 8 oktas |
Wind Speed: | 28-32 knots |
Wind direction: | South-westerly |
Air temperature: | 23 degrees Celsius |
Dew point temperature: | 18 degrees Celsius |
Pressure: | 1004.2 millibars |
Present weather: | Continuous moderate rain |
Past weather: | Rain |
Pressure tendency: | Falling 0.5 millibars in the past three hours |
Visibility: | 6km |
Low cloud type: | Stratus |
Low cloud amount: | 6 oktas |
Low cloud height: | 1000 feet |
Medium cloud type: | Altostratus |
High cloud type: | Cirrus |
Gust speed: | 45 knots |
Why not try decoding the following observational plots.
Web page reproduced with the kind permission of the Met Office
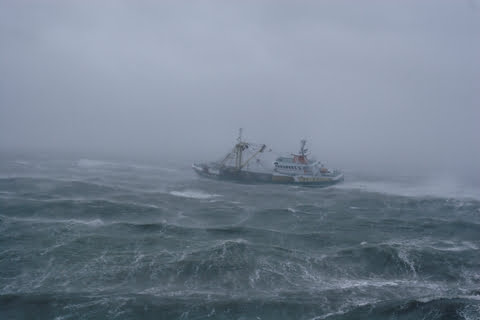
This is a brief guide to the main terms used in the shipping forecasts that are broadcast on BBC Radio 4, and also as a reference to the main shipping areas (known as the coastal waters) surrounding the British Isles.
Shipping bulletin
 Weather bulletins for shipping are broadcast daily on BBC Radio 4 at the following times: 0048 and 0520 (long wave and FM), 1200 and 1755 (normally long wave only). The bulletins consist of a gale warning summary, general synopsis, sea-area forecasts and coastal station reports. In addition, gale warnings are broadcast at the first available programme break after receipt. If this does not coincide with a news bulletin, the warning will be repeated after the next news bulletin.
A glossary of terms used in the shipping bulletin
Latest shipping forecast/gale warning
 In addition, some bulletins include a forecast for all UK inshore waters, as distinct from the coastal waters. This can be heard on BBC Radio 4 at the end of programmes (approximately 0048), and on BBC Radio 3 at 0535. The forecast covers the area up to 12 miles offshore and is for the period up to 1800 the next day. It includes a general synopsis, the forecast of wind direction and force, visibility and weather. The broadcast on Radio 4 also includes the latest available reports of wind direction and force, visibility, sea-level pressure and tendency for approximately 20 stations around the UK.
Latest inshore waters forecast
Specifications and equivalent speeds
Web page reproduced with the kind permission of the Met Office
Shipping Forecast weather system excercise notes and worksheet.

Weather and Climate: a Teachers’ Guide is our new scheme of work with associated CPD materials for teachers of 11-14 geography.
Below you will find other selected resources suitable for this age group.
Weather questions starter activity.
Drawing Climate Graphs: Student Worksheet and Teachers Notes.
Using leaves as thermometers: Student Worksheet, Leaf Cards and Leaf Graph.
Drawing contour maps of rainfall: Student Worksheet.
Using weather instruments: Student Worksheet and Teachers Notes.
Simple weather fieldwork using USB temperature dataloggers: Guidance document and report from Weather magazine.
Homework activity – assess how the weather affects you through a week.
Using weather data to investigate whether sports events can go ahead (Developed by Martin Sutton and previously published in Teaching Geography)
Met Office resource looking at correlation between classroom behaviour and weather with student worksheet and answers for teachers. Note the appearance of WOW has changed a little since this resource was written, but the St Athan data can be found by typing St-Athan or 3034 into the search box.
A simple and effective lesson plan which uses WOW data to identify Urban Heat Islands. The supporting PowerPoint presentations can be found here and here.
Urban heat island isotherm drawing exercise: notes for teachers, idealised weather station data for isotherm drawing, satellite image of Birmingham and solution for teachers.
Urban Heat Islands: a three lesson fieldwork resource, using a class set of simple digital thermometers to make a temperature map of the school’s catchment area. The lessons cover Urban Heat Island background information, fieldwork planning and data collection, display and analysis. Teachers notes and PowerPoints 1, 2 and 3.
The difference between weather and climate: Student Worksheet.
Climate zones starter activity.
Climate Zone Activities: Teachers Notes.
On this map of the world , ask the students to write on the following country names in green: UK, New Zealand, North Carolina (USA) and Uruguay; the following countries in yellow Arizona (USA), Namibia, Mali, Saudi Arabia and Western Australia; and the following countries in red Indonesia, Democratic Republic of Congo, Colombia and Hawaii– what pattern can they see?
[according to the standard Köppen classification, the green countries have a temperate or cold climate without a dry season, the yellow countries a Dry (desert or semi-arid climate) and the red countries a Tropical climate]
Show our short video on YouTube the Global Atmospheric Circulation
Use this Global Atmospheric Circulation practice exercise.
Look at the current circulation on nullschool. Where is the ITCZ now?
Comparing weather data from different climate zones.
We do not currently have any resources for this unit. What would you find useful?
Interpreting a climate graph: Student Worksheet.
Our ‘Green Sahara’ resource can be found on this page.
Our ‘Climate Change and the Vikings’ resource can be found on this page with Teachers Notes.
Our ‘Year With no Summer’ investigation can be found on this page.
Our resources looking at the effect of the Sun on climate, and on the Greenhouse Effect, Global Warming and Dimming can be found on this page.
A ‘De Bono’ hat activity looking at the impact of climate change: Teachers Notes, Students Worksheet and Students Worksheet .
Climate debate: Students Worksheet , Introductory PowerPoint , Help Cards, Debate Card 1 and Debate Card 2
Weather Taboo – some sample Taboo cards looking at air mass and depression words. Please share any further ones you develop with us!
Air Masses revision – a Human Board Game.
Using weather data to investigate the effects of different air masses on UK weather teachers notes with worksheets for students.
Red sky at Night, Shepherd’s Delight worksheet and Teacher’s Notes – a resource looking at how our prevailing wind direction means this saying is largely true.
Identify the features of a depression on a simple weather map.
Cold and warm fronts – some activities for differentiation and revision.
Using WOW data to investigate a depression passing across the UK with worksheets for students including more isoline drawing practice.
Mid latitude weather systems basics: Teachers Notes, Introduction to the formation of a depression and Student Worksheet, more detailed PowerPoint about the formation of a depression, Student Worksheet – passage of a depression and practise drawing a cross section through a depression PowerPoint exercise.
Pop up depression – fold a 3 dimensional depression (simple and more detailed versions).
Impacts of a depression – PowerPoint (wont link) and Student Worksheet.
Isotherm and Isobar drawing exercise based on a depression: student worksheet. A simpler version of the T/ isotherm map can be found here or the full version including solutions may be found on the A level page.
Tropical Cyclones scheme of work
Tropical Cyclones worksheet looking at locations, climatology etc.
Tracking Hurricane Irma an online research exercise.
A starter activity which looks at the duration, frequency and impacts of various global weather phenomena.
Starter activity – Weather Words Quiz
Extreme temperatures around the world GIS exercise developed by Joseph Kerski at ESRI.
Using GIS for hurricane tracks and tropical storm risk (Developed by Bob Lang, teacher and GA consultant)
A wonderful introduction to Air Masses from the BBC’s The Battle Of The Weather Fronts – The Great British Weather using some very loud rugby players!
An excellent GA resource investigating weather conditions needed for the various Olympic sporting events using weather station or WOW data.
Resources looking at change of state, latent heat, data handling and the Electromagnetic Spectrum from the NCAS/ DIAMET project.
A science upd8 resource looking at rain and cloud seeding.
A link to Radical Geography’s activities and resources tried and tested in the classroom weather and climate .
Four lesson plans from the BBC weather centre.
An online, interactive lesson going from weather data collection through to forecasting from NGfL Cymru.
An interactive introduction to weather systems and fronts from NGfL Cymru.
BBC bitesize explanations of weather systems, symbols, charts and processes.
Online, interactive lessons on climate change from NGfL Cymru here and here
An Inconvenient Truth the climate change film pack (look under essential reading and DCSF lesson resources)
Met Office climate introduction
Climate change and information from Ice Cores from WAIS divide.
By the end of the lesson, pupils will know and understand:
Computers with internet access would be desirable. Alternatively if internet access is not available, printed copies of student sheets and worksheets should be made.
A basic background of weather and climate.
The information on the student sheets can be delivered by the teacher and activities completed individually. Alternatively students can work through the whole lesson themselves.
Part A – Anticyclones and Depressions
Part C – Life cycle of a depression
Part D – Depression cross-section and weather sequence
Five worksheets with exercises are provided to consolidate learning.
Any of the worksheet activities can be completed.
Reproduced with the kind permission of the Met Office
By the end of the lesson, you will be able to:
Part A – Anticyclones and Depressions
Part C – Life cycle of a Depression
Part D – Depression cross-section and weather sequence
A high pressure system, also known as an anticyclone occurs when the weather is dominated by stable conditions. Under an anticyclone air is descending, forming an area of higher pressure at the surface. Because of these stable conditions, cloud formation is inhibited, so the weather is usually settled with only small amounts of cloud cover. In the Northern Hemisphere winds blow in a clockwise direction around an anticyclone. As isobars are normally widely spaced around an anticyclone, winds are often quite light.
Anticyclones can be identified on weather charts as an often large area of widely spaced isobars, where pressure is higher than surrounding areas.
In winter the clear, settled conditions and light winds associated with anticyclones can lead to frost and fog. The clear skies allow heat to be lost from the surface of the earth by radiation, allowing temperatures to fall steadily overnight, leading to air or ground frosts. Light winds along with falling temperatures can encourage fog to form; this can linger well into the following morning and be slow to clear. If high pressure becomes established over Northern Europe during winter this can bring a spell of cold easterly winds to the UK.
In summer the clear settled conditions associated with anticyclones can bring long sunny days and warm temperatures. The weather is normally dry, although occasionally, very hot temperatures can trigger thunderstorms. An anticyclone situated over the UK or near continent usually brings warm, fine weather.
A low pressure system, also known as a depression occurs when the weather is dominated by unstable conditions. Under a depression air is rising, forming an area of low pressure at the surface. This rising air cools and condenses and helps encourage cloud formation, so the weather is often cloudy and wet. In the Northern Hemisphere winds blow in anticlockwise direction around a depression. Isobars are normally closely spaced around a depressions leading to strong winds.
Depressions can be identified on weather charts as an area of closely spaced isobars, often in a roughly circular shape, where pressure is lower than surrounding areas. They are often accompanied by fronts.
What to do next
Using this information on pressure systems you should now be able to complete worksheet 1.
Then you can complete Extension 1 or worksheet 2.
A front is a boundary between two different types of air masses, these are normally warm moist air masses from the tropics and cooler drier air masses from polar regions. Fronts move with the wind so over the UK they normally move from west to east. The notes below provide information about the most common types of fronts. The descriptions given apply to active well developed fronts, weaker fronts may not display all the characteristics or they may be less well defined.
A warm front indicates that warm air is advancing and rising up over the colder air. This is because the warm air is ‘lighter’ or less dense, than the cold air. Therefore warm fronts occur where warmer air is replacing cooler air at the surface. As the warm front approaches there is a gradual deterioration in the weather. Clouds gradually lower from higher cirrus, through altostratus, to stratus and nimbostratus at the front. There is often a prolonged spell of rainfall which is often heavy. Behind the warm front the rain becomes lighter, turns to drizzle or ceases, but it remains cloudy. Temperatures rise behind the warm front and winds turn clockwise, also known as a wind ‘veer’. Pressure falls steadily ahead of and during the passage of the warm front, but then rises slowly after its passage.
The diagram below shows the formation of a warm front in diagrammatic form.
The diagram below shows a cross section through a warm front, with associated cloud, temperature and weather changes.
A cold front indicates that cold air is advancing and pushing underneath warmer air at the surface. This occurs because the cold air is ‘heavier’ or denser than the warm air. Therefore cold fronts occur where cooler air is replacing warmer air at the surface. The passage of weather associated with a cold front is much shorter lived than that with a warm front. As there is often a lot of cloud in the warmer air ahead of the cold front, there is often little indication of the approaching cold front. As the front passes temperatures fall and there is often a short spell of very heavy rain, sometimes with inbedded thunderstorms and cumulonimbus clouds. Behind the front the weather is much brighter with broken clouds but occasional showers. Winds veer with the passage of the cold front and are often strong and gusty, especially near showers. Pressure rises throughout the approach and passage of the cold front.
The diagram below shows the formation of a cold front in diagrammatic form.
The diagram below shows a cross section through a cold front, with associated cloud, temperature and weather changes.
In a mature depression the warm front normally precedes the cold front. Cold fronts generally travel much quicker than warm fronts, and eventually it will catch up with the warm front. Where the two fronts meet, warm air is lifted from the surface and an occlusion is formed. An occlusion can be thought of as having similar characteristics to both warm and cold fronts. The weather ahead of an occlusion is similar to that ahead of a warm front, whilst the weather behind is similar to that behind a cold front.
The diagrams below depict the formation of an occlusion.
The diagram below shows the occlusion in cross section.
What to do next
Now you can go on to Part C – Life cycle of a Depression.
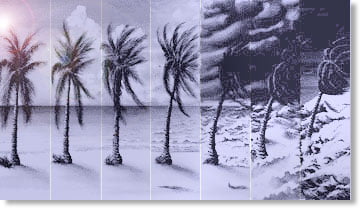
 Maturity
The warm air rises up over the colder air which is sinking. A warm sector develops between the warm and cold fronts. The mature stage of a depression often occurs over the UK.
Maturity
The warm air rises up over the colder air which is sinking. A warm sector develops between the warm and cold fronts. The mature stage of a depression often occurs over the UK.
Cross-section through a classic Depression
Most depressions have a warm and cold front, more mature depressions may also have an occluded front. The diagram below shows a cross-section through a depression, showing the warm and cold fronts and an indication of the associated weather.
| ||||||||||||||||||||||||||||||||||||||||||
What to do next
Using this information on the passage of depressions you should now be able to complete worksheet 3, and worksheet 4.
Web page reproduced with the kind permission of the Met Office