Tropical Cyclone Challenge

Tropical Cyclone Teaching Resources

Overview document for teachers – START HERE.

At the bottom of the page, you will also find some further reading/ background information for teachers, if you would like to deepen your understanding of Tropical Cyclones.

Introduction to Tropical Cyclones

Resources for Teachers

Tropical cyclones – the basics PowerPoint.

What do you call a tropical cyclone – physical basemap

What do you call a tropical cyclone – cumulative hurricanes basemap.

Teacher resource – Tropical Cyclone basics answers.

Worksheets and Resources for Students

What do you call a tropical cyclone? (cumulative hurricanes or physical basemap)

What kind of storm?

Where, Why and How do they Form?

Our Tropical Cyclone Challenge– use the online interactive resource with accompanying worksheet to discover the recipe for a Tropical Cyclone.

Resources for Teachers

Tropical cyclones: where, why, how PowerPoint.

Thunderstorm recipe (teacher).

Worksheets and Resources for Students

Thunderstorm recipe

Making things spin.

SST exercise.

Homework task:

A long time ago

Tracking Tropical Cyclones

Resources for Teachers

Tracking tropical cyclones PowerPoint

Worksheets and Resources for Students

Japan Decision Making Exercise

Hazards

Resources for Teachers

Tropical cyclones – hazards PowerPoint.

Hurricane Harvey Links

Storm surge worksheet- answers.

Hazard posters.

Worksheets and Resources for Students

Tropical cyclone hazards worksheet.

Storm surge worksheet.

Case study: Hurricane Harvey and worksheet.

Homework task:

Option 1: Hurricane Harvey case study and Hunting Hazards.

Option 2: Tropical cyclones worksheet

Option 3: GIS hurricane task.

Impacts

Resources for Teachers

Tropical cyclones – Impacts PowerPoint.

Cyclone Idai Links

The many ways a tropical cyclone can kill you (teacher).

Worksheets and Resources for Students

The many ways a tropical cyclone can kill you.

The other effects a tropical cyclone may have.

Personas.

Case studyCyclone Idai.

Extra: Tracking hurricane Irma.

Responses

Resources for Teachers

Tropical cyclones – responses PowerPoint.

Super Typhoon Haiyan/ Yolanda Links.

Worksheets and Resources for Students

Case study – Haiyan.

Response Decision Making Exercise.

Typhoon Haiyan disaster response.

Homework task: GDACS mapping exercise and maps.

Assessment Resource: Cyclone Fani Decision Making Exercise; Cyclone Fani DME resource booklet.

Background Information for Teachers

Extreme Weather (global)

A series of downloadable work schemes and associated PowerPoint presentations on extreme weather for AS/ A2 geography.

Produced by Martin Lawrence

Monsoons

The word monsoon is derived from the Arabic word ‘mausim’, meaning season. It was first used by Arabic navigators to describe the seasonal winds of the Arabian Sea. These generally blow from the north-east for one half of the year, and from the south-west for the other half. Although the term monsoon actually means a seasonal wind, it is often used to refer to the torrential rainfall associated with these winds.

Monsoons occur mainly in tropical regions – northern Australia, Africa, South America and the USA. However, the best known area affected by monsoons is south-east Asia, particularly India. During the winter, air over the Siberian plateau becomes colder than air over the surrounding seas, producing a large anticyclone with winds circulating clockwise, thus causing cool north-easterly winds to blow across India and its neighbouring countries. This brings dry, pleasant weather, and has a marked drying effect on the land. During April and May the winds abate, causing temperatures to rise rapidly to over 35 °C.

In the summer the process reverses. The Siberian plateau is now warmer than the seas, and low pressure develops over these seas. The winds circulate anticlockwise and approach India from the south-west, bringing very moist air. These south-westerly winds bring a drop in temperature and heavy downpours of rain. In fact, during this monsoon, which generally lasts from June to September, India receives virtually all its rainfall for each year.

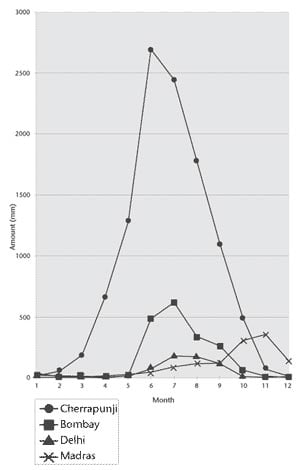
The mountains of southern India split the summer winds. The western arm of the monsoon is deflected northwards, by the western Ghats, to Bombay and then on to Pakistan. The eastern arm travels up through the Bay of Bengal to Calcutta and Assam, and is deflected north-westwards by the Himalayas. On average, the winds arrive in southern India about six weeks before they arrive in north-west India.

The heaviest monsoon rainfalls occur where the winds blow side-on to the hills. The higher the hills and more moist the air, then the greater the amount of rainfall. These factors give Cherrapunji, in Assam, one of the highest rainfalls in the world; the western monsoon winds having travelled an extra distance over the warm seas of the Bay of Bengal, then meeting the Himalayas.

On average, Cherrapunji has an annual rainfall total of nearly 11 metres, the maximum monthly amount occurring in June. Bombay, in the eastern monsoon, receives about 1.8 metres with the maximum monthly total in July.

In comparison, Delhi registers only 64 cm of rainfall each year (about the same as London), with the maximum monthly total occurring in both July and August. At Madras the pattern of rainfall is different because the monsoon winds blow along the coast. Here, the rainfall increases gradually through the summer months with larger amounts falling in October and November, owing to tropical cyclones travelling westwards across the Bay of Bengal.

Monsoon hazards

Monsoon rainfalls are unreliable in that the amount varies considerably from year to year. Low rainfalls cause great problems for agriculture and water supplies in general. On the other hand, even moderate rainfalls can cause flood hazards. The eastern monsoon releases most of its rainfall in the Ganges plain, causing flooding to low-lying areas where the river flows into the Bay of Bengal. In the Indus river the flood problem is often made worse because the monsoon rainfalls can coincide with high river levels in its tributaries, caused by water from the melting mountain snows of the Himalayas.

Web page reproduced with the kind permission of the Met Office

Haiyan Yolanda

Tropical Cyclone Haiyan/ Yolanda


the earth
Image courtesy of the Dundee Satellite Receiving Station

Some useful links:

National Geographic

http://news.nationalgeographic.com/news/2013/11/131108-supertyphoon-haiyan-yolanda-atmosphere-climate-change/

BBC

http://www.bbc.co.uk/news/world-asia-24894529

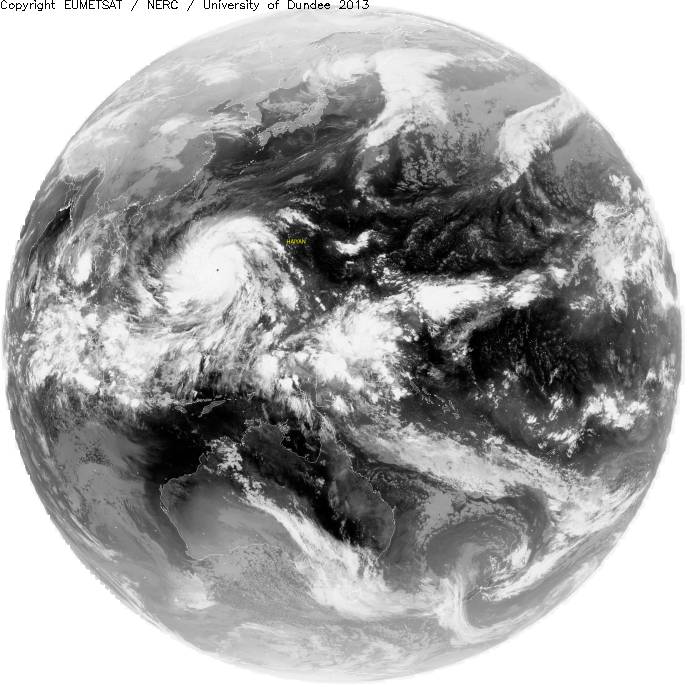
https://www.bbc.co.uk/news/av/world-asia-24887664/typhoon-haiyan-makes-landfall-in-vietnam

https://www.bbc.co.uk/news/av/world-asia-24879310/typhoon-haiyan-heads-to-vietnam

https://www.bbc.co.uk/news/world-asia-24878801

https://www.bbc.co.uk/news/world-asia-24846813

https://www.bbc.co.uk/news/av/uk-24866143/weather-report-tracking-monster-typhoon-haiyan

Accuweather.

How Typhoon Haiyan Became Year’s Most Intense Storm 

Guardian

http://www.theguardian.com/world/2013/nov/08/typhoon-haiyan-hits-philippines http://www.theguardian.com/world/gallery/2013/nov/09/super-typhoon-haiyan-philippines-destruction-in-pictures

https://www.theguardian.com/world/2013/dec/22/typhoon-haiyan-philippines-aid-workers-diary-of-disaster

https://www.theguardian.com/world/2013/nov/08/typhoon-haiyan-biggest-storms

https://www.theguardian.com/world/2013/nov/08/typhoon-haiyan-philippines-death-toll


https://www.theguardian.com/world/2013/nov/07/philippines-worst-typhoon-haiyan

The Telegraph

https://www.telegraph.co.uk/news/picturegalleries/worldnews/10440559/In-pictures-Super-Typhoon-Haiyan-brings-devastation-to-the-Philippines.html?frame=2730039

The Sun

https://www.thesun.co.uk/archives/news/323688/1200-dead-after-typhoon-haiyan-tears-through-philippines/

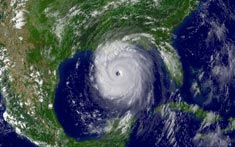
Other tropical cyclone/ hurricane resources on MetLink:

Tropical Cyclones worksheet looking at locations, climatology etc.

Tracking Hurricane Irma an online research exercise.

Using GIS for hurricane tracks and tropical storm risk (Developed by Bob Lang, teacher and GA consultant)

Extreme Weather (developed by Martin Lawrence) 

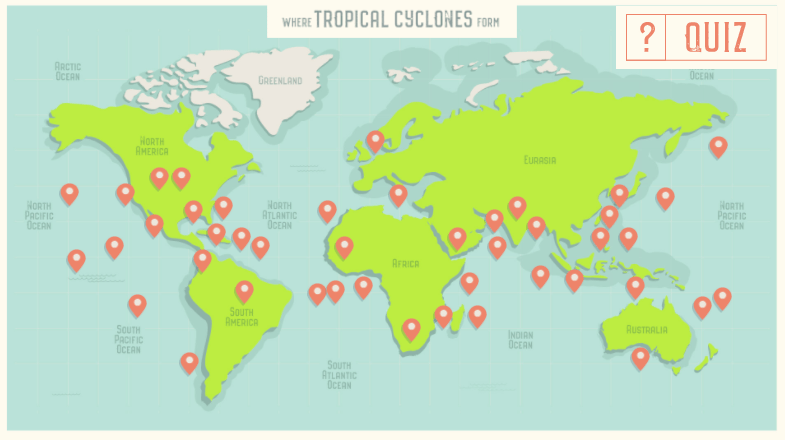
Background information about hurricanes and other tropical cyclones
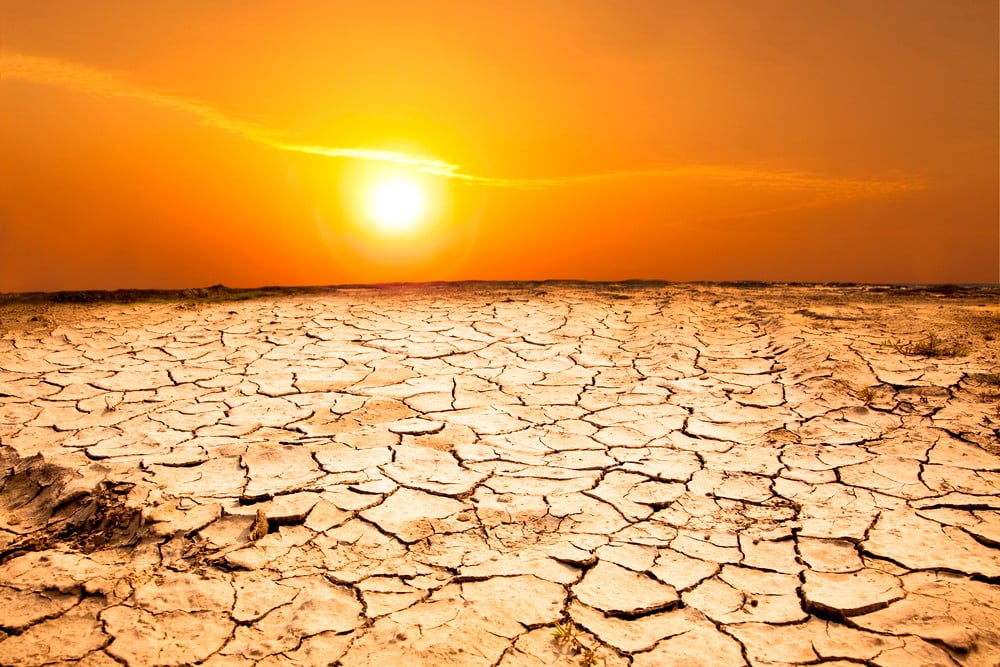
Weather Charts Teachers’ Notes

Understanding weather charts

Teachers’ notes to accompany Understanding Weather Charts

Resources required

Computers with Internet access would be desirable. Alternatively if Internet access is not available, printed copies of student sheets and worksheets should be made.

Prior knowledge required

A basic background of weather and climate.

Teaching activities

Students can visit the following pages to gain a basic background into the topics covered:

The information on the student sheets can be delivered by the teacher and activities completed individually. Alternatively students can work through the whole lesson themselves.

Part A – Isobars, pressure and wind

Part B – Identifying pressure systems and fronts

Part C – Plotted weather charts

Exercises

Three worksheets with exercises are provided to consolidate learning.

A series of additional exercises are provided for more able students, or those who have already studied pressure systems and fronts in more detail prior to this lesson.

Suggestions for homework

Any of the worksheet activities can be completed. Alternatively students can collect weather charts from the Internet or a newspaper and repeat the exercises using these.

Web page reproduced with the kind permission of the Met Office

Drought

Download Drought Fact File

What is a drought?

Droughts are not very easy to define. A drought is not just a lack of water for a period of time. In fact there are a whole range of types of drought including; agricultural (farming), meteorological (weather), hydrological (surface water) and socio-economic (ones which affect humans).

Agricultural Drought

A Combine HarvesterThis is a drought which affects how farmers can use their land. An agricultural drought usually means there is not enough water for the crops to grow as there is a lack of soil moisture. It can also affect livestock such as cows and sheep.

Hydrological Drought

Water DropletsHydrological droughts are ones which there is a lack of water at the surface of the earth, resulting in less water in streams, lakes and reservoirs and can impact on the use of water for houses and industry

Meteorological Drought

DropsThis is usually simply defined as a period of time where there has been less rain recorded. Rainfall amounts can vary by duration (i.e. time the rain fell for) and the intensity of rainfall (how hard it was raining). Meteorological drought is usually recorded in the time there has been little or no rain for e.g. months or years.

Socio-economic Drought

Pound SignA Socioeconomic drought is when physical water shortages affects the lives of people; such as their health and quality of life. It can also affect the supply of food and materials and so affect the economy.

Deserts

What is a desert?

A desert is an area of land where rainfall is not sufficient to support vegetation. There are usually large temperature difference between day and night, known as the diurnal temperature range. Deserts can be hot or cold!

What is Desertification?

This is when an area on the boundary of a desert which loses its vegetation and the land becomes filled with sand dunes. Possible causes include climate change and variability, human pressure on the land and overgrazing by livestock (animals).

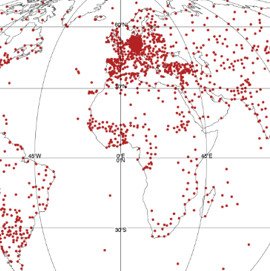
Where are the Main Deserts in the World?

Deserts are areas of very low rainfall and are often described as drought regions of the globe. But do you know where they are?
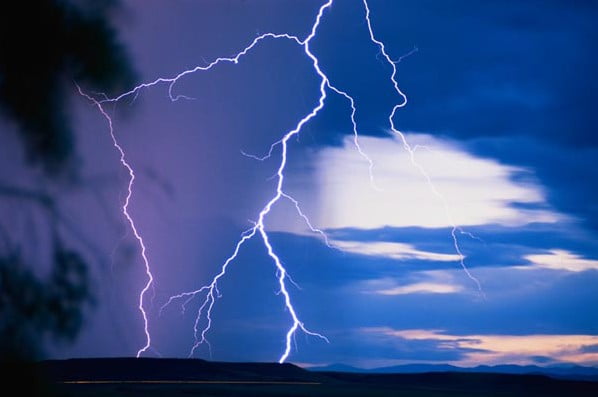
A World Map of Deserts

In Depth – Extreme Weather

Flooding

Flooding is caused by:

  • a large amount of persistent rain
  • rapid thawing of snow
  • a storm surge
  • a combination of high tides and high river levels

Storm surges
Storm surges are caused by strong winds and low air pressure. When pressure decreases by one millibar, sea level rises by one centimetre. A deep depression, with a central pressure of about 960 mb, causes the sea level to rise half a metre above the level it would have been had pressure been about average (1013 mb). When pressure is above average, sea level correspondingly falls.

Storm surges create large waves. The highest waves wash away protective dunes, batter sea walls and break over coastal defences causing flooding.

The greatest surge on record for the North Sea as a whole occurred on 31 January and 1 February 1953.

Click here to view the floods case study

Tropical cyclones

A tropical cyclone is a low pressure system over tropical or sub-tropical waters, with convection (i.e. thunderstorm activity) and winds at low levels, circulating either anti-clockwise (in the northern hemisphere) or clockwise (in the southern hemisphere). The terms hurricane and typhoon are regionally-specific names for a strong tropical cyclone.


Thunderstorms

Most thunderstorms are associated with towering clouds known as cumulonimbus. The right conditions for the formation of a thunderstorm are unstable air and a mechanism for causing air to rise.

While air is rising it is said to be unstable. This instability is the result of a rapid fall of temperature with height, as well as a considerable amount of moisture in the air. This process may because by a warm surface; the air near the surface being forced to rise over higher ground or instability within a weather front.

E.g. on a summer’s day, the land is warmed by the sun, and as the air just above becomes warmer it starts to rise. As it rises it cools, and, if cooled sufficiently, cumulus clouds form at the condensation level. These small, white puffy clouds grow larger and larger as the temperature of the ground increases, causing more warm air to rise. After a time, the top of the cloud turns to ice (usually below a temperature of -20 °C) and streams away in the winds at the level of the cloud top, giving it a characteristic anvil shape.

Lightning
Lightning is a large electrical spark caused by electrons moving from one place to another. Electrons cannot be seen, but when they are moving extremely fast, the air around them glows, causing the lightning flash. The actual streak of lightning is the path the electrons follow when they move.

An atom consists of three basic parts, a proton (which has a positive charge), a neutron (which has no charge) and an electron (which has a negative charge). Electrons cling to the positively charged centre of the atom because they have a negative electrical charge. During a thunderstorm, some of the atoms in the cloud lose electrons while others gain them.

When a cloud is composed entirely of water droplets, there is very little transfer of electrons. As a storm cloud grows in height, the water droplets higher up become cooler. They continue in the liquid state below 0 °C as super-cooled water, but eventually they begin to turn to ice, usually at a temperature below -20 °C. These ice particles often collide. When they do, smaller particles lose an electron to the larger, thereby gaining a positive charge.

The small particles are propelled towards the top of the cloud by strong internal winds, while the larger particles start to fall. This causes the top of the cloud to develop a strong positive charge.

The larger, negatively charged, ice particles begin to ‘capture’ super-cooled water droplets, turning them instantly to ice and growing, some reaching a sufficient size to start falling.

This leads to the base of the cloud becoming negatively charged which, in turn, induces a positive charge on the ground below. In time, the potential gradient between cloud and ground, or between adjacent clouds, becomes large enough to overcome the resistance of the air and there is a massive, very rapid transfer of electrons, which appears as a lightning flash.

Lightning

lightening show

Thunder
The word thunder is derived from ‘Thor’, the Norse god of thunder. He was supposed to be a red-bearded man of tremendous strength; his greatest attribute being the ability to forge thunderbolts. The word Thursday is also derived from his name.

Thunder is the sharp or rumbling sound that accompanies lightning. It is caused by the intense heating and expansion of the air along the path of the lightning. The rumble of thunder is caused by the noise passing through layers of the atmosphere at different temperatures. Thunder lasts longer than lightning because of the time it takes for the sound to travel from different parts of the flash.

You can roughly estimate how far away a thunderstorm is by measuring the interval between the lightning flash and the start of the thunder. If you count the time in seconds and then divide by three, you will have the approximate distance in kilometres. Thunder is rarely heard at a distance of more than 20 km.

Drought

Drought occurs when there is a lack of rainfall over a long period of time, resulting in water shortages for groups of people, activities or the environment. Droughts have a significant impact on agriculture and can harm the economy.

Causes of lack of rain

  • Water vapour needs to rise high through the atmosphere in order to condense and bring about rain. However, in areas of high pressure, with the air subsides, water vapour does not rise and no rain or clouds will form. When the high pressure stays in an area for a prolonged length of time the result is drought.
  • Mountains effect the movement of air too. Air carrying water vapour will rise higher in order to pass over to the windward side of a mountain. As the air rises it cools causing water vapour to condense bringing about precipitation and when reaching the other side of the mountain it has lost most of its water vapour. The leeward side of a mountain is warmer and drier and in some cases a desert.

dry earth

Web page reproduced with the kind permission of the Met Office

Heatwave Summer 2018

map of ukMore links and images will be added to this page as they are identified.

A comparison between 1976 and 2018 from the BBC.

This fairly lengthy discussion from the Met Office has some good maps and statistics.

Wildfires on Saddleworth Moor and Glenshane Pass, 27.6.18. Image reproduced with thanks from University of Dundee satellite receiving station.

And the corresponding Met Office chart, showing the High pressure/ polar continental conditions which dominated during the heatwave.

Case Study – The Great Smog

The Great Smog of 1952

A fog so thick and polluted it left thousands dead wreaked havoc on London in 1952. The smoke-like pollution was so toxic it was even reported to have choked cows to death in the fields. It was so thick it brought road, air and rail transport to a virtual standstill. This was certainly an event to remember, but not the first smog of its kind to hit the capital.

Smog had become a frequent part of London life, but nothing quite compared to the smoke-laden fog that shrouded the capital from Friday 5 December to Tuesday 9 December 1952. While it heavily affected the population of London, causing a huge death toll and inconveniencing millions of people, the people it affected were also partly to blame for the smog.

During the day on 5 December, the fog was not especially dense and generally possessed a dry, smoky character. When nightfall came, however, the fog thickened. Visibility dropped to a few metres. The following day, the sun was too low in the sky to burn the fog away. That night and on the Sunday and Monday nights, the fog again thickened. In many parts of London, it was impossible at night for pedestrians to find their way, even in familiar districts. In The Isle of Dogs area, the fog there was so thick people could not see their feet.

A history of smog

How the smog of 1952 formed

Impacts of the smog

Response to the smog

A history of smog

Britain has long been affected by mists and fogs, but these became much more severe after the onset of the Industrial Revolution in the late 1700s. Factories belched gases and huge numbers of particles into the atmosphere, which in themselves could be poisonous. The pollutants in the air, however, could also act as catalysts for fog, as water clings to the tiny particles to create polluted fog, or smog.

When some of the chemicals mix with water and air, they can turn into acid which can cause skin irritations, breathing problems, and even corrode buildings. Smog can be identified easily by its thick, foul-smelling, dirty-yellow or brown characteristics, totally different to the clean white fog in country areas.

There are reports of thick smog, smelling of coal tar, which blanketed London in December 1813. Lasting for several days, people claimed you could not see from one side of the street to the other. A similar fog in December 1873 saw the death rate across London rise 40% above normal. Marked increases in death rate occurred, too, after the notable fogs of January 1880, February 1882, December 1891, December 1892 and November 1948. The worst affected area of London was usually the East End, where the density of factories and homes was greater than almost anywhere else in the capital. The area was also low-lying, making it hard for fog to disperse.

How the smog of 1952 formed

The weather in November and early December 1952 had been very cold, with heavy snowfalls across the region. To keep warm, the people of London were burning large quantities of coal in their homes. Smoke was pouring from the chimneys of their houses.

Under normal conditions, smoke would rise into the atmosphere and disperse, but an anticyclone was hanging over the region. This pushes air downwards, warming it as it descends. This creates an inversion, where air close to the ground is warmer than the air higher above it. So when the warm smoke comes out of the chimney, it is trapped. The inversion of 1952 also trapped particles and gases emitted from factory chimneys in the London area, along with pollution which the winds from the east had brought from industrial areas on the continent.

the great smog
1950s car driving in thick smog

Early on 5 December, in the London area, the sky was clear, winds were light and the air near the ground was moist. Accordingly, conditions were ideal for the formation of radiation fog. The sky was clear, so a net loss of long-wave radiation occurred and the ground cooled. When the moist air came into contact with the ground it cooled to its dew-point temperature and condensation occurred. Beneath the inversion of the anticyclone, the very light wind stirred the saturated air upwards to form a layer of fog 100-200 metres deep. Along with the water droplets of the fog, the atmosphere beneath the inversion contained the smoke from innumerable chimneys in the London area.

great smogDuring the period of the fog, huge amounts of impurities were released into the atmosphere. On each day during the foggy period, the following pollutants were emitted: 1,000 tonnes of smoke particles, 2,000 tonnes of carbon dioxide, 140 tonnes of hydrochloric acid and 14 tonnes of fluorine compounds. In addition, and perhaps most dangerously, 370 tonnes of sulphur dioxide were converted into 800 tonnes of sulphuric acid.


Impacts of the smog

The fog finally cleared on December 9, but it had already taken a heavy toll.

  • About 4,000 people were known to have died as a result of the fog, but it could be many more.
  • Many people suffered from breathing problems
  • Press reports claimed cattle at Smithfield had been asphyxiated by the smog.
  • Travel was disrupted for days

Response to the smog

A series of laws were brought in to avoid a repeat of the situation. This included the Clean Air Acts of 1956 and 1968. These acts banned emissions of black smoke and decreed residents of urban areas and operators of factories must convert to smokeless fuels.

People were given time to adapt to the new rules, however, and fogs continued to be smoky for some time after the Act of 1956 was passed. In 1962, for example, 750 Londoners died as a result of a fog, but nothing on the scale of the 1952 Great Smog has ever occurred again. This kind of smog has now become a thing of the past, thanks partly to pollution legislation and also to modern developments, such as the widespread use of central heating.

Web page reproduced with the kind permission of the Met Office

MetLink - Royal Meteorological Society
We use cookies on this site to enhance your user experienceBy clicking any link on this page you are giving your consent for us to set cookies. More info

By clicking any link on this page you are giving your consent for us to set cookies. More info