Case Study – Great Storm

The Great Storm of 1987

A powerful storm ravaged many parts of the UK in the middle of October 1987. 

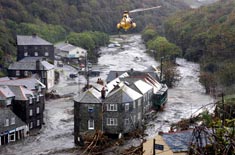
With winds gusting at up to 100mph, there was massive devastation across the country and 18 people were killed. About 15 million trees were blown down. Many fell on to roads and railways, causing major transport delays. Others took down electricity and telephone lines, leaving thousands of homes without power for more than 24 hours.

Buildings were damaged by winds or falling trees. Numerous small boats were wrecked or blown away, with one ship at Dover being blown over and a Channel ferry was blown ashore near Folkestone. While the storm took a human toll, claiming 18 lives in England, it is thought many more may have been hurt if the storm had hit during the day.

The storm gathers

Warning the public

How the storm measured up

A hurricane or not?

The aftermath

The storm gathers

Four or five days before the storm struck, forecasters predicted severe weather was on the way. As they got closer, however, weather prediction models started to give a less clear picture. Instead of stormy weather over a considerable part of the UK, the models suggested severe weather would pass to the south of England – only skimming the south coast.

During the afternoon of 15 October, winds were very light over most parts of the UK and there was little to suggest what was to come. However, over the Bay of Biscay, a depression was developing. The first gale warnings for sea areas in the English Channel were issued at 6.30 a.m. on 15 October and were followed, four hours later, by warnings of severe gales.

At 12 p.m. (midday) on 15 October, the depression that originated in the Bay of Biscay was centred near 46° N, 9° W and its depth was 970 mb. By 6 p.m., it had moved north-east to about 47° N, 6° W, and deepened to 964 mb.

At 10.35 p.m. winds of Force 10 were forecast. By midnight, the depression was over the western English Channel, and its central pressure was 953 mb. At 1.35 a.m. on 16 October, warnings of Force 11 were issued. The depression moved rapidly north-east, filling a little as it went, reaching the Humber estuary at about 5.30 am, by which time its central pressure was 959 mb. Dramatic increases in temperature were associated with the passage of the storm’s warm front.

Warning the public

great stormDuring the evening of 15 October, radio and TV forecasts mentioned strong winds but indicated heavy rain would be the main feature, rather than strong wind. By the time most people went to bed, exceptionally strong winds hadn’t been mentioned in national radio and TV weather broadcasts. Warnings of severe weather had been issued, however, to various agencies and emergency authorities, including the London Fire Brigade. Perhaps the most important warning was issued by the Met Office to the Ministry of Defence at 0135 UTC, 16 October. It warned that the anticipated consequences of the storm were such that civil authorities might need to call on assistance from the military.

great stormIn south-east England, where the greatest damage occurred, gusts of 70 knots or more were recorded continually for three or four consecutive hours. During this time, the wind veered from southerly to south-westerly. To the north-west of this region, there were two maxima in gust speeds, separated by a period of lower wind speeds. During the first period, the wind direction was southerly. During the latter, it was south-westerly. Damage patterns in south-east England suggested that whirlwinds accompanied the storm. Local variations in the nature and extent of destruction were considerable.

How the storm measured up

Fig. 1 shows maximum gusts (in knots) during the storm.

Comparisons of the October 1987 storm with previous severe storms were inevitable. Even the oldest residents of the worst affected areas couldn’t recall winds so strong, or destruction on so great a scale.

  • The highest wind speed reported was an estimated 119 knots (61 m/s) in a gust soon after midnight at Quimper coastguard station on the coast of Brittany (48° 02′ N 4° 44′ W).
  • The highest measured wind speed was a gust of 117 knots (60 m/s) at 12.30 am at Pointe du Roc (48° 51′ N, 1° 37′ W) near Granville, Normandy.
  • The strongest gust over the UK was 100 knots at Shoreham on the Sussex coast at 3.10 am, and gusts of more than 90 knots were recorded at several other coastal locations.
  • Even well inland, gusts exceeded 80 knots. The London Weather Centre recorded 82 knots at 2.50 am, and 86 knots was recorded at Gatwick Airport at 4.30 am (the authorities closed the airport).

A hurricane or not?

TV weather presenter Michael Fish will long be remembered for telling viewers there would be no hurricane on the evening before the storm struck. He was unlucky, however, as he was talking about a different storm system over the western part of the North Atlantic Ocean that day. This storm, he said, would not reach the British Isles — and it didn’t. It was the rapidly deepening depression from the Bay of Biscay which struck.
This storm wasn’t officially a hurricane as it did not originate in the tropics — but it was certainly exceptional. In the Beaufort scale of wind force, Hurricane Force (Force 12) is defined as a wind of 64 knots or more, sustained over a period of at least 10 minutes. Gusts, which are comparatively short-lived (but cause a lot of destruction) are not taken into account. By this definition, Hurricane Force winds occurred locally but were not widespread.

The highest hourly-mean speed recorded in the UK was 75 knots, at the Royal Sovereign Lighthouse. Winds reached Force 11 (56–63 knots) in many coastal regions of south-east England. Inland, however, their strength was considerably less. At the London Weather Centre, for example, the mean wind speed did not exceed 44 knots (Force 9). At Gatwick Airport, it never exceeded 34 knots (Force 8).

The powerful winds experienced in the south of England during this storm are deemed a once in 200 year event — meaning they were so unusually strong you could only expect this to happen every two centuries. This storm was compared with one in 1703, also known as a ‘great storm’, and this could be justified. The storm of 1987 was remarkable for its ferocity, and affected much the same area of the UK as its 1703 counterpart.

Northern Scotland is much closer to the main storm tracks of the Atlantic than south-east England. Storms as severe as October 1987 can be expected there far more frequently than once in 200 years. Over the Hebrides, Orkney and Shetland, winds as strong as those which blew across south-east England in October 1987 can be expected once every 30 to 40 years.

The 1987 storm was also remarkable for the temperature changes that accompanied it. In a five-hour period, increases of more than 6 °C per hour were recorded at many places south of a line from Dorset to Norfolk.

The aftermath

Media reports accused the Met Office of failing to forecast the storm correctly. Repeatedly, they returned to the statement by Michael Fish that there would be no hurricane — which there hadn’t been. It did not matter that the Met Office forecasters had, for several days before the storm, been warning of severe weather. The Met Office had performed no worse than any other European forecasters when faced with this exceptional weather event.

However, good was to come of this situation. Based on the findings of an internal Met Office enquiry, scrutinised by two independent assessors, various improvements were made. For example, observational coverage of the atmosphere over the ocean to the south and west of the UK was improved by increasing the quality and quantity of observations from ships, aircraft, buoys and satellites, while refinements were made to the computer models used in forecasting.

Strength of gusts

Fig 1. Graphic showing areas with strengths of maximum gusts.

Case Study – Floods

Floods and flooding

Floods can be devastating — costing the lives of people and animals, as well as destroying crops, homes and businesses.

The east coast of England and the Netherlands have always been prone to flooding as storms track off the North Sea, bringing water surges and huge waves with them.

The devastation floods can cause

Flooding caused by surges

The surge of 1953

Storm tide warnings

What happened to cause this storm?

Surges still causing damage

Flood defences

The devastation floods can cause

About 10,000 people died in a single flood in the Netherlands in 1421. Water from the North Sea flooded inland and swept through 72 villages, leaving a trail of destruction.

Further severe floods struck the region in 1570, 1825, 1894, 1916 and 1953. All of them occurred despite the area having extensive flood defence systems — sometimes nature’s power is just too strong. These defences are vital for the Netherlands, where 40% of the country is below sea level.

Along the coast of eastern England there have also been many failures of coastal defences. Even London has seen disastrous flooding. In January 1928 a northerly gale raised water levels in the Thames Estuary. Water overtopped embankments and low-lying riverside districts were flooded in the city, drowning 14 people.

Flooding caused by surges

Tides affect sea levels, but sometimes the weather will also play its part in raising or lowering water height. This is called a surge and is measured by how much higher or lower the sea is than expected on any given tide. A surge is positive if the water level is higher than the expected tide, and negative if lower. Positive surges happen when water is driven towards a coast by wind and negative when it is driven away.

While wind is the main cause of surges, barometric pressure – the pressure in the air — also plays its part. When pressure decreases by one millibar, sea level rises by one centimetre. Therefore, a deep depression with a central pressure of about 960 mb causes sea level to rise half a metre above the level it would have been had pressure been about average (1013 mb). When pressure is above average, sea level correspondingly falls.

When strong winds combine with very low pressure they can raise the sea level in eastern England by more than two metres. Fortunately such surges normally occur at mid-tide levels — so do not cause as much damage. If they were to coincide with high tide it could be a very different story.

Surges travel counter-clockwise around the North Sea — first southwards down the western half of the sea, then northwards up the western side. They take about 24 hours to progress most of the way around.

Waves, generated by strong winds, are another flooding factor. While coastal defences are designed to deal with high tides, these defences can be badly damaged by a pounding from large and powerful waves. Some waves are so large that they simply break over coastal defences, sending water flooding in and undermining sea-wall foundations until they collapse.

The surge of 1953

More than 2,000 people drowned at the end of January 1953 when the greatest surge on record, happened in the North Sea. The surge measured nearly three metres in Norfolk and even more in the Netherlands. About 100,000 hectares of eastern England were flooded and 307 people died. A further 200,000 hectares were flooded in the Netherlands, and 1,800 people drowned.

The storm that caused this disastrous surge was among the worst the UK had experienced.

  • Hurricane force winds blew down more trees in Scotland than were normally felled in a year.
  • A car ferry, the Princess Victoria, sank with the loss of 133 lives — but 41 of the passengers and crew survived.
  • From Yorkshire to the Thames Estuary, coastal defences were pounded by the sea and gave way under the onslaught.

As darkness fell on 31 January, coastal areas of Lincolnshire bore the brunt of the storm.

  • Sand was scoured from beaches and sand hills
  • Timber-piled dunes were breached
  • Concrete sea walls crumbled
  • The promenades of Mablethorpe and Sutton-on-Sea were wrecked.
  • Salt water from the North Sea flooded agricultural land

Later that evening, embankments around The Wash were overtopped and people drowned in northern Norfolk. At Wells-next-the-Sea, a 160-ton vessel was left washed up on the quay after waves pounded it ashore.

In 1953, because many telephone lines in Lincolnshire and Norfolk were brought down by the wind, virtually no warnings of the storm’s severity were passed to counties farther south until it was too late. Suffolk and Essex suffered most.

By midnight, Felixstowe, Harwich and Maldon had been flooded, with much loss of life. Soon after midnight, the sea walls on Canvey Island collapsed and 58 people died. At Jaywick in Clacton, the sea rose a metre in 15 minutes and 35 people drowned.

The surge travelled on. From Tilbury to London’s docklands, oil refineries, factories, cement works, gasworks and electricity generating stations were flooded and brought to a standstill.

In London’s East End, 100 metres of sea wall collapsed, causing more than 1,000 houses to be inundated and 640,000 cubic metres of Thames water to flow into the streets of West Ham. The BP oil refinery on the Isle of Grain was flooded, and so was the Naval Dockyard at Sheerness.

Storm tide warnings

The disastrous surge of 1953 was predicted successfully by the Met Office and the Dutch Surge Warning Service. Forecasts of dangerously high water levels were issued several hours before they happened. An inquiry into the disaster recommended, however, that a flood warning organisation should be set up. This led to the setting up of the Storm Tide Warning Service.

 
What happened to cause this storm?

In the early hours of 30 January 1953, the storm that was to cause the havoc was a normal looking depression with a central pressure of 996 mb, located a little to the south of Iceland. While it looked normal, during the day the pressure rapidly deepened and headed eastwards.

By 6 p.m. on 30 January, it was near the Faeroes, its central pressure 980 mb. By 12p.m. (midday) on 31 January, it was centred over the North Sea between Aberdeenshire and southern Norway and its central pressure was 968 mb.

Meanwhile, a strong ridge of high pressure had built up over the Atlantic Ocean south of Iceland, the pressure within being more than 1030 mb. In the steep pressure gradient that now existed on the western flanks of the depression, there was a very strong flow from a northerly point. Winds of Force 10 were reported from exposed parts of Scotland and northern England. The depression turned south-east and deepened to 966 mb before filling. By midday on 1 February, it lay over northern Germany, its central pressure 984 mb.

All day on 31 January, Force 10/11 winds blew from the north over western parts of the North Sea. They drove water south, and generated waves more than eight metres high. The surge originated in the waters off the north-east coast of Scotland and was amplified as it travelled first southwards along the eastern coasts of Scotland and England, and then north-east along the coast of the Netherlands. It reached Ijmuiden in the Netherlands around 4 a.m. on 1 February.

Surges still causing damage

Since 1953, there have been other large surges in the North Sea. Among them one, on 12 January 1978, caused extensive flooding and damage along the east coast of England from Humberside to Kent. London came close to disaster, escaping flooding by only 0.5 m, and the enormous steel and rubber floodgates designed to protect the major London docks were closed for the first time since their completion in 1972.

Flood defences

Concern over rising sea levels, and the potential catastrophe if London were to be flooded, led the Government to build the Thames Flood Barrier. Based at Woolwich and finished in 1982, it is the world’s second largest movable flood barrier. It is designed to allow ships to pass in normal times, but flood gates come down to stop storm surges in times of need. The barriers are closed about four times a year, on average.

Over the years, coastal defences in the Netherlands and eastern England have been raised and strengthened continually to protect against storm surges. Our coasts and estuaries are safer now than they have ever been. Nevertheless, surges remain a threat, as complete protection against the most extreme can never be guaranteed.

The likelihood of being taken by surprise is now lower, because weather and surge forecasting systems have improved greatly in recent years, and the Storm Tide Forecasting Service has established clear and effective procedures for alerting the authorities when danger threatens.

Aerial photo of flooded houses in 1953
Photo of a flooded road in 1953
floods
Waves breaking against a cliff

Web page reproduced with the kind permission of the Met Office

Case Study – Boscastle Floods

Floods Devastate Village

On 16 August 2004, a devastating flood swept through the small Cornish village of Boscastle.

Very heavy rain fell in storms close to the village, causing two rivers to burst their banks. About two billion litres of water then rushed down the valley straight into Boscastle.

Residents had little time to react. Cars were swept out to sea, buildings were badly damaged and people had to act quickly to survive. Fortunately, nobody died – thanks largely to a huge rescue operation involving helicopters — but there was millions of pounds worth of damage.

Physical Impacts

Responses to the flooding

What happened to cause this event?

Physical Impacts

Flooding
On the day of the flood, about 75mm of rain fell in two hours — the same amount that normally falls in the whole of August. Huge amounts of water from this sudden downpour flowed into two rivers, the Valency and Jordan (which flows into the Valency just above Boscastle). Both overflowed, and this caused a sudden rush of water to speed down the Valency — which runs through the middle of Boscastle.

Destruction of houses, businesses and gardens
Floodwater gushed into houses, shops and pubs. Cars, walls and even bridges were washed away. The church was filled with six feet of mud and water. Trees were uprooted and swept into peoples’ gardens. The weight of water eroded river banks, damaged gardens and pavements.

Human Impacts
There was a huge financial cost to the floods. This included:

  • the rescue operation – involving helicopters, lifeboats, and the fire service.
  • the loss of 50 cars
  • damage to homes, businesses and land
  • a loss of tourism, a major source of income for the area

The flooding also had several other key impacts on Boscastle and its inhabitants. These included:

  • environmental damage to local wildlife habitats
  • coastal pollution caused as debris and fuel from cars flowed out to sea.
  • long-term disruption to the village, as a major rebuild project had to be carried out.
  • long-term stress and anxiety to people traumatised by the incident.

Responses to the flooding

  • John Prescott, the Deputy Prime Minister, and Prince Charles visited members of the emergency services and the local GP surgery, which acted as the emergency centre, in the days following the disaster.
  • Prince Charles, who is the Duke of Cornwall, made a large donation to a fund to help rebuild parts of Boscastle.
  • The Environment Agency is responsible for warning people about floods and reducing the likelihood of future floods. The Environment Agency has carried a major project to increase flood defences in Boscastle, with the aim of preventing a similar flood happening again.
  • We are investing in new ways of predicting heavy rainfall events on a small scale to produce better warnings.

In Pictures

boscastle flooding
Aerial photo of the flood waters gushing through Boscastle (courtesy of Apex News &∓ Pictures)
Map of the area affected

What happened to cause this event?

Weather map Fig. 1 shows the weather map for midday on 16 August. The wind is blowing anticlockwise about the low pressure area, so the air is arriving into Boscastle from a south-westerly direction. It is a warm and moist tropical maritime air mass. The line labelled (known as a trough line) caused very heavy rain and thunderstorms. A trough is an area of localised rain and thunderstorms. A line of convergence formed near the coast line, where air moving in almost opposite directions collides, this helped to increase the rate of ascent and produced very heavy rain. There is more about surface pressure charts in the weather section of the Met Office website.

Weather chart

Fig 1. A weather chart from 16/08/2004.

Radar imagery

Fig 2. Rainfall Radar

Fig. 2 shows radar pictures at 12 p.m. (midday)  on 16 August.

The rainfall rate key shows how the colours in the image relate to the rate the rainfall is falling. For example, the red areas indicate that rain is falling at between eight and 16 mm per hour.

A line of very heavy rain starts at about 1 p.m. on the moors close to Boscastle. It remains over the area for about six hours. Rainfall rates of at least 32 mm per hour are being measured.

There is more about rainfall radar in the weather section of the Met Office website.

Satellite imagery
Fig. 3 shows an animation of satellite pictures from 12 p.m. (midday) to 7 p.m. on 16 August.

Fig. 3: Satellite image

The thickest cloud is shown by the brightest white areas on the picture. The pictures show cloud forming over Boscastle at about 1 p.m. and staying there for much of the afternoon.

Further information on other websites
BBC News website covering the Boscastle flooding
BBC News article – Boscastle one year on

Boscastle 16 August 2004 the day of the flood, 2006, Galvin, 61, 29

Web page reproduced with the kind permission of the Met Office

Case Study – Bodmin Snow

A snowy day in Winter 2005

Heavy snow stops traffic on main route through Cornwall.
Traffic moving on snowy road.
Traffic Jam on A30
Traffic Jam on A30

More than 1,000 people were left stranded in their vehicles on one of the busiest roads in Cornwall because of heavy snowfall. On Friday 25 November 2005 hundreds of cars became stuck on the A30 over Bodmin Moor after the slippery conditions caused a crash involving several cars. Helicopters and all-terrain vehicles were brought in to rescue the stranded motorists, taking them to emergency accommodation in nearby leisure centres for the night.

Many children also got stuck in their schools for several hours, as the snow meant they could not leave and parents could not come to collect them. Almost 70 of Cornwall’s 273 schools were closed.

Impacts

Health and wellbeing
Despite the terrible conditions and many crashes, the only injuries to people involved a fire engine, which came off the A30 on the way to answer an emergency call. One firefighter was taken to hospital by helicopter with serious, but not life-threatening, injuries.

Disruption to transport

Map showing the area in Cornwall affected by the snow

A30 closed with gridlocked traffic. Railway services were affected. Fallen trees on one of the railway lines from London to Penzance caused trains to be delayed.

People stranded at home/on the road/at school
About 2,000 school pupils were stuck in schools and their teachers had to look after them. Some school children were forced to stay at homes of teachers and friends, and in hotels. A number of weather-sensitive outdoor events and some indoor events, such as pony show-jumping competitions, were cancelled on Saturday 26 November.

Financial effects on local economy
Likely to have ran into several hundreds of thousands, or even millions, of pounds. There was the cost of carrying out rescue operations and setting up of emergency shelters. The impact of people not attending work and goods not being delivered to businesses is likely to have added to the cost of the incident.

What happened to cause this weather?

Snow
Snow is a frozen type of precipitation. Precipitation also includes rain, hail, sleet, fog etc. Snow normally occurs when precipitation occurs and the air temperature at ground level is below 2 °C. Snow is most common in the UK in the winter months. The snow which affected the south-west of England on 25 November was an unusual occurrence in November, as it an autumn month.

Snow depths tend to only be measured once per day at 9 a.m. It is likely that at the height of the event snow depths were greater, but this may have melted overnight. There may also be other locations, where there are no weather stations, which had greater depths of snow.

Weather chart
Snow can occur when air reaches us from a northerly or easterly direction, this helps to define the air mass.

Fig. 1 shows the weather chart at midday on Friday 25 November. The blue arrows show air has moved down from the Arctic to reach south-west England. This air is flowing anticlockwise around the area of low, so the wind direction over the south-west of England is a northerly.

The air mass type is Arctic Maritime. This is cold and moist air which often has periods of snow. The little cold front over south-west England, shown by a line with triangles, indicates where the snow is long-lasting and heaviest. There is more about surface pressure charts in the weather section of the Met Office website.

Satellite imagery
Fig. 2 is an animation visible satellite images from 1 p.m. to 5 p.m. on Friday 25 November.

The brightest white areas show where the thickest cloud is and where snowfall is most likely to be falling. The thickest cloud occurs over Bodmin Moor at around 2 p.m. and 3 p.m.

The satellite is sensing how much sunlight is being reflected from the cloud. The darkening of the last image is about the time of sunset at 5 p.m. The dark areas of the picture over Exeter at 3 p.m. and 4 p.m. show where the cloud has cleared.


Weather chart

Fig 1. A weather chart from 25/11/2005.

Satellite imagery

Fig 2. Animation of satellite images


Radar imagery
Fig. 3 is a animation of the radar imagery from 11 a.m. to 6 p.m. on Friday 25 November. The legend, or key, shows the water equivalent in millimetres (mm) per hour. 1 mm of water is about the same as a 10 mm deep snowfall.

The radar imagery suggests the band of snow is moving westwards. It shows that it snowed for most of the day over Bodmin Moor before stopping around 6 p.m. It also suggests some high rates of snowfall at times, shown by the pink colours, e.g. 8.0-12.0 mm per hour.

Air temperatures
The temperature remained below 1 °C for the whole of this period on Bodmin Moor, and over much of the surrounding area. When the precipitation occurred, it did fall as snow and, because the roads were so cold, it was easy for it to settle on the A30 road surface.

Radar imagery

Fig 3. Rainfall radar.


Web page reproduced with the kind permission of the Met Office

Case Studies

Extreme Weather (UK)

A series of downloadable lesson plans and teacher’s notes prepared on extreme weather for A level geography.

Produced by Rob Pugh

Work scheme on extreme weather


UK extreme weather information can be found here and on the Met Office website