Topic: Climate Zones


Resources for 11-14 Year Old Students
Weather and Climate: a Teachers’ Guide is our new scheme of work with associated CPD materials for teachers of 11-14 geography.
Below you will find other selected resources suitable for this age group.
Unit 1: Measuring, Recording and Presenting UK Weather
Weather questions starter activity.
Drawing Climate Graphs: Student Worksheet and Teachers Notes.
Using leaves as thermometers: Student Worksheet, Leaf Cards and Leaf Graph.
Drawing contour maps of rainfall: Student Worksheet.
Using weather instruments: Student Worksheet and Teachers Notes.
Simple weather fieldwork using USB temperature dataloggers: Guidance document and report from Weather magazine.
Unit 2: The impacts of Weather
Homework activity – assess how the weather affects you through a week.
Using weather data to investigate whether sports events can go ahead (Developed by Martin Sutton and previously published in Teaching Geography)
Met Office resource looking at correlation between classroom behaviour and weather with student worksheet and answers for teachers. Note the appearance of WOW has changed a little since this resource was written, but the St Athan data can be found by typing St-Athan or 3034 into the search box.
A simple and effective lesson plan which uses WOW data to identify Urban Heat Islands. The supporting PowerPoint presentations can be found here and here.
Urban heat island isotherm drawing exercise: notes for teachers, idealised weather station data for isotherm drawing, satellite image of Birmingham and solution for teachers.
Urban Heat Islands: a three lesson fieldwork resource, using a class set of simple digital thermometers to make a temperature map of the school’s catchment area. The lessons cover Urban Heat Island background information, fieldwork planning and data collection, display and analysis. Teachers notes and PowerPoints 1, 2 and 3.
Unit 3: The Difference between Weather and Climate
The difference between weather and climate: Student Worksheet.
Unit 4: Global Climate and Biomes
Climate zones starter activity.
Climate Zone Activities: Teachers Notes.
On this map of the world , ask the students to write on the following country names in green: UK, New Zealand, North Carolina (USA) and Uruguay; the following countries in yellow Arizona (USA), Namibia, Mali, Saudi Arabia and Western Australia; and the following countries in red Indonesia, Democratic Republic of Congo, Colombia and Hawaii– what pattern can they see?
[according to the standard Köppen classification, the green countries have a temperate or cold climate without a dry season, the yellow countries a Dry (desert or semi-arid climate) and the red countries a Tropical climate]
Show our short video on YouTube the Global Atmospheric Circulation
Use this Global Atmospheric Circulation practice exercise.
Look at the current circulation on nullschool. Where is the ITCZ now?
Comparing weather data from different climate zones.
Unit 5: Polar and Hot Desert Environments
We do not currently have any resources for this unit. What would you find useful?
Unit 6: The Climate of the last 11,000 Years
Interpreting a climate graph: Student Worksheet.
Our ‘Green Sahara’ resource can be found on this page.
Our ‘Climate Change and the Vikings’ resource can be found on this page with Teachers Notes.
Our ‘Year With no Summer’ investigation can be found on this page.
Our resources looking at the effect of the Sun on climate, and on the Greenhouse Effect, Global Warming and Dimming can be found on this page.
A ‘De Bono’ hat activity looking at the impact of climate change: Teachers Notes, Students Worksheet and Students Worksheet .
Climate debate: Students Worksheet , Introductory PowerPoint , Help Cards, Debate Card 1 and Debate Card 2
Unit 7: UK Air Masses and Depressions
Weather Taboo – some sample Taboo cards looking at air mass and depression words. Please share any further ones you develop with us!
Air Masses revision – a Human Board Game.
Using weather data to investigate the effects of different air masses on UK weather teachers notes with worksheets for students.
Red sky at Night, Shepherd’s Delight worksheet and Teacher’s Notes – a resource looking at how our prevailing wind direction means this saying is largely true.
Identify the features of a depression on a simple weather map.
Cold and warm fronts – some activities for differentiation and revision.
Using WOW data to investigate a depression passing across the UK with worksheets for students including more isoline drawing practice.
Mid latitude weather systems basics: Teachers Notes, Introduction to the formation of a depression and Student Worksheet, more detailed PowerPoint about the formation of a depression, Student Worksheet – passage of a depression and practise drawing a cross section through a depression PowerPoint exercise.
Pop up depression – fold a 3 dimensional depression (simple and more detailed versions).
Impacts of a depression – PowerPoint (wont link) and Student Worksheet.
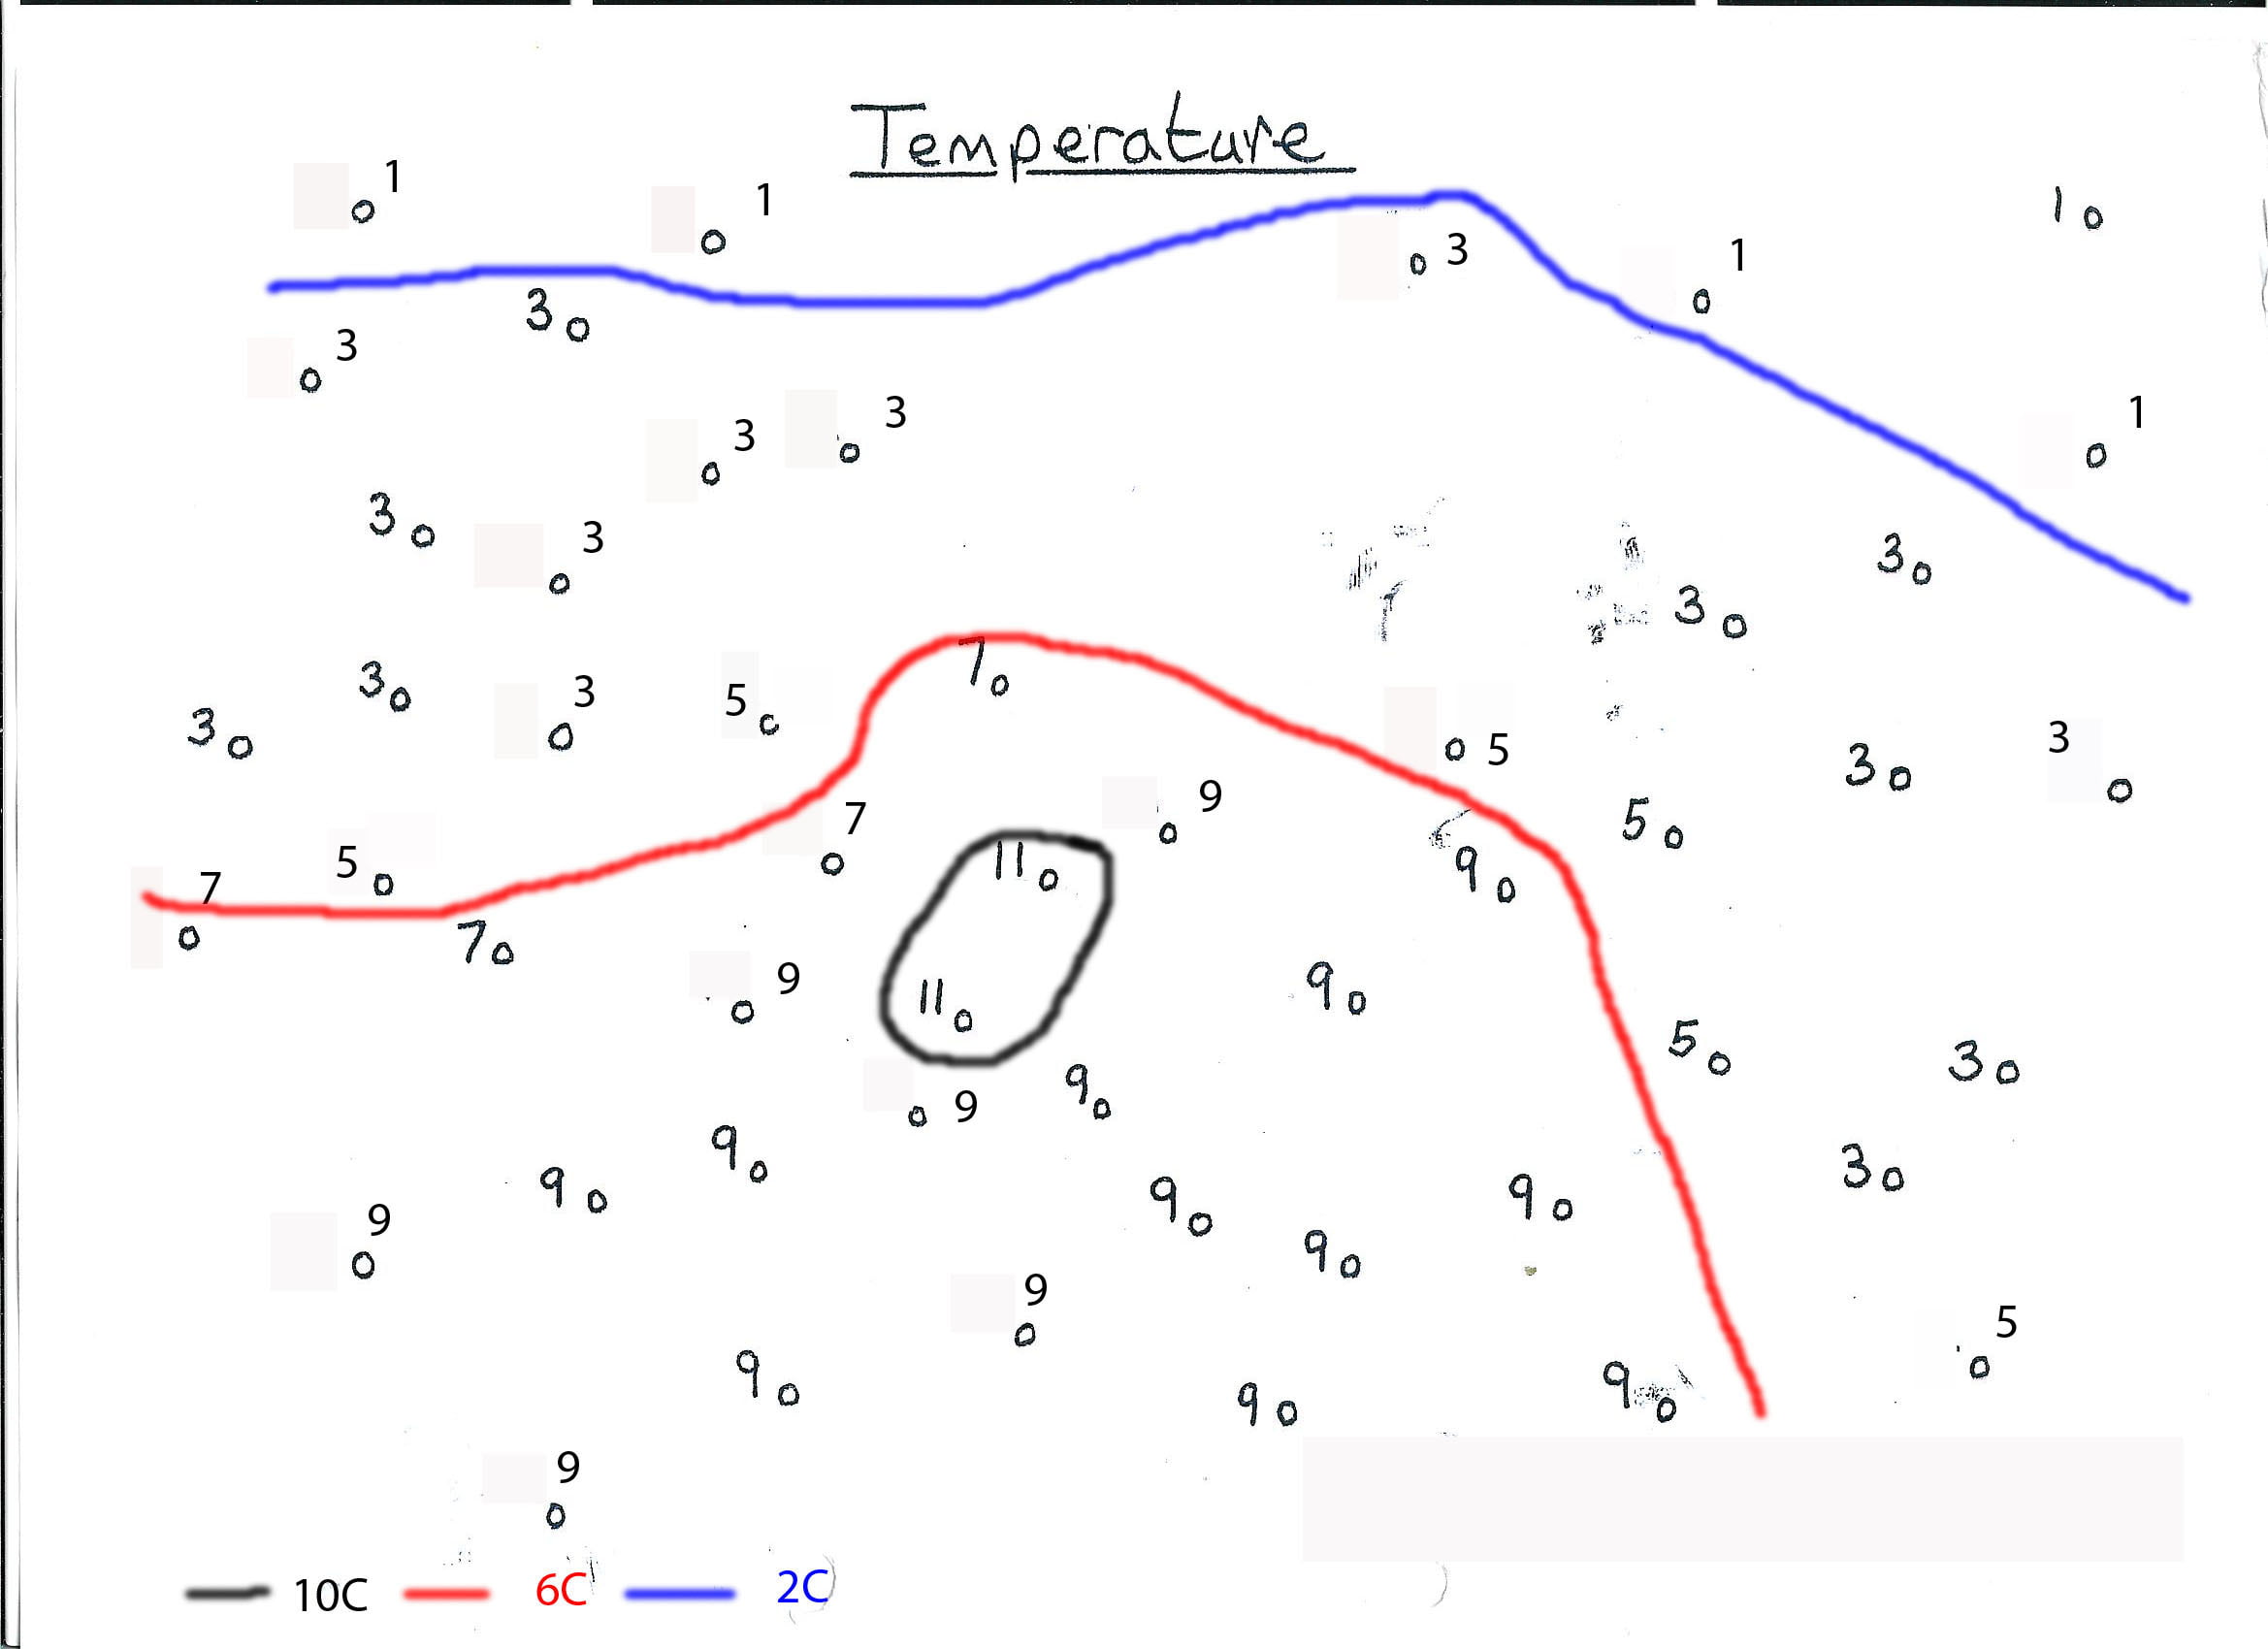
Isotherm and Isobar drawing exercise based on a depression: student worksheet. A simpler version of the T/ isotherm map can be found here or the full version including solutions may be found on the A level page.
Unit 8: Global Weather Hazards
Tropical Cyclones scheme of work
Tropical Cyclones worksheet looking at locations, climatology etc.
Tracking Hurricane Irma an online research exercise.
A starter activity which looks at the duration, frequency and impacts of various global weather phenomena.
Starter activity – Weather Words Quiz
Extreme temperatures around the world GIS exercise developed by Joseph Kerski at ESRI.
Using GIS for hurricane tracks and tropical storm risk (Developed by Bob Lang, teacher and GA consultant)
A wonderful introduction to Air Masses from the BBC’s The Battle Of The Weather Fronts – The Great British Weather using some very loud rugby players!
An excellent GA resource investigating weather conditions needed for the various Olympic sporting events using weather station or WOW data.
Resources looking at change of state, latent heat, data handling and the Electromagnetic Spectrum from the NCAS/ DIAMET project.
A science upd8 resource looking at rain and cloud seeding.
A link to Radical Geography’s activities and resources tried and tested in the classroom weather and climate .
Four lesson plans from the BBC weather centre.
An online, interactive lesson going from weather data collection through to forecasting from NGfL Cymru.
An interactive introduction to weather systems and fronts from NGfL Cymru.
BBC bitesize explanations of weather systems, symbols, charts and processes.
Online, interactive lessons on climate change from NGfL Cymru here and here
An Inconvenient Truth the climate change film pack (look under essential reading and DCSF lesson resources)
Met Office climate introduction
Climate change and information from Ice Cores from WAIS divide.