Climate-based questions for students and teachers. A team of students and academics at the University of Oxford developed these Maths for Planet Earth questions.

Climate-based questions for students and teachers. A team of students and academics at the University of Oxford developed these Maths for Planet Earth questions.
I can demonstrate an understanding of weather and climate by explaining the relationship between weather and air pressure.
A data based resource looking at rainfall and pressure: Worksheet below and Teachers Notes.
Alternative resource: Red sky at Night, Shepherd’s Delight worksheet and Teacher’s Notes – a resource looking at how our prevailing wind direction means this saying is largely true.
Name: Date:
Investigating the Link Between Between Pressure and Rainfall
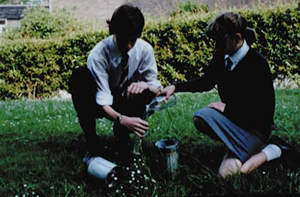
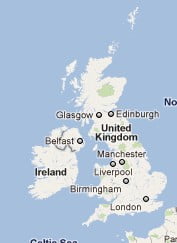
Here is some data collected by a weather station on the outskirts of Edinburgh, at the start of 2019.
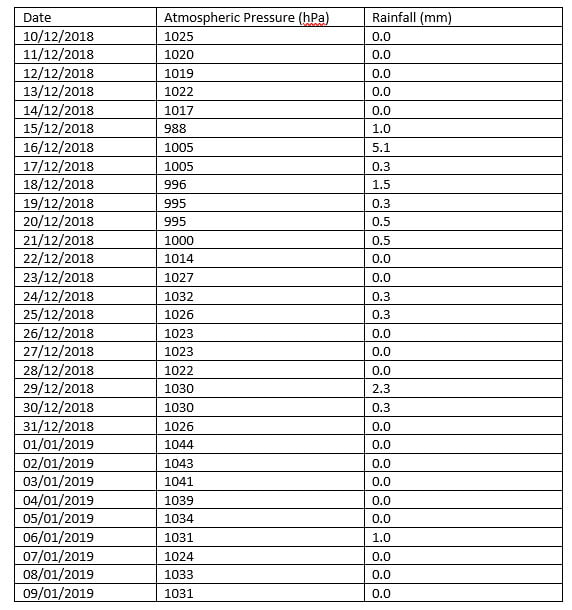
Using this data, draw a graph of rainfall against pressure.

Now use this information to complete the following sentences:
The most it rained in one day was _______________mm.
It didn’t rain at all on ____________ days.
The highest pressure recorded was ______________hPa (a hPa is the same as a millibar).
The lowest pressure recorded was _______________hPa.
Does it always rain when the pressure is low? Use figures to justify your answer.
____________________________________________________________________________________________________________________________________________________________________________________________________________________________________________________________________________________________________________________________________________________________________________________________
Does it ever rain when the pressure is high? Use figures to justify your answer.
____________________________________________________________________________________________________________________________________________________________________________________________________________________________________________________________________________________________________________________________________________________________________________________________
Many weather apps assume that if the pressure is low, it will rain. Does your graph justify this assumption?
_____________________________________________________________________________________________________________________________________________________________________________________________________________________________________________________________________________________________
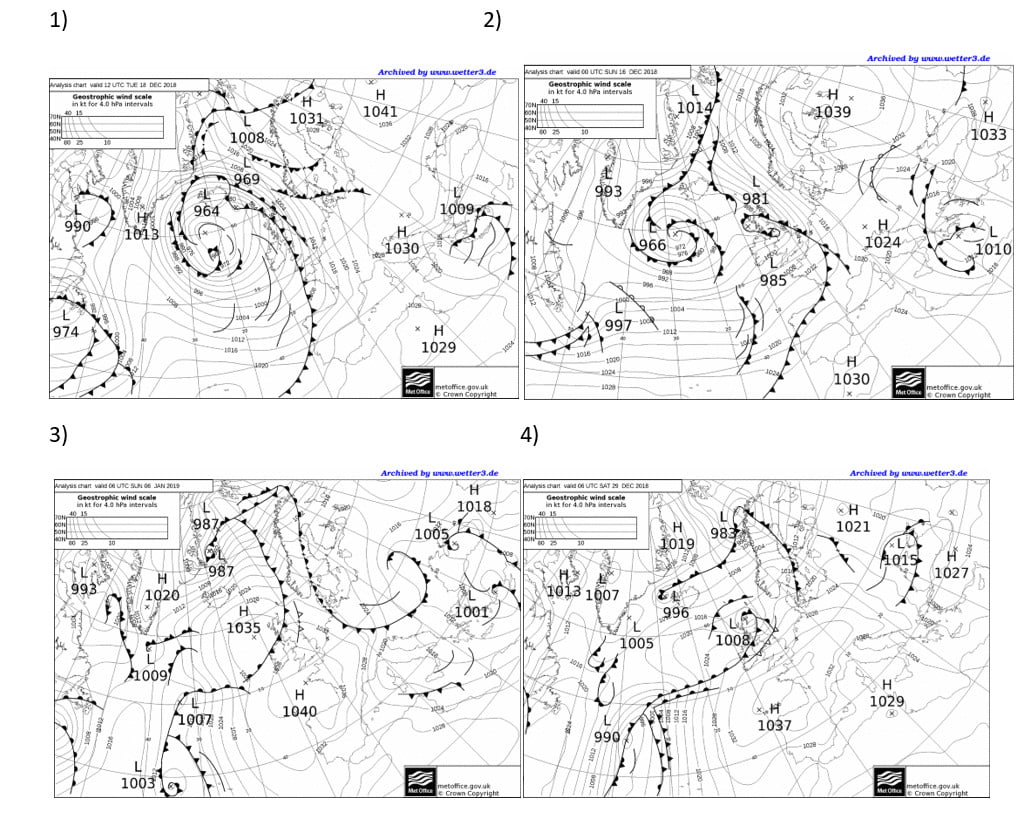
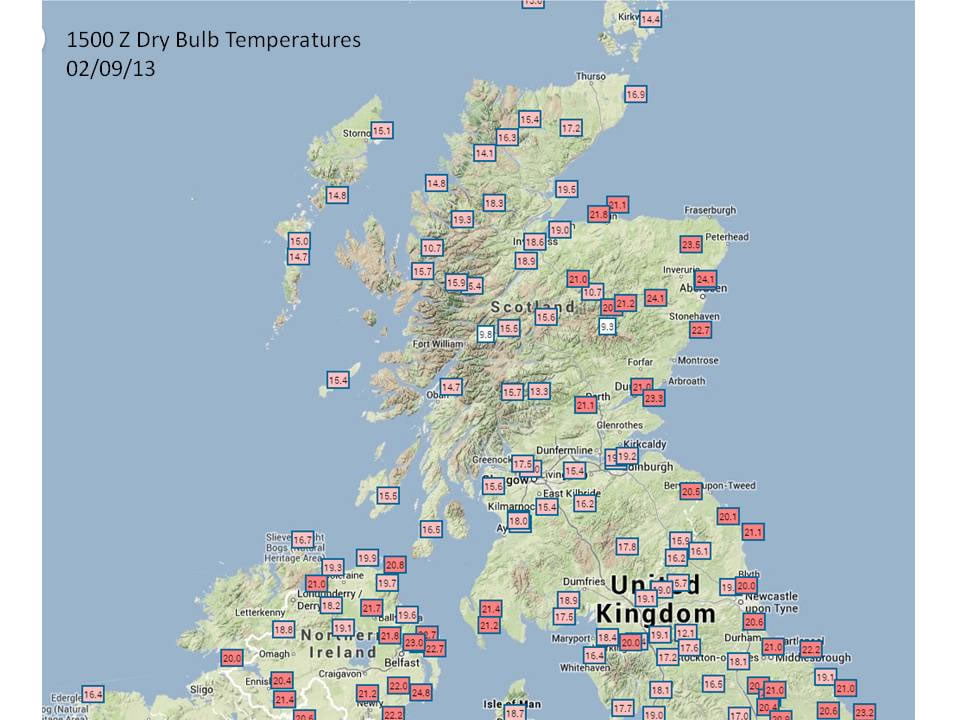
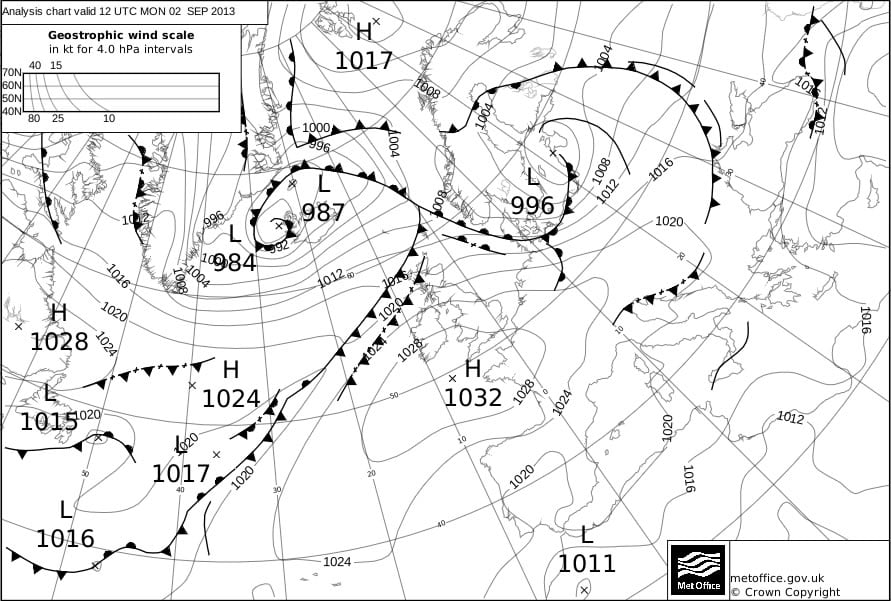
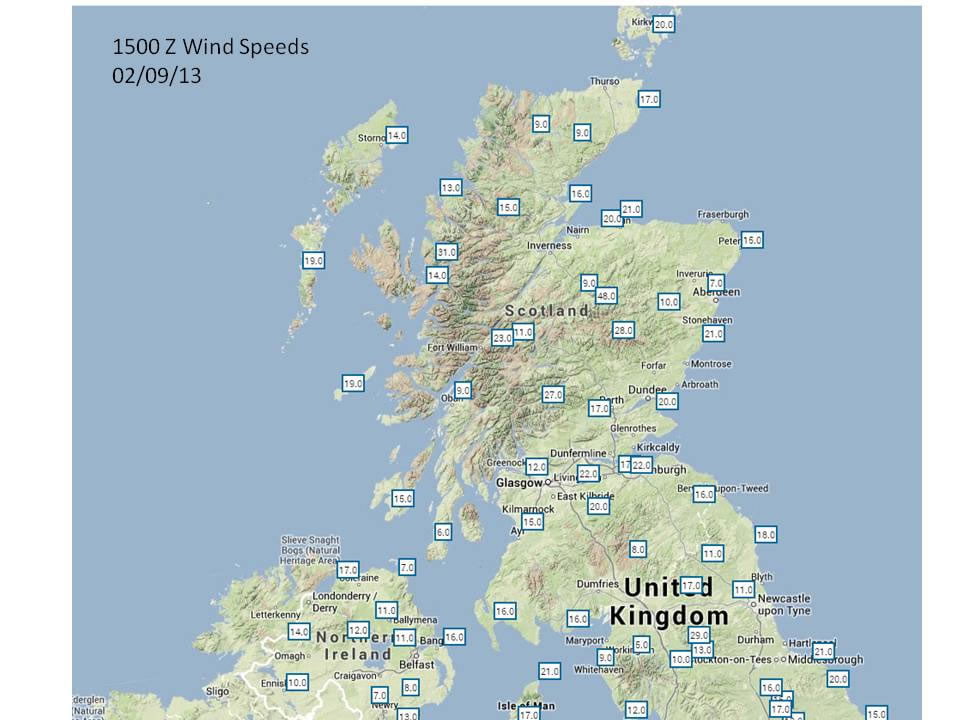
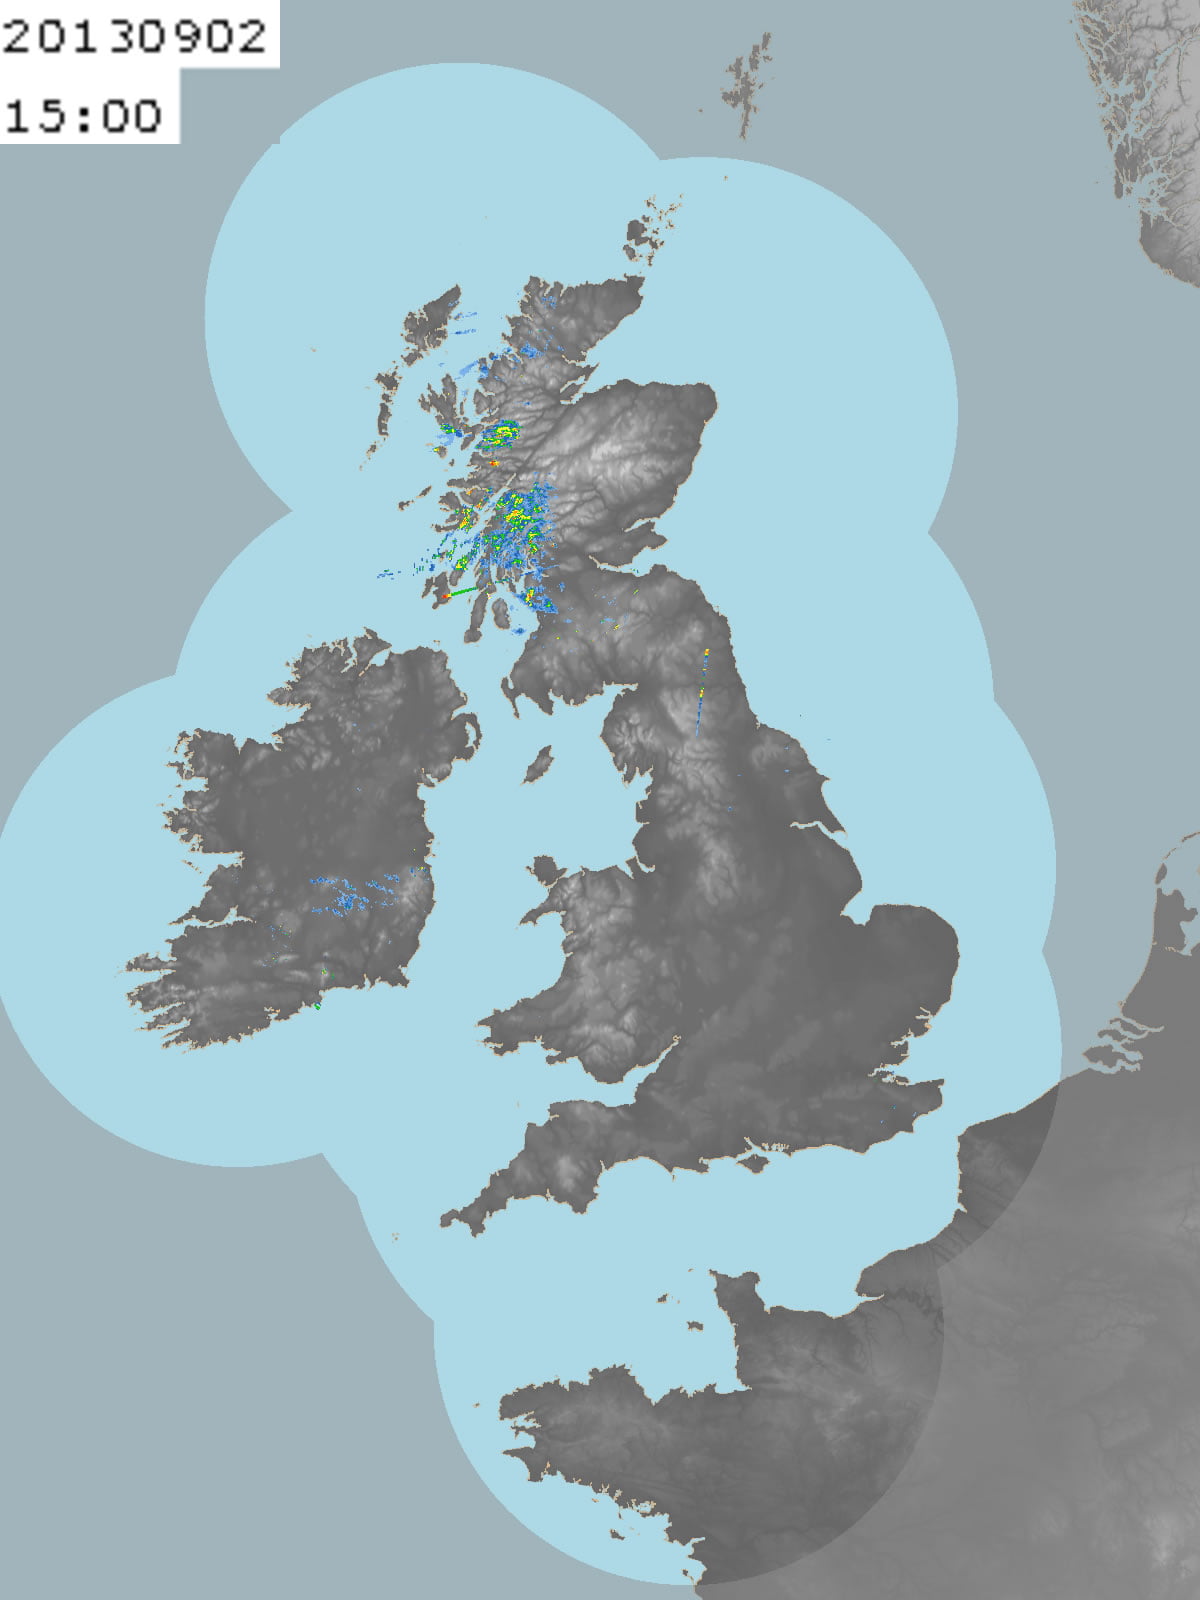
Here are the weather maps for 4 of the days when it rained: the first 3 show when the pressure was low and the 4th shows when the pressure was high and it rained.
Climate is the average weather over a long time period (30 years) for a particular region or place. The climate affects a number of environmental factors within the region including the type and growth of vegetation and wildlife. The climate is determined by large scale factors such as the Earth’s orbit around the Sun, the position of the continents and the composition of the atmosphere. Weather describes the short-term state of our atmosphere. This may include information about the air temperature, precipitation, air pressure and cloud cover. Our local weather changes daily due to the movement of air in our atmosphere.
I can investigate the relationship between climate and weather.
2 dice
Tally chart for numbers 2-12 Graph paper
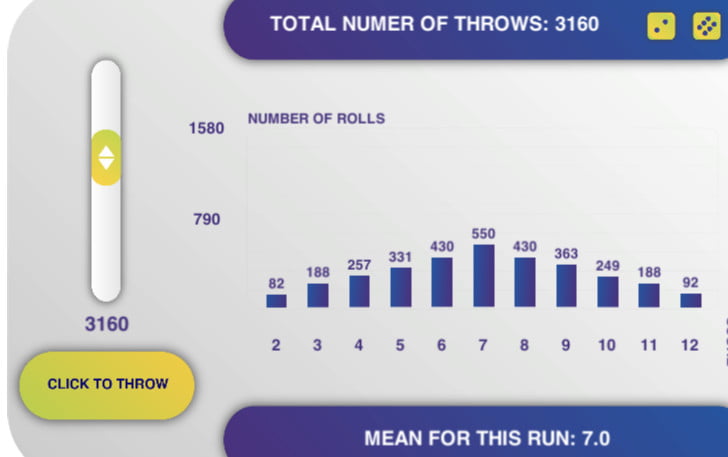
In pairs, throw the two dice about 100 times and record the combined score shown each time.
Draw a bar graph of the results.
The results should show a smoothish distribution, with a score of 7 being most frequent. Ask each group to predict what their score will be if they throw the dice one more time – they can’t. However, with one more throw, the mean of all the scores will stay about the same (about 7). In the same way, the weather may be very different from day to day but the climate, the weather we ‘expect’, stays about the same.
If you don’t have access to dice, you can do this activity online at https://www.metlink.org/blog/weather-climate-extreme-weather-and-chaos-theory/
Can the students design a concept cartoon to illustrate the difference between weather and climate? See https://www.stem.org.uk/system/files/elibrary-resources/legacy_files_migrated/1292WEATHER.PDF and http://www.millgatehouse.co.uk/concept-cartoons-research/
A YouTube video showing an owner and his dog, as an analogy for weather and climate
I can describe the physical processes of a natural disaster (extreme weather event)
and discuss its impact on people and the landscape.
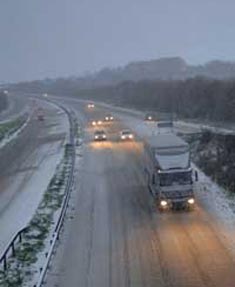
Suggested Lessons: The Beast from the East
Lesson 1: Weather Introduction
Lesson 2: Temperature
Weather Unit S4_Lesson2_exercise
Lesson 3: Rainfall
Convectional and Relief Rainfall Sheet
Lesson 4: Air Masses
Lesson 5: Weather Station Symbols
Lesson 6: Clouds
Lesson 7: Pressure Systems
Lesson 8: Drawing Climate Graphs
Precipitation has been recorded in the British Isles for over 200 years. Through the dedication and enthusiasm of W R Symons, the mid-19th century saw the formation of the British Rainfall Organisation whose main objective was to establish a countrywide network of rain gauges where daily measurements were made. This network has grown to over 7,000 gauges today, including many that are automatic.
As most people in the British Isles know, precipitation can be extremely variable, both in intensity and duration. The spatial distribution of precipitation during an individual month is very uneven, just as it is on an individual day. Rainfall in Britain is associated with several distinct synoptic situations; all places may get rain from most such types, but some areas get more from some types than others. Therefore, it is not surprising that patterns of temporal variation of rainfall are complex.
Precipitation over the British Isles is the result of one or more, of three basic mechanisms.
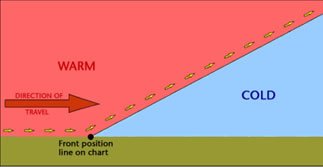
1. Cyclonic, or frontal, rain associated with the passage of low-pressure systems. Bands of rain are associated with the passage of warm and cold fronts across the UK. These rain events are caused by the uplift and cooling of moist air parcels.
2. Convectional, with local showers and thunderstorms, caused by the localised thermal heating and overheating of the ground surface. Large towering cumulonimbus clouds may be generated, producing heavy rain.
3. Orographic, or relief rain, with precipitation increasing with altitude over upland areas. The mechanism for relief rain is the uplift and cooling of moist air over upland areas. The normal rate of cooling (environmental lapse rate) is 6.5 °C per 1,000 metres. Therefore, near the summit on the windward side of the hill or mountain, the air will have cooled sufficiently for thick cloud, rain and possibly snow to fall.
Air will descend and warm on the leeward side, so there is little or no rain on this leeward side of the hill or mountain. This is called a rain shadow, and sometimes there are warm winds in these sheltered areas as the air, now much drier than during its ascent, descends quickly and warms up. This is called a föhn effect, and the warm winds are called föhn winds.
Rain forms when air cools, the rate of condensation becomes faster than the rate at which water is evaporating and cloud droplets form. If these get big enough, they form as rain – or snow, sleet or hail.
There are various ways in which the air can cool to form rain – three common types which are often talked about are frontal, orographic or relief and convective rain. Frontal Rain
This is found where warm air meets cold at the cold and warm fronts in a depression.
Convective Rain
Convection is the term given to warm air rising. Convection is normally marked by cumulus clouds which billow upwards as the air rises. The base of such clouds is usually flat, marking the level where temperatures are cold enough for more condensation to be going on than evaporation.
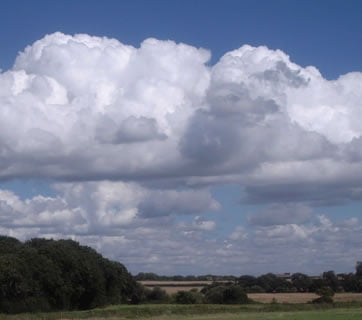
Image copyright RMetS
Extreme convection can be found in thunder clouds – towering cumulonimbus, which can reach all the way up to the top of the troposphere – the lowest 10km or so of the atmosphere in which our weather is found. As air can’t rise into the stratosphere above, the top of the cumulonimbus cloud spreads out, giving it a characteristic ‘anvil’ shaped top. Such convection can occur where the ground has become particularly warm, heating the air above it. It is particularly associated with the Tropics, characteristically giving heavy rain in the late afternoon.
Cumulonimbus clouds can give heavy rain, hail, thunder lightning and sometimes tornadoes.

Cumulonimbus cloud over Kettering, UK, August 2014
Image copyright Sylvia Knight
Orographic or Relief Rain
When air is forced to rise over land, particularly higher ground such as hills and mountains, it cools as the pressure falls. Dry air cools at 9.8°C per 1000m it rises. Eventually, the air can cool enough for cloud to form.
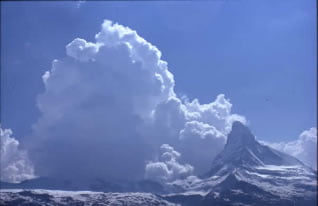
Orographic cloud forming upstream of the Matterhorn
Image copyright RMetS
The cloud droplets may get big enough to fall as rain on the upstream side of the mountain. If that happens, then, when the air has passed over the top of the mountain and starts to descend, and warm, on the far side, there will be less water to evaporate back into the air. The air will end up drier than it was on the upstream side of the mountain.
This can produce ‘rain shadow’ – an area of land downstream from some mountains (for the prevailing wind direction, in the UK, this would be to the east) where there is noticeably less rainfall. The Gobi desert in Mongolia and China is so dry because it is in the rain shadow of the Himalayas.
Orography can enhance frontal or convective rain; for example, we have explored how polar maritime air, our prevailing air mass, brings convective rain to the Atlantic. As the air reaches the UK and rises over the land, the precipitation is increased.
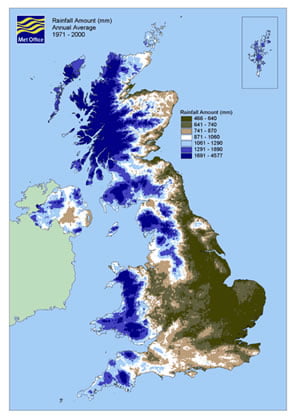
A precipitation map showing the rainfall ‘climate’ (averaged over 30 years) of the UK. With prevailing westerly winds, there is clearly more rain on the western side of the country, enhanced by the mountains of Wales and Scotland and the English Pennines.
As well as being drier on the downwind side of the mountains, it can also be warmer. Remember that water releases heat into the atmosphere as it condenses and takes it up as it evaporates. If there is less water in the air on the downwind side, then there is less to evaporate and not all the heat that was released on the upwind side will be taken up again. This is known as the Föhn Effect.
The onset of a Föhn is generally sudden. For example, the temperature may rise more than 10°C in five minutes and the wind strength increase from almost calm to gale force just as quickly. Föhn winds occur quite often in the Alps (where the name originated) and in the Rockies (where the name chinook is used). They also occur in the Moray Firth and over eastern parts of New Zealand’s South Island. In addition, they occur over eastern Sri Lanka during the south-west monsoon.
Where there are steep snow-covered slopes, a Föhn may cause avalanches from the sudden warming and blustery conditions. In Föhn conditions, the relative humidity may fall to less than 30%, causing vegetation and wooden buildings to dry out. This is a long-standing problem in Switzerland, where so many fires have occurred during Föhn conditions that fire-watching is obligatory when a Föhn is blowing.
Teaching Resources
A case study of orographic rainfall and Foehn winds in Scotland with images for students Image 1, Image 2, Image 3, Image 4, Image 5.
Water in the Atmosphere from Weather and Climate: a Teachers’ Guide
Data and Image Sources
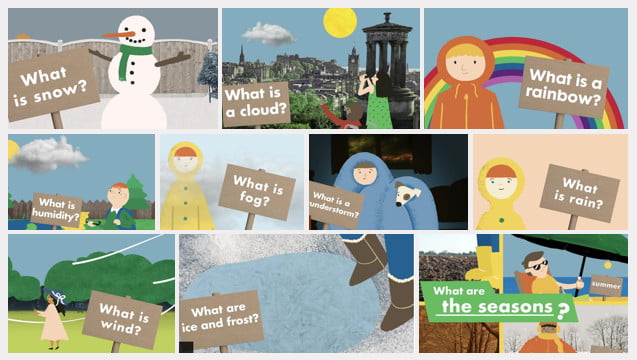
We were delighted to support BBC Bitesize Scotland in the creation of these 21 videos for primary schools. Here are some of our best resources to support the teaching of these topics:
[all images on this page are copyright of the BBC]


This is a teaching resource linked to section 11.1.4 of the sixth assessment IPCC report of 2021, written with the Royal Geographical Society with IBG. The aim is to answer the question: are we experiencing more weather extremes as a result of climate change?
Weather and climate are separate concepts. Weather describes the short-term conditions in the atmosphere, whilst climate refers to its long-term state. Weather measurements might be hourly or daily readings of temperature (°C), rainfall (mm) and wind speed (m/s). Climate is usually defined as the average of 30 years of weather measurements.
There is now evidence that climatic extremes have changed since the mid-twentieth century — and some of these changes have been the result of anthropogenic influence (if you do not understand the term read What is the Anthropocene? or go to the Natural History Museum webpage on why it matters). Generally speaking, extreme weather events have increased in intensity and frequency since pre-industrial time. In particular, global temperature has increased, both by annual average globally and in localised spikes.
The IPCC report says that even with relatively small incremental increases in global warming (as per the SSP1 pathway which holds global warming to 1.5°C) there will be ‘significant changes in extremes’ on the global scale and for large regions. It is:
The local exchanges of heat and the heat from the evaporation and condensation of moisture, called thermodynamic changes, create temperature extremes. Unprecedented temperatures begin with the initial thermodynamic effect (of a warming troposphere) and lead to increased intensity and frequency of hot extremes. Recently, this has been coupled with decreases in the intensity and frequency of cold extremes.

As Greenhouse Gases (GHGs) increase there is an immediate impact on the temperature of the troposphere, stratosphere, and the surface of the Earth – land, sea and ice. The water vapour cycle intensifies as it becomes easier for water vapour to evaporate from the surface of the Earth and vegetation and for water vapour to condense into cloud droplets in a warmer troposphere. As water vapour is itself a greenhouse gas, changes in atmospheric water vapour always amplify the initial temperature increases (a positive feedback) whilst the lapse rate[1] feedback also amplifies near-surface temperature increases (positive feedback) in mid- and high latitude countries, such as the UK. This means extreme weather from the larger cumulonimbus clouds and more severe thunderstorms.
[1] A lapse rate describes the rate at which temperature decreases with increasing altitude.

Figure 1 extreme weather and huge waves crashing into Cornwall at high tide © Greg Martin
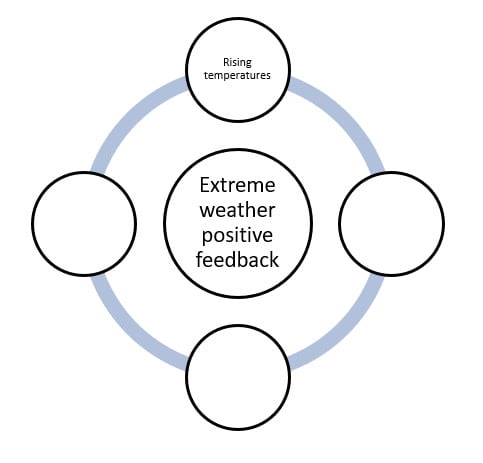
3. Figure 4 in Appendix A is a feedback diagram on the creation of extreme weather for a typical mid-latitude country. Complete the diagram using the explanation:
The greenhouse effect leads to the temperature of the troposphere and the surface of the Earth rising. With more heat available, evaporation and evapotranspiration rates from surface water and vegetation increases. With more water vapour available in a warmer atmosphere, more clouds can form. As the water vapour condenses, latent heat is released which further heats the atmosphere locally and promotes convection, warm air rising, and the further formation of cumulus clouds. (Latent heat is the energy absorbed by or released from a substance during the change from a gas to a liquid or a solid or vice versa). As a consequence, increased cumulonimbus clouds and thunderstorms creates ultimately causing extreme precipitation events.
4. Now add the processes to the blue connecting lines, using the explainers.

Figure 2 extreme weather will increase both around the world, and specifically in the UK © Greg Martin
Extreme Weather
The IPCC report states that, for each additional 1°C, extreme rainfall will intensify by 7%. Currently annual rainfall on land is increasing and monsoons are changing in complex ways.
5. Analyse Figure 5 in Appendix B. Describe the overview for wet extremes and their potential for human contribution. Reference the areas: NWN and NEC, NEU, SEAF, and SAS.
Access the following resources for suggested further work on weather extremes.
Using all the work you have completed answer the final question below. The instruction to assess means you should weigh up several opinions to conclude about their effectiveness or validity.
Use the State of the UK Climate 2020 special issue article (in the Further work list above) to inform your answer.
6. Assess whether UK weather is becoming more extreme in the twenty-first century.

Figure 3 big waves crash over the seafront in Penzance, Cornwall © Greg Martin
Figure 4 a positive feedback loop for extreme weather

Figure 5 what has been observed in wet extremes around the world? © IPCC report

4. All sentences: amplifies temperature increase, stronger convection, more evaporation, and lapse rate feedback amplifies near-surface increases.
5. Overall, the pattern for observed wet extremes around the world is a general increase in the mid and high latitudes, in particular across the US, Europe and Eurasia. There has also been an increase in wet extremes in parts of South America, for example Argentina. The greatest risk region is by far northern Europe (NEU) with a high confidence level that these changes derive from human influence. India (SAS) has also experienced an increase in extreme precipitation with medium confidence from observed trends. Canada (NWN and NEC) and Kenya (SEAF) have a lack of evidence for extreme precipitation.
6. As instructed.
For this investigation you will use the Weather Observations Website which collects weather data from around the world.
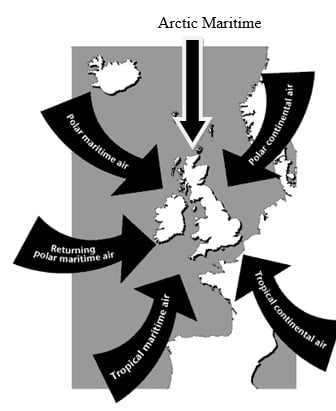
An air mass is a large body of air with relatively uniform characteristics (temperature and humidity) in the horizontal.
The properties of an air mass depend upon:
a) Its source – air originating in tropical regions is warm, whereas air originating in polar regions is cold.
b) Its track – air travelling over the sea is moistened, whereas the moisture in air with a continental track is hardly changed.
Go to the WOW website wow.metoffice.gov.uk.
Case Study 1
Use the calendar to go to 4th February 2013 at 1100-1159.
In the ‘filters’ menu select both ‘WOW observations’ and ‘Official Observations’.
Select ‘present weather’ from the ‘layers’ menu.
What is the weather like?
Select ‘rainfall rate’. Is it raining anywhere? If so, where?
How does the pattern of rainfall change as day turns to night?
Go back to 1100-1159 and select ‘snowfall’. Is it snowing anywhere? If so, where?
Select ‘temperature’. What is the air temperature around the UK? Would you say that was normal, high or low for the time of year?
Now look at the wind direction. Where is the wind coming from?
Which air mass is affecting the UK at this time?
Use the calendar to go to 21st February 2013 at 1100-1159.
Select ‘present weather’ from the ‘layers’ menu. What is the weather like?
Select ‘rainfall rate’. Is it raining anywhere? If so, where?
How does the pattern of rainfall change as day turns to night?
Go back to 1100-1159 and select ‘snowfall’. Is it snowing anywhere? If so, where?
Select ‘temperature’. What is the air temperature around the UK? Would you say that was normal, high or low for the time of year?
Now look at the wind direction. Where is the wind coming from?
Which air mass is affecting the UK at this time?
Use the calendar to go to 4th January 2013 at 1100-1159.
Select ‘present weather’ from the ‘layers’ menu. What is the weather like?
Select ‘rainfall rate’. Is it raining anywhere? If so, where?
How does the pattern of rainfall change as day turns to night?
Go back to 1100-1159 and select ‘snowfall’. Is it snowing anywhere? If so, where?
Select ‘temperature’. What is the air temperature around the UK? Would you say that was normal, high or low for the time of year?
Now look at the wind direction. Where is the wind coming from?
Which air mass is affecting the UK at this time?
Use the calendar to go to 11th August 2012 at 1100-1159.
Select ‘present weather’ from the ‘layers’ menu. What is the weather like?
Select ‘rainfall rate’. Is it raining anywhere? If so, where?
How does the pattern of rainfall change as day turns to night?
Go back to 1100-1159 and select ‘snowfall’. Is it snowing anywhere? If so, where?
Select ‘temperature’. What is the air temperature around the UK? Would you say that was normal, high or low for the time of year?
Now look at the wind direction. Where is the wind coming from?
Which air mass is affecting the UK at this time?
Use the calendar to go to 6th February 2013 at 1100-1159.
Select ‘present weather’ from the ‘layers’ menu. What is the weather like?
Select ‘rainfall rate’. Is it raining anywhere? If so, where?
How does the pattern of rainfall change as day turns to night?
Go back to 1100-1159 and select ‘snowfall’. Is it snowing anywhere? If so, where?
Select ‘temperature’. What is the air temperature around the UK? Would you say that was normal, high or low for the time of year?
Now look at the wind direction. Where is the wind coming from?
Which air mass is affecting the UK at this time?
Resource contributed by Geoff Jenkins
Introduction
A cold front is one of the features of mid-latitude weather systems that we often see in the UK. As the name suggests, it brings in colder, drier, air to replace warmer, moister, air. Ahead of it is usually a band of rain, which
stops, and the skies clear, as the surface cold front goes past us – known as a “cold front clearance”.
There are typically 100 or so cold fronts passing over the UK every year – more in winter than in summer. They are not evenly spaced – there may be a week or two where fronts pass nearly every day, followed by a week or two of high pressure when there are no fronts at all.
Cold fronts are easier to identify and track than warm fronts.

A cold front sweeping down across the UK
Because it usually has a clear signal – a sharp drop in temperature – we can spot a cold front easily on the temperature graph on WOW from your weather station – see the example below (although they are not always as sharp or as big a drop as this one). If we can also pick up the same frontal passage at other weather stations at different times, we can use this to calculate the speed of the front. This is what we aim to do in this investigation.
To calculate the speed of a cold front using weather station data from across the UK.

1. Notice when a cold front has passed you – this is often marked by a period of heavy rain suddenly stopping, skies clearing and a drop in temperature by a few degrees, called a “cold- front clearance”. Check the WOW http://wow.metoffice.gov.uk graph for your station and you may well see a sudden temperature drop as in the graph above. Finally, check the weather map at https://www.metoffice.gov.uk/weather/maps-and-charts/surface-pressure which should show a cold front as a blue line with blue triangles showing the direction of travel (or the archive at http://www.wetterzentrale.de/topkarten/tkfaxbraar.htm in black-and-white)

2. Look at the radar rainfall map for the day, to see if it is a well-defined front and clearance, similar to the one shown below. Rainfall maps over the past few hours can be seen at www.raintoday.co.uk or the archive over last 10 days is at https://www.theweatheroutlook.com/twodata/uk-rainfall-radar.aspx.

3. If the temperature drop at your station is sharp and more than about 2-3 degrees, then it is likely that graphs from other WOW stations will probably show the same sort of feature. Copy the WOW temperature graph for your station (left click, copy) and paste it onto a new PowerPoint slide. This will give you a graph similar to the one above.
4. Make an assumption that the front has moved roughly at right angles to its length (usually, but not always, true), so imagine a line through your station at right angles to the front
5. Look for another WOW station 100 – 200km away (towards the west rather than east, as fronts normally come from the northwest, west or southwest) along this line, and click on it to look at its data for the same period. In this example, we have chosen the WOW station of Spittal in Pembrokeshire.

6. If you find it also shows a clear temperature drop, compare the two sites by drawing a graph for one, as above, then adding the other site name in the ‘Search for a Site’ box.

7. Estimate the time that the cold front passed at each of the stations, marked by the start of the temperature drop. You may need to use the ‘table’ option to get a more precise time. Estimate the distance between the stations using google maps and use this to estimate the speed the front is moving at.
8. If you can, choose another station even further away and repeat the exercise. Below, we have included Waterford, in southwest Ireland, when the front cleared at 11:19h

The same cold front clearance passing Waterford and Wells
9. Plot a graph (using Excel, or just graph paper) with the time of the start of the temperature drop as the x-axis and the distance from your station as the y-axis. If you are using Excel, click on the Chart Layout that puts a line of best fit through the points, click on the line and tick the box saying Display Equation on Chart – the speed of the front is the gradient in the equation, so in the example below it is almost 58kph. If using graph paper, draw a line of best fit just by eye, and measure its gradient with a ruler.

© 2024 Royal Meteorological Society
RMetS is a registered charity No. 208222
By clicking any link on this page you are giving your consent for us to set cookies. More info
Strictly Necessary Cookie should be enabled at all times so that we can save your preferences for cookie settings.
If you disable this cookie, we will not be able to save your preferences. This means that every time you visit this website you will need to enable or disable cookies again.


