


Cambridge temperature data worksheet
2022 heatwave – consequences for people and place worksheet
Heat waves and climate change worksheet
Knowledge Organiser: 2022 Heatwave in Cambridge Case Study
Some ideas, data sources and guidance for students wishing to include weather measurements in their NEA, EPQ or Geographical Study (Advanced Higher).
Updated November 2022
https://www.rgs.org/CMSPages/GetFile.aspx?nodeguid=59f46632-ae51-4ea7-ab94-a0c537eb3c71&lang=en-GB
https://www.metlink.org/wp-content/uploads/2020/12/depression_wow_teacher_Eva.pdf
Data source:
Data source: http://wow.metoffice.gov.uk
Using Wow data to look at urban heat islands https://www.metlink.org/resource/using-wow-to-illustrate-the-urban-heat-island-effect/
Urban winds: fieldwork guidance can be found on https://www.metlink.org/fieldwork-resource/fieldwork-in-geography/
Urban temperature https://www.metlink.org/fieldwork-resource/urban-heat-island-introduction/
Data source: http://wow.metoffice.gov.uk
https://www.metlink.org/fieldwork-resource/using-usb-temperature-dataloggers/
https://www.rgs.org/schools/teaching-resources/quick-and-easy-ideas/
Data source: http://wow.metoffice.gov.uk
https://www.manchester.ac.uk/discover/news/tuesday-wettest-day-of-week-suggests-new-analysis/
https://rmets.onlinelibrary.wiley.com/doi/10.1002/joc.2321
Orographic rainfall https://www.metlink.org/resource/orographic-relief-rainfall-and-the-foehn-effect/
https://www.metlink.org/resource/red-sky-teachers/ with an introductory concept cartoon from the ASE
https://www.metlink.org/blog/folklore/weather-folklore/
https://www.metlink.org/blog/extreme-weather/when-will-it-snow/
https://www.exploringoverland.com/constantapprentice/2021/8/10/making-a-cyanometer-to-measure-sky-moisture-through-color with https://uk-air.defra.gov.uk/interactive-map pollution forecast and pollen forecast http://www.metoffice.gov.uk/health/public/pollen-forecast
Data source: National River Flow Archive http://nrfa.ceh.ac.uk/ and https://environment.data.gov.uk/hydrology/index.html#/landing
http://www.coolgeography.co.uk/GCSE/AQA/Coastal%20Zone/Sea%20level%20rise/Sea%20level%20rise.htm
Data source: http://wow.metoffice.gov.uk
https://earth.nullschool.net/
http://www1.wetter3.de/Archiv/archiv_ukmet.html
various links on https://www.metlink.org/teaching-resources/?_sft_topic=air-masses
including https://www.metlink.org/resource/pressure-and-rainfall/
Data source: http://wow.metoffice.gov.uk
https://www.metlink.org/fieldwork-resource/instruments-and-fieldwork/
https://www.rgs.org/schools/teaching-resources/key-stage-five/extreme-weather/
https://www.metlink.org/fieldwork/
https://www.rgs.org/schools/teaching-resources/a-student-guide-to-the-a-level-independent-investi/
https://www.field-studies-council.org/resources/16-18-geography/route-to-enquiry/

Learning objectives: to apply the equations
energy for a change of state = mass × specific latent heat
energy transferred = power × time
to a real world situation.
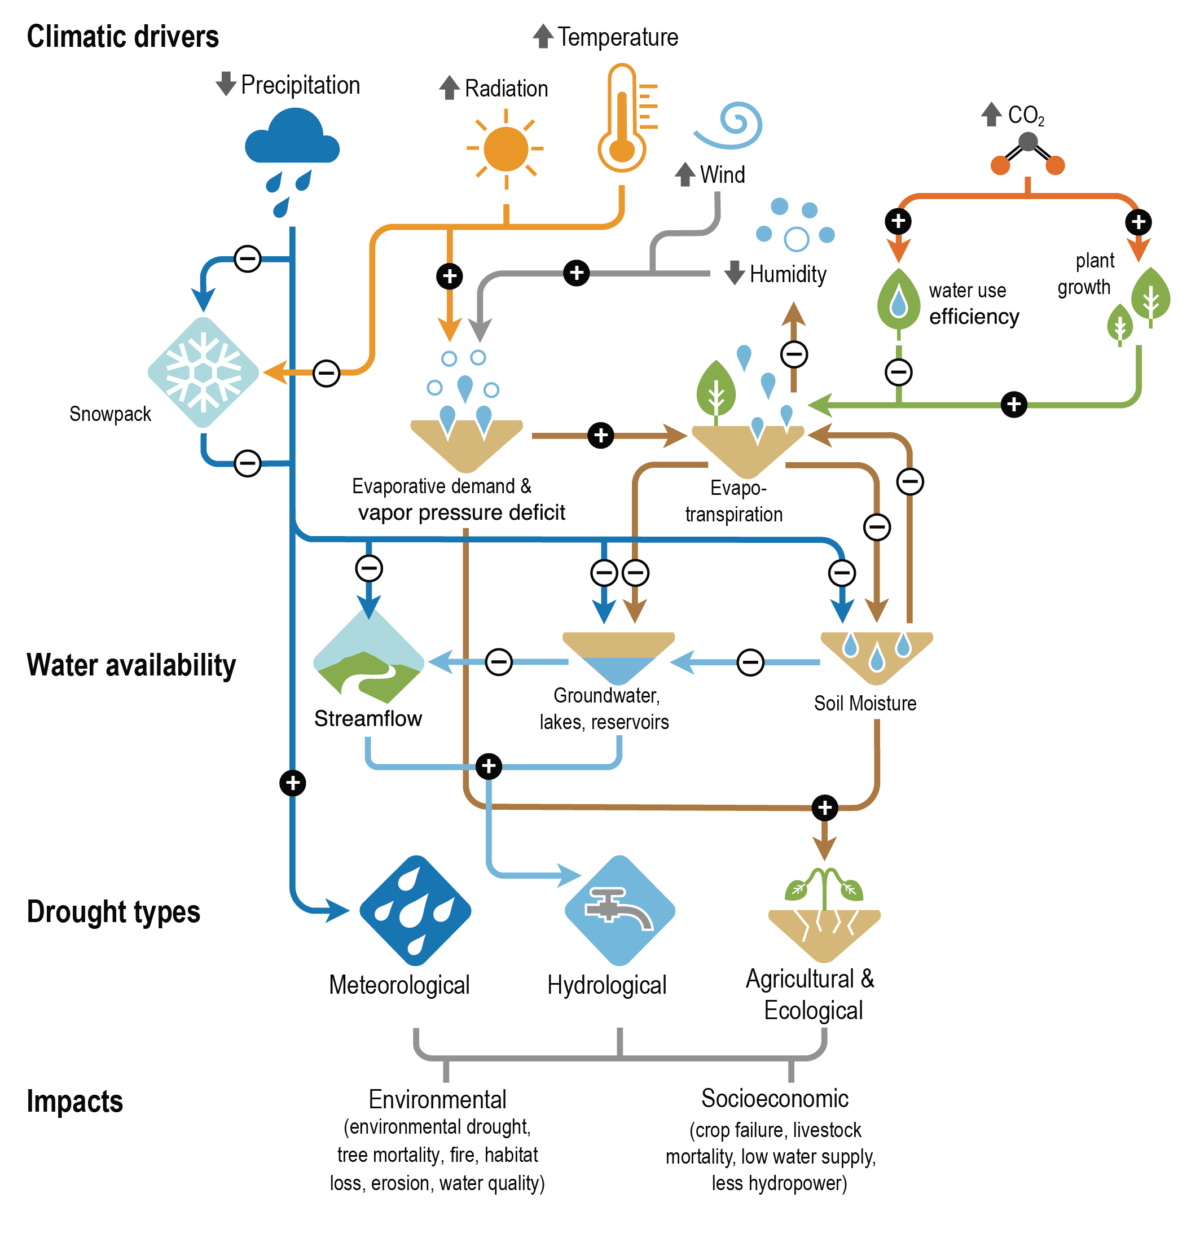
When water evaporates from the leaves of trees, is it called evapotranspiration. The latent heat required for this comes from the thermal store of energy in the surroundings. This question compares the cooling power of evapotranspiration from an oak tree to air conditioning.
energy for a change of state = mass × specific latent heat
400 kg * 2700 kJ/kg
power = energy transferred / time
time = 24*3600
power = 10 kW
10 kW / 2.5 kW = 4 units
Aim: Students should be able to describe the effects of reflection, transmission and absorption of waves at material interfaces.
This activity would work well as a think/ pair/ share activity, and could also be displayed as a poster or other presentation.
The chlorophyll in green leaves of a tree absorbs the red and blue light in the visible Electromagnetic radiation from the Sun. The green light is reflected.
A green umbrella would do the same.
Both cast a shadow on the ground, implying that less visible light reaches the ground.
The ground also reflects some of the sunlight and absorbs the rest.
Absorbed sunlight increases the thermal store of energy.
The greater the thermal energy stored in an object, the more infrared radiation, heat, it emits.
Would you feel cooler walking along a road that is shaded by trees than you would if you carried a green umbrella?
Both the umbrella and the trees will reduce the amount of sunlight reaching you and warming you up.
They will also reduce the amount of sunlight reaching the ground. However, the trees are permanent and will have been shading the ground all day, so the ground in the shadow of the trees will be cooler than the ground in the shadow of a moving umbrella.
The heat, infrared radiation, reaching you from the ground will be lower in the shadow of the trees.
Extended ideas
These could include:
C.2.6 Cities intensify human-induced warming locally, and further urbanization together with more frequent hot extremes will increase the severity of heatwaves. Urbanization also increases mean and heavy precipitation over and/or downwind of cities and resulting runoff intensity.1
The table below shows the efficiency of various factors at warming up or cooling down neighbourhoods of 3 urban areas. Overall, cities tend to be warmer than their surroundings. This is called the ‘urban heat island’ effect. Cities and urban areas tend to be warmer due to extra warming caused by human activities such as industrial processes, but also because urban surfaces tend to be darker coloured and drier than rural surfaces.

Recall that a positive figure represents a temperature rise and a negative figure represents a temperature decrease.


Image source: Google maps
According to the IPCC in the future:
Using these statements, what are the two factors that will cause temperatures to rise in urban areas?
Imagine that you could redesign the city to limit the effects of climate change. Make a list of all of the things that you could do to reduce the impact of climate change on your chosen city. Next, consider the strengths and weaknesses of all of those options. You might want to consider using a table like the one below;

Using the urban areas fact sheet

Source: IPCC, 20212
Using the map above, identify;

Source: IPCC, 2021 2
Using the graph from Japan answer the following questions;
According to the IPCC:
One study examining the 2003 heat wave in Europe that killed upward of 70,000 people found that night-time temperatures were a key indicator of the health risk from high temperatures. There’s also research that shows high night-time temperatures disrupt sleep. Without relief from the heat, the stresses on the body mount.
While it may cool off after the sun sets during a heat wave, it may not cool off enough for people who have been exposed to high temperatures all day. That leads to a higher cumulative exposure to heat.
Extreme heat is one of the deadliest weather phenomena in the world. There are direct health effects like heat stroke, (when body temperature rises above 40C, leading to organ failure) and heat exhaustion.
Prolonged periods of high temperatures cause cardiac and respiratory disease leading to excess deaths, particularly in older people.
Simplify the information above into the flow chart below:

Explain why the fact that urbanisation has increased night time extremes of temperature could pose health problems for people who live in cities.
Sources

The Urban Heat Island (UHI) effect makes the centres of towns and cities warmer than the surrounding countryside, especially at night. This is mainly because all the brick, concrete and paving in a city warms up during the day, and then retains its heat for several hours, so helping to keep the city warm as night comes.
The graph below shows temperature over a couple of days in September in the middle of Reading (dark blue) and in a rural village (light blue) about 6km north of Reading. For this period, the skies were clear and the wind was light, allowing the temperature at Sonning Common to fall quickly after sunset.
However, the Reading city centre temperature fell less rapidly, because of the UHI effect, so that it remained 3 or 4 degrees warmer than Sonning Common during most of the night.

On the other hand, the UHI effect is smaller when nights are cloudy and when it is windy. The graph below shows a comparison of temperature the same two places for a couple of very cloudy, rainy, days in October. Because clouds stop heat escaping from the ground, the temperature doesn’t fall much after sunset, and there is only a degree or so difference between the rural village and the city centre.

You can easily make the same sort of comparisons, and shown the UHI effect, using WOW.
The Met Office WOW website http://wow.metoffice.gov.uk is the result of a collaboration between the Met Office and the Royal Meteorological Society, and is a platform for weather observers around the world to upload and share their data.
Aim
The advantage of using archived data from a site such as WOW is that a date can be selected when weather conditions were appropriate for urban heat island formation, and local data can be found.
Differentiation
Depending on ability, students could be given help choosing locations and/ or dates for the study. More able students could use several sites in and around an urban area.
Urban Heat Island Introduction
Supporting PowerPoint presentations can be found here and here.
and from MetMatters Urban Heat Islands
Required
Students will require access to the internet.
Choosing locations
Students should select two locations, one in an inner city area and one in a rural area just outside the city.
They might like to make sure that the sites they choose are submitting high quality data (for example, use the ‘filter’ drop down menu to select ‘official observations’ have the best data).
Students could use the satellite view on Google Earth to check the land use of the place where the weather is being recorded.
Advanced students might like to use an OS map to check whether there is a substantial height difference between the sites, and should consider whether this will have an effect on the temperatures recorded.
Choosing a Date and time
The Urban Heat Island is biggest:


Plenary
Use the second PowerPoint presentation above.
Ask students to line up across room as a continuum. Students should stand at the left if they think their experiment does provide evidence for an urban heat island, and the right if they think it does not, or somewhere in between.
Find out about how to borrow weather instruments in order to be able to carry out a microclimate investigation with your school here, or more about urban heat islands here.
What are microclimates?
What are the different types of microclimates?
What is an urban microclimate?
Urban precipitation
Smog
Urban winds
 A microclimate is the distinctive climate of a small-scale area, such as a garden, park, valley or part of a city. The weather variables in a microclimate, such as temperature, rainfall, wind or humidity, may be subtly different from the conditions prevailing over the area as a whole and from those that might be reasonably expected under certain types of pressure or cloud cover. Indeed, it is the amalgam of many, slightly different local microclimates that actually makes up the microclimate for a town, city or wood.
It is these subtle differences and exceptions to the rule that make microclimates so fascinating to study, and these notes help to identify and explain the key differences which can be noticed by ground-level observations.
In truth, there is a distinctive microclimate for every type of environment on the Earth’s surface, and as far as the UK is concerned they include the following:
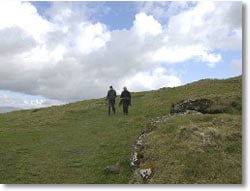 Upland areas have a specific type of climate that is notably different from the surrounding lower levels. Temperature usually falls with height at a rate of between 5 and 10 °C per 1000 m, depending on the humidity of the air. This means that even quite modest upland regions, such as The Cotswolds, can be significantly colder on average than somewhere like the nearby Severn Valley in Gloucestershire.
Occasionally, a temperature inversion can make it warmer above, but such conditions rarely last for long. With higher hills and mountains, the average temperatures can be so much lower that winters are longer and summers much shorter. Higher ground also tends to be windier, which makes for harsher winter weather. The effect of this is that plants and animals are often different from those at low levels.
Hills often cause cloud to form over them by forcing air to rise, either when winds have to go over them or they become heated by the sun. When winds blow against a hill-side and the air is moist, the base of the cloud that forms may be low enough to cover the summit. As the air descends on the other (lee) side, it dries and warms, sometimes enough to create a föhn effect. Consequently, the leeward side of hills and mountain ranges is much drier than the windward side. The clouds that form due to the sun’s heating sometimes grow large enough to produce showers, or even thunderstorms. This rising air can also create an anabatic wind on the sunny side of the hill. Sunshine-facing slopes (south-facing in the Northern Hemisphere, north-facing in the Southern Hemisphere) are warmer than the opposite slopes.
Apart from temperature inversions, another occasion when hills can be warmer than valleys is during clear nights with little wind, particularly in winter. As air cools, it begins to flow downhill and gathers on the valley floor or in pockets where there are dips in the ground. This can sometimes lead to fog and/or frost forming lower down. The flow of cold air can also create what is known as a katabatic wind.

The coastal climate is influenced by both the land and sea between which the coast forms a boundary. The thermal properties of water are such that the sea maintains a relatively constant day to day temperature compared with the land. The sea also takes a long time to heat up during the summer months and, conversely, a long time to cool down during the winter. In the tropics, sea temperatures change little and the coastal climate depends on the effects caused by the daytime heating and night-time cooling of the land. This involves the development of a breeze from off the sea (sea breeze) from late morning and from off the land (land breeze) during the night. The tropical climate is dominated by convective showers and thunderstorms that continue to form over the sea but only develop over land during the day. As a consequence, showers are less likely to fall on coasts than either the sea or the land.
Around the Poles, sea temperatures remain low due to the presence of ice, and the position of the coast itself can change as ice thaws and the sea re-freezes. One characteristic feature is the development of powerful katabatic winds that can sweep down off the ice caps and out to sea.
In temperate latitudes, the coastal climate owes more to the influence of the sea than of the land and coasts are usually milder than inland during the winter and cooler in the summer. However, short-term variations in temperature and weather can be considerable. The temperature near a windward shore is similar to that over the sea whereas near a leeward shore, it varies much more. During autumn and winter, a windward shore is prone to showers while during spring and summer, showers tend to develop inland. On the other hand, a sea fog can be brought ashore and may persist for some time, while daytime heating causes fog to clear inland. A lee shore is almost always drier, since it is often not affected by showers or sea mist and even frontal rain can be significantly reduced. When there is little wind during the summer, land and sea breezes predominate, keeping showers away from the coast but maintaining any mist or fog from off the sea.
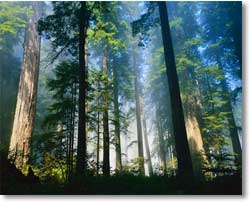 Tropical rainforests cover only about 6% of the earth’s land surface, but it is believed they have a significant effect on the transfer of water vapour to the atmosphere. This is due to a process known as evapotranspiration from the leaves of the forest trees. Woodland areas in more temperate latitudes can be cooler and less windy than surrounding grassland areas, with the trees acting as a windbreak and the incoming solar radiation being ‘filtered’ by the leaves and branches. However, these differences vary depending on the season, i.e. whether the trees are in leaf, and the type of vegetation, i.e. deciduous or evergreen. Certain types of tree are particularly suitable for use as windbreaks and are planted as barriers around fields or houses.
These are perhaps the most complex of all microclimates. With over 75% of the British population being classed as urban, it is no surprise that they are also the most heavily studied by students of geography and meteorology. Therefore, the rest of these notes focus on the various elements that constitute an urban microclimate.
The table below summarises some of the differences in various weather elements in urban areas compared with rural locations.
| Sunshine duration | 5 to 15% less |
| Annual mean temperature | 0.5-1.0 °C higher |
| Winter maximum temperatures | 1 to 2 °C higher |
| Occurrence of frosts | 2 to 3 weeks fewer |
| Relative humidity in winter | 2% lower |
| Relative humidity in summer | 8 to 10% lower |
| Total precipitation | 5 to 10% more |
| Number of rain days | 10% more |
| Number of days with snow | 14% fewer |
| Cloud cover | 5 to 10% more |
| Occurrence of fog in winter | 100% more |
| Amount of condensation nuclei | 10 times more |
 Marked differences in air temperature are some of the most important contrasts between urban and rural areas shown in the table above. For instance, Chandler (1965) found that, under clear skies and light winds, temperatures in central London during the spring reached a minimum of 11 °C, whereas in the suburbs they dropped to 5 °C.
Indeed, the term urban heat island is used to describe the dome of warm air that frequently builds up over towns and cities.
The formation of a heat island is the result of the interaction of the following factors:

The precise nature of the heat island varies from urban area to urban area, and it depends on the presence of large areas of open space, rivers, the distribution of industries and the density and height of buildings. In general, the temperatures are highest in the central areas and gradually decline towards the suburbs. In some cities, a temperature cliff occurs on the edge of town. This can be clearly seen on the heat profile below for Chester.
As noted previously, the greater presence of condensation nuclei over urban areas can lead to cities being wetter and having more rain days than surrounding rural areas. Indeed, it was often said that Rochdale, the famous mill town, had significantly smaller amounts of rain on Sundays when the town’s factories were closed.
However, other factors play a major role, especially the heat islands. These can enhance convectional uplift, and the strong thermals that are generated during the summer months may serve to generate or intensify thunderstorms over or downwind of urban areas. Storms cells passing over cities can be ‘refuelled’ by contact with the warm surfaces and the addition of hygroscopic particles. Both can lead to enhanced rainfall, but this usually occurs downwind of the urban area.
Smogs were common in many British cities in the late 19th and early 20th centuries, when domestic fires, industrial furnaces and steam trains were all emitting smoke and other hygroscopic pollutants by burning fossil fuels. The smogs were particularly bad during the winter months and when temperature inversions built up under high pressure, causing the pollutants to become trapped in the lower atmosphere and for water vapour to condense around these particles.
One of the worst of these ‘pea-soup fogs’ was the London smog of the winter of 1952/53. Approximately 4,000 people died during the smog itself, but it is estimated that 12,000 people may have died due to its effects. As a result, the Clean Air Act of 1956 was introduced to reduce these emissions into the lower atmosphere. Taller chimney stacks and the banning of heavy industry from urban areas were just two of the measures introduced and, consequently, fewer smogs were recorded in the UK during the 1960s and 1970s.
Research in the 1990s has shown, however, that another type of smog – photochemical – is now occurring in some urban areas as a result of fumes from car exhausts and the build up of other pollutants in the lower atmosphere which react with incoming solar radiation. The presence of a brown-coloured haze over urban areas is an indication of photochemical smog, and among its side effects are people experiencing breathing difficulties and asthma attacks.
Tall buildings can significantly disturb airflows over urban areas, and even a building 100 metres or so high can deflect and slow down the faster upper-atmosphere winds. The net result is that urban areas, in general, are less windy than surrounding rural areas.
However, the ‘office quarter’ of larger conurbations can be windier, with quite marked gusts. This is the result of the increased surface roughness that the urban skyline creates, leading to strong vortices and eddies. In some cases, these faster, turbulent winds are funnelled in between buildings, producing a venturi effect, swirling up litter and making walking along the pavements quite difficult.
Web page reproduced with the kind permission of the Met Office

Pathway: Extending Weather
Anticyclones – Depressions – Microclimates – Urban Climates
Lesson overview: In this lesson we look at how urban areas have an impact on temperature, wind, air quality and precipitation.
Even a single building can have an impact on its surrounding microclimate. The larger the built-up area, the greater its potential influence on the microclimate of it and its surrounding area. The physical properties of urban areas – their structure, the materials they are made from and the relative lack of vegetation create a localised climate with unique characteristics. Urban areas can influence temperature, wind speed and direction, air quality, precipitation and humidity. As the climate changes, urban microclimates can be managed to keep towns and cities as cool as possible and to improve air quality. Temperature differences between urban and rural areas are greatest during the night and when there is little wind.
Learning objectives:
To understand how urban areas affect temperature, wind and precipitation levels.
To be able to explain why urban areas affect temperature, wind and precipitation levels.
To create a plan to combat urban climate effects.
Key Teaching Resources
Urban Climates PowerPoint
Urban Climates PowerPoint (easier)
Urban Climates PowerPoint (with harder isoline exercise)
Urban Climates worksheet
Urban Climates worksheet (easier)
Urban Climates worksheet (harder)
Teacher CPD/ Extended Reading
Read Urban Climates_More for Teachers
or watch
Alternative or Extension Resources
Assessment resource and mark scheme (covering several topics)
More Urban Heat Island information and teaching resources, and fieldwork resources for measuring UHIs.
Data skills resource looking at the impact of climate change on urban areas (advanced)
