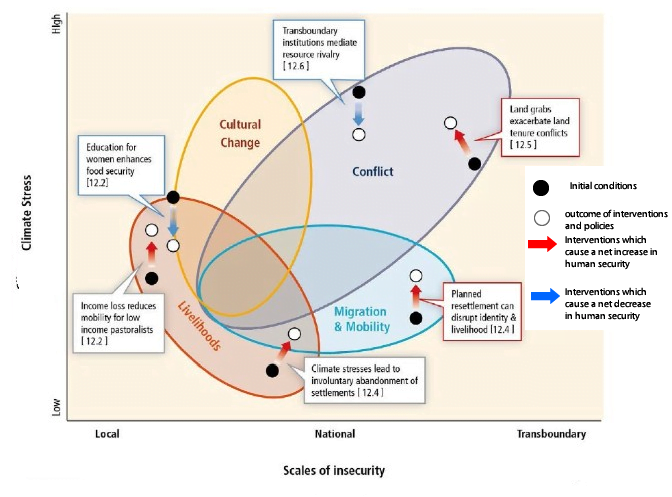
Human security will be progressively threatened as the climate changes. Human insecurity almost never has single causes, however climate change is an important factor through;
a) increasing migration that people would rather have avoided,
b) undermining livelihoods,
c) challenging the ability of states to provide the conditions necessary for human security,
d) compromising cultural values that are important for community and individual wellbeing.
Migration and mobility are ways people adapt to climate variability in all regions of the world. In the past, major extreme weather events have led to significant population displacement, and changes in the incidence of extreme events will amplify the challenges and risks of such displacement. However, many vulnerable groups, particularly in rural and urban areas in low and middle-income countries, do not have the resources to be able to migrate to avoid the impacts of floods, storms and droughts. Migration may be undesirable, and can lead to changes in important cultural expressions and practices, and, in the absence of institutions to manage the settlement and integration of migrants in destination areas, can increase the risk of poverty, discrimination, violent conflict and inadequate provision of public services, public health and education.
Future challenges of climate change:
A) Physical impacts: Sea level rise, extreme events and hydrological disruptions, pose major challenges to vital transport, water, and energy infrastructure and can weaken states socially and economically.
B) Territorial impacts: For example those highly vulnerable to sea level rise.
C) Transboundary impacts: Changes in sea ice, shared water resources, and the migration of fish stocks, have the potential to increase rivalry among states.
D) Violent conflict can in turn undermine livelihoods, impel migration and weaken valued cultural expressions and practices.
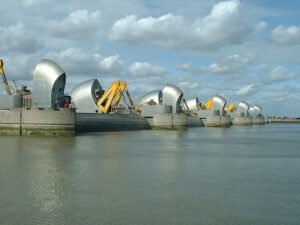
E) Adaptation and mitigation strategies, such as those which develop large infrastructure or the resettle communities against their will to reduce exposure to climate change, carry risks of disrupted livelihoods, displaced populations, deterioration of valued cultural expressions and practices, and in some cases violent conflict.
In summary, climate change is one of many risks to the vital core of material well-being and culturally specific elements of human security that varies depending on location and circumstance.
On the basis of current evidence about the observed impacts of climate change on environmental conditions, climate change will be an increasingly important cause of human insecurity globally in the future. The greater the impact of climate change, the harder it is to adapt.
IPCC links
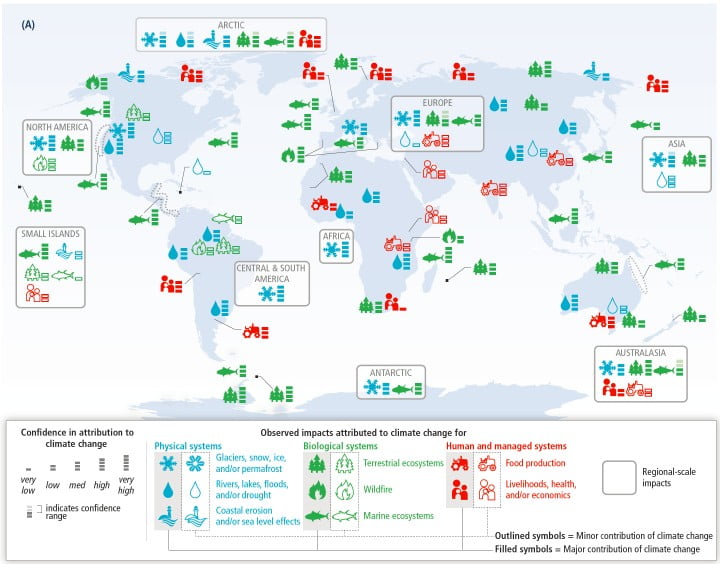
This is Figure 12.3 from the WGII report for the 2014 IPCC 5AR.
WGII FAQ 12.1: What are the principal threats to human security from climate change?
WGII FAQ 12.3: How many people could be displaced as a result of climate change?
WGII FAQ12.4: What role does migration play in adaptation to climate change, particularly in vulnerable regions?
WGII FAQ 12.5: Will climate change cause war between countries?
GLOSSARY
Aerosols A suspension of airborne solid or liquid particles, with a typical size between a few nanometres and 10 μm that reside in the atmosphere for at least several hours.
Anthropogenic Resulting from or produced by human activities.
Atlantic Meridional Overturning Circulation A major current in the Atlantic Ocean, characterized by a northward flow of warm, salty water in the upper layers of the Atlantic, and a southward flow of colder water in the deep Atlantic. It includes the North Atlantic Drift and the Gulf Stream.
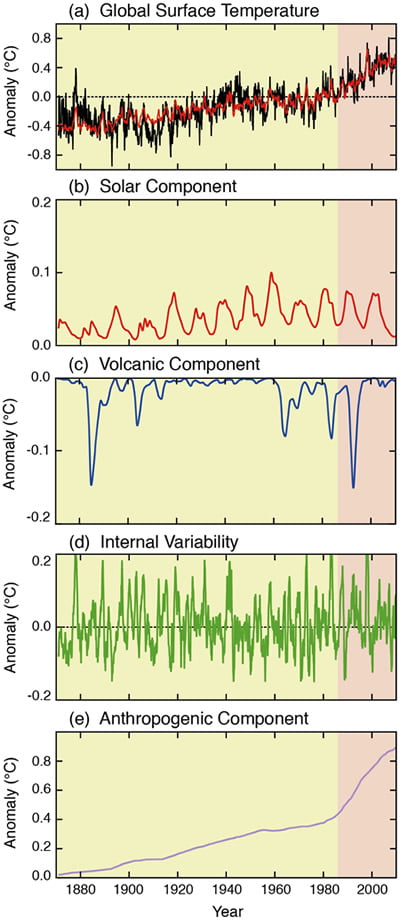
Attribution The process of evaluating the relative contributions of multiple causal factors to a change or event with an assignment of statistical confidence
Climate The average weather, or more rigorously, the statistical description in terms of the mean and variability of relevant quantities over a period of time ranging from months to thousands or millions of years. The classical period for averaging these variables is 30 years, as defined by the World Meteorological Organization. The relevant quantities are most often surface variables such as temperature, precipitation and wind.
Climate Change A change in the state of the climate that can be identified (e.g. by using statistical tests) by changes in the mean and/or the variability of its properties, and that persists for an extended period, typically decades or longer. Climate change may be due to natural internal processes or external forcings such as modulations of the solar cycles, volcanic eruptions, and persistent anthropogenic changes in the composition of the atmosphere or in land use.
Climate Model A numerical representation of the climate system based on the physical, chemical and biological properties of its components, their interactions and feedback processes, and accounting for some of its known properties. Climate models are applied as a research tool to study and simulate the climate, and for operational purposes, including monthly, seasonal and interannual climate predictions.
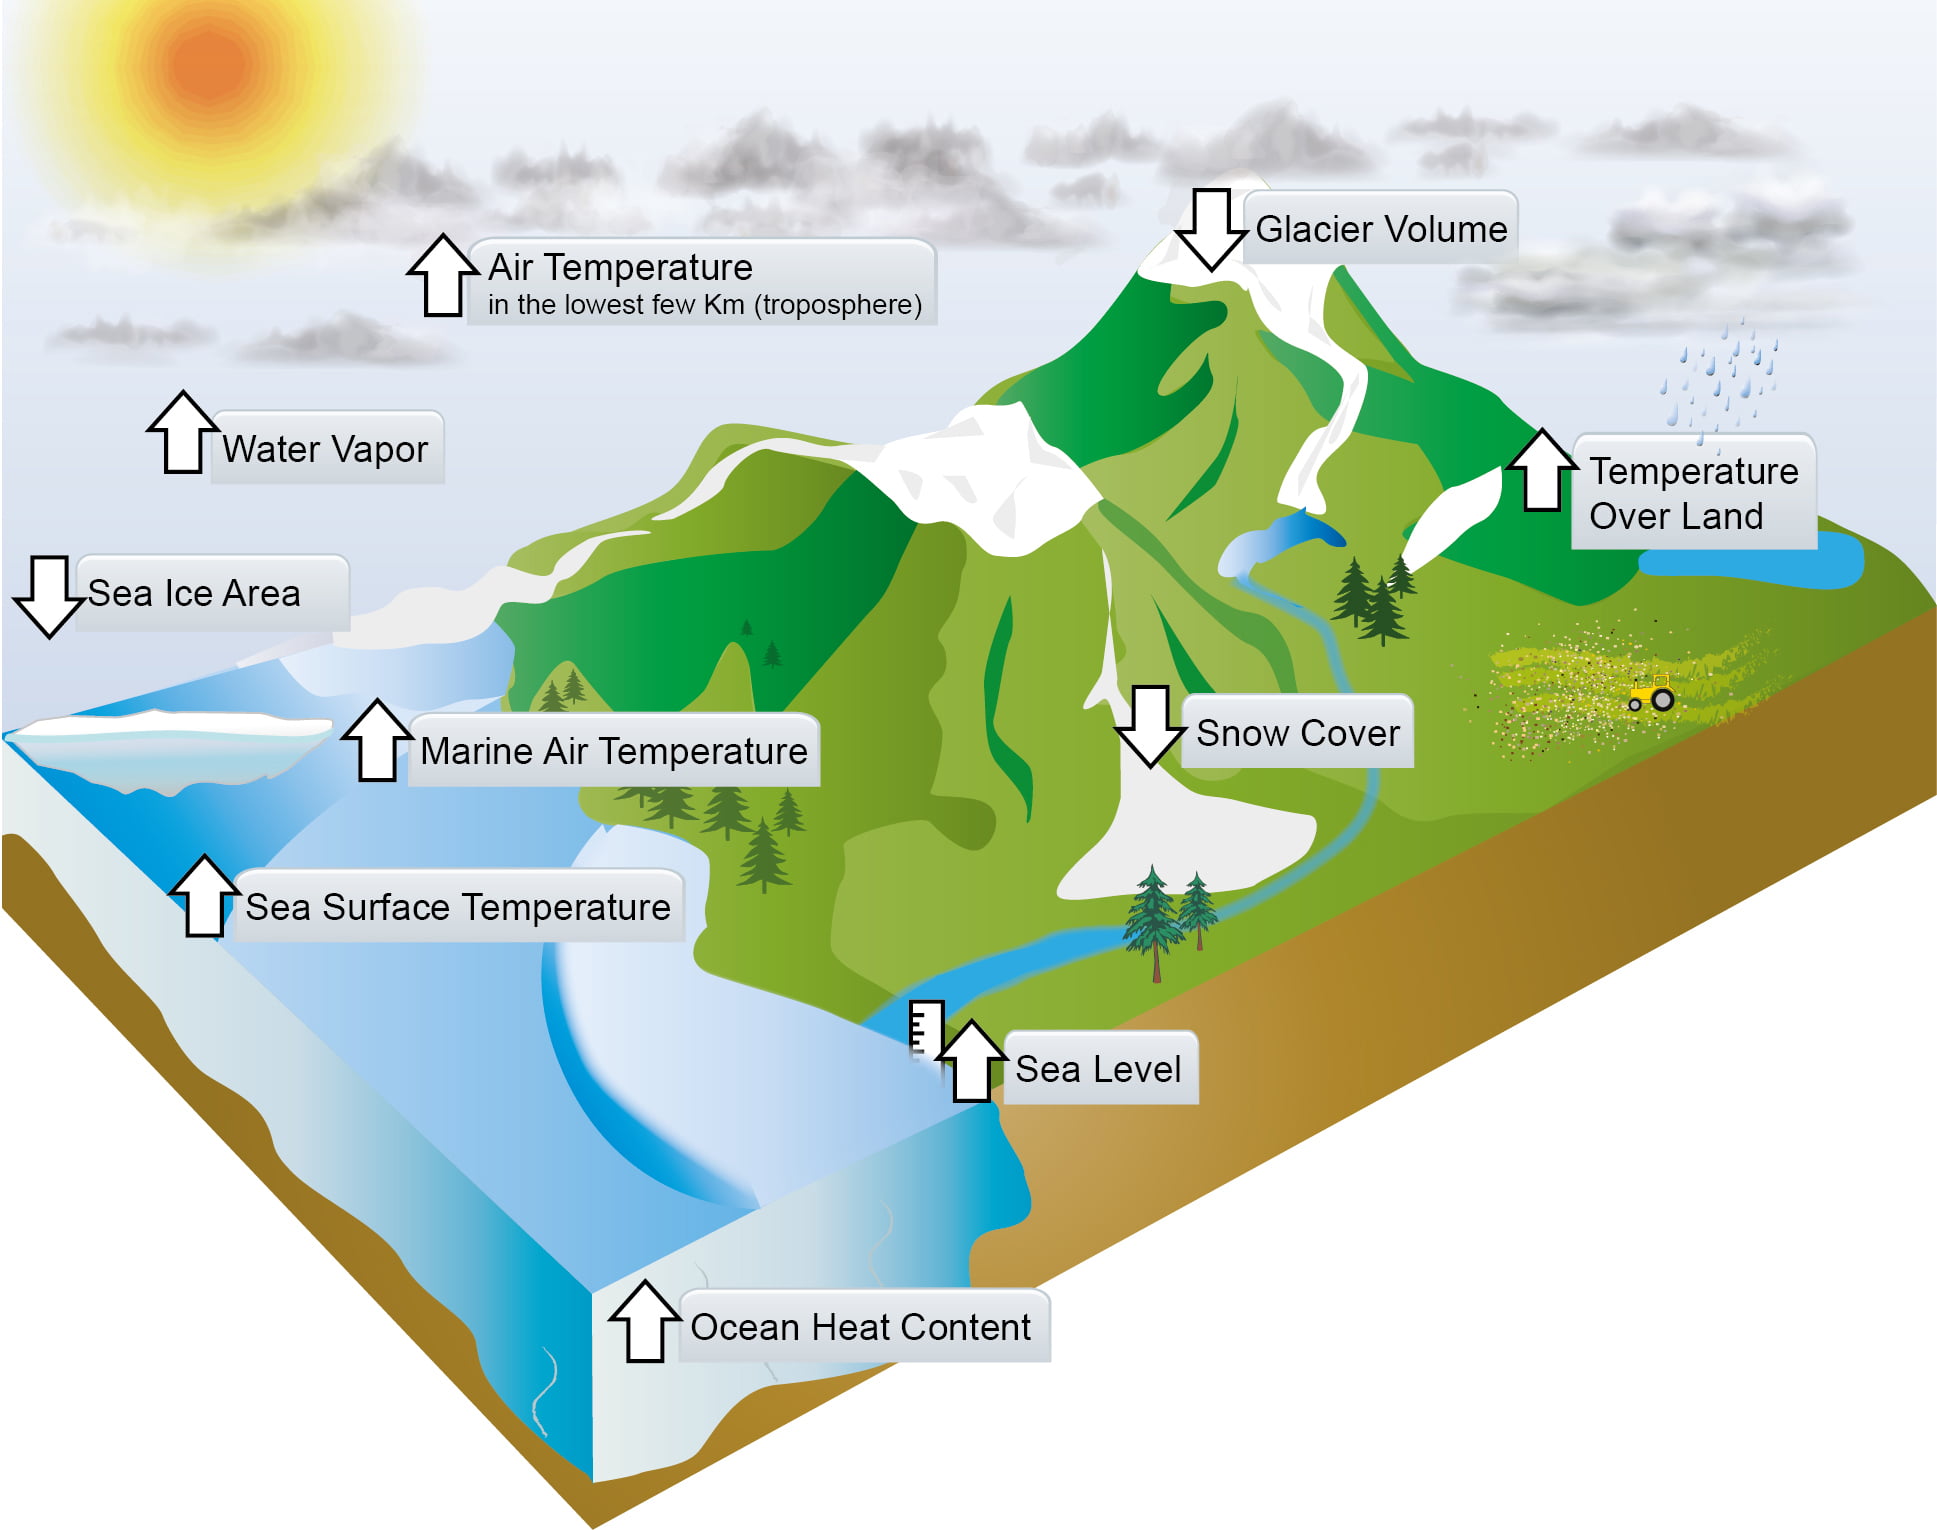
Cryosphere All regions on and beneath the surface of the Earth and ocean where water is in solid form, including sea ice, lake ice, river ice, snow cover, glaciers and ice sheets, and frozen ground (which includes permafrost).
Drought A period of abnormally dry weather long enough to cause a serious hydrological imbalance. Drought is a relative term; therefore any discussion in terms of precipitation deficit must refer to the particular precipitation-related activity that is under discussion.
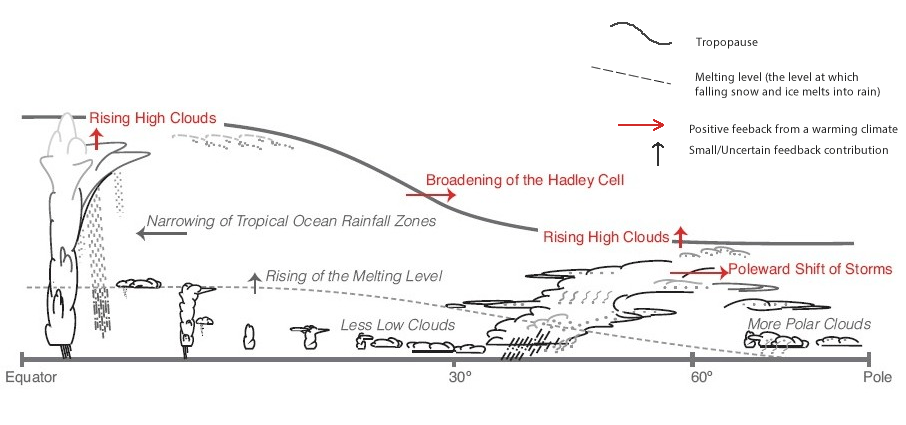
Feedback An interaction in which a perturbation in one climate quantity causes a change in a second, and the change in the second quantity ultimately leads to an additional change in the first. A negative feedback is one in which the initial perturbation is weakened by the changes it causes; a positive feedback is one in which the initial perturbation is enhanced.
Forcings Forcing represents any external factor that influences global climate by heating or cooling the planet. Examples of forcings are volcanic eruptions, solar and orbital variations and anthropogenic (human) changes to the composition of the atmosphere.
Greenhouse Gas Those gaseous constituents of the atmosphere, both natural and anthropogenic, that absorb and emit radiation at specific wavelengths within the spectrum of terrestrial radiation emitted by the Earth’s surface, the atmosphere itself, and by clouds.
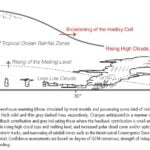
Hadley Cell A direct, thermally driven overturning cell in the atmosphere consisting of poleward flow in the upper troposphere, subsiding air into the subtropical anticyclones, return flow as part of the trade winds near the surface, and with rising air near the equator in the so-called Intertropical Convergence Zone.
Internal variability Variations in the mean state and other statistics (such as the occurrence of extremes) of the climate on all spatial and temporal scales beyond that of individual weather events, due to natural unforced processes within the climate system because, in a system of components with very different response times and complex dependencies, the components are never in equilibrium and are constantly varying. An example of internal variability is El Niño, a warming cycle in the Pacific Ocean which has a big impact on the global climate, resulting from the interaction between atmosphere and ocean in the tropical Pacific.
Inter-Tropical Convergence Zone The Inter-Tropical Convergence Zone is an equatorial zonal belt of low pressure, strong convection and heavy precipitation near the equator where the northeast trade winds meet the southeast trade winds. This band moves seasonally.
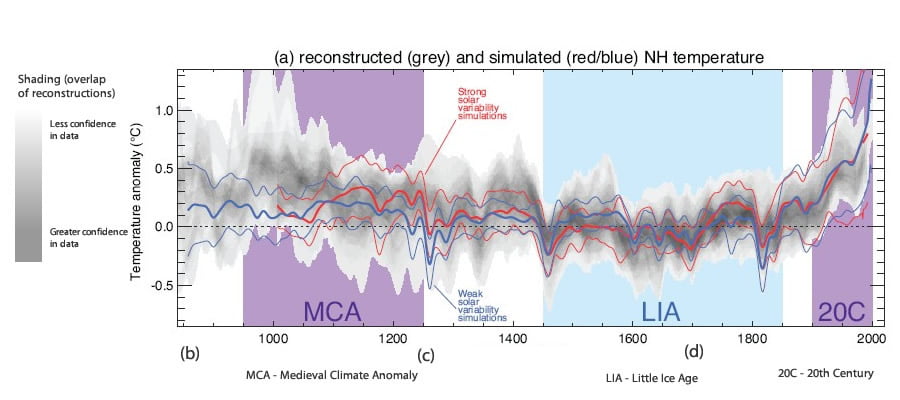
Paleoclimate Climate during periods prior to the development of measuring instruments, including historic and geologic time, for which only proxy climate records are available.
Pelagic Any water in a sea or lake that is neither close to the bottom nor near the shore.
Phenology The study of periodic plant and animal life cycle events and how these are influenced by seasonal and interannual variations in climate, as well as habitat factors.
Mitigation A human intervention to reduce the amount of climate change for example by reducing the sources or enhance the sinks of greenhouse gases.
Reconstruction Approach to reconstructing the past temporal and spatial characteristics of a climate variable from predictors. The predictors can be instrumental data if the reconstruction is used to infill missing data or proxy data if it is an indirect measure used to develop paleoclimate reconstructions.
Stratosphere The highly stratified region of the atmosphere above the troposphere extending from about 10 km (ranging from 9 km at high latitudes to 16 km in the tropics on average) to about 50 km altitude.
Troposphere The lowest part of the atmosphere, from the surface to about 10 km in altitude at mid-latitudes (ranging from 9 km at high latitudes to 16 km in the tropics on average), where clouds and weather phenomena occur. In the troposphere, temperatures generally decrease with height.
Uncertainty A state of incomplete knowledge that can result from a lack of information or from disagreement about what is known or even knowable. It may have many types of sources, from imprecision in the data to ambiguously defined concepts or terminology, or uncertain projections of human behaviour.
UK National Curriculum Links
KS3 geography
- Physical geography relating to: weather and climate, including the change in climate from the Ice Age to the present.
- Understand how human and physical processes interact to influence, and change landscapes, environments and the climate; and how human activity relies on effective functioning of natural systems.
GCSE Geography
- Changing weather and climate – The causes, consequences of and responses to extreme weather conditions and natural weather hazards, recognising their changing distribution in time and space and drawing on an understanding of the global circulation of the atmosphere. The spatial and temporal characteristics, of climatic change and evidence for different causes, including human activity, from the beginning of the Quaternary period (2.6 million years ago) to the present day.
