How Did the UK’s Temperature Change Between 1960 and 2009?
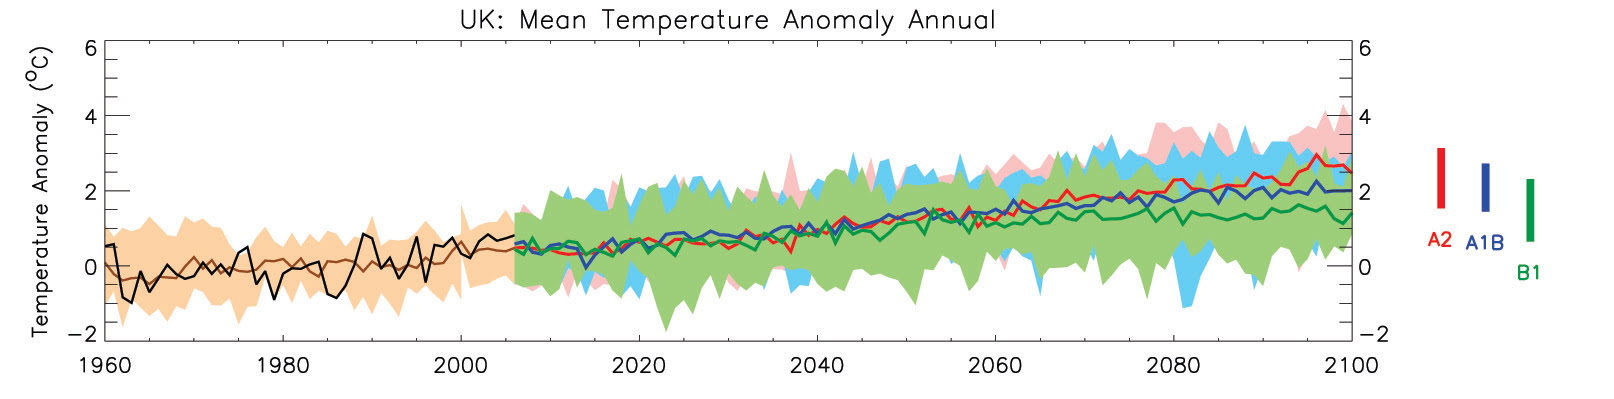
- The black line shows the actual temperature anomaly for each year from 1960 to 2000. This is the difference in temperature between the year’s recorded temperature and the average of all years between 1970 and 1999. If the anomaly is positive, that year was warmer than the 1970-1999 average. If it is negative, that year was colder than the 1970-1999 average.
- The brown line shows past temperature anomalies as produced by a computer model with the brown shading showing the range of temperatures produced by the model.
- Since 1960 the average temperature has increased by 0.9°C – a rate of 0.20°C per decade.
McSweeney, C., New, M. and Lizcano, G. (2009) Climate Change Country Profiles – UK. Oxford University School of Geography and Environment and the Tyndall Centre for Climate Change Research. Report commissioned by the British Council, RMetS, RGS-IBG for www.climate4classrooms.org


