How will the United Kingdoms Frequency of Hot Days Change?
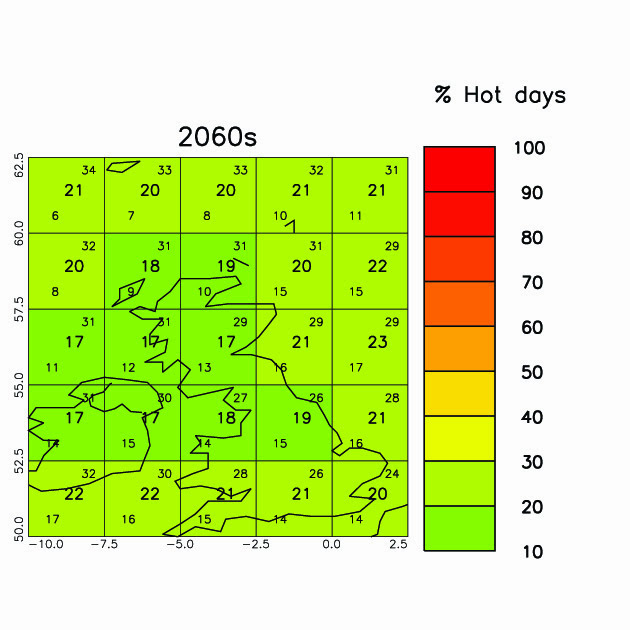
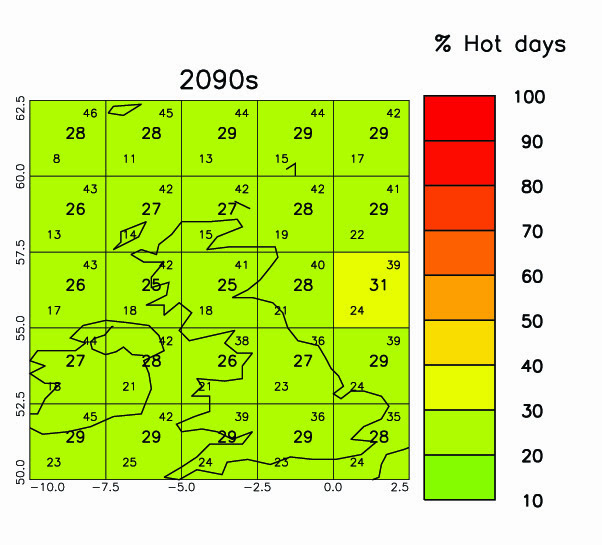
- These two maps show the percentage of hot days expected during the 2060s and 2090s given high carbon dioxide emissions through the century (scenario A2).
- A hot day is defined by the temperature exceeded on 10% of days in 1970-1999. So, in 1970– 1999, you would have expected 1 in 10 days to be hot. If the map shading indicates that more than 10% of days are hot, then there has been an increase in the number of hot days.
- In areas shaded deep red, every day will be a hot day. Yellow areas will have 30% hot days.
- The number in the centre of each grid box is the number of hot days we expect; the smaller numbers in the upper and lower corners give the range of numbers of hot days that might occur.
- The frequency of hot days has increased since 1960 in every season – especially summer (JJA).
- Hot days will become more frequent in all areas of the UK.
- Hot days will occur on 9-25% of days by 2060s and 14-35% of days by 2090s. The fastest increases will be in the summer (JJA).
McSweeney, C., New, M. and Lizcano, G. (2009) Climate Change Country Profiles – UK. Oxford University School of Geography and Environment and the Tyndall Centre for Climate Change Research. Report commissioned by the British Council, RMetS, RGS-IBG for www.climate4classrooms.org
