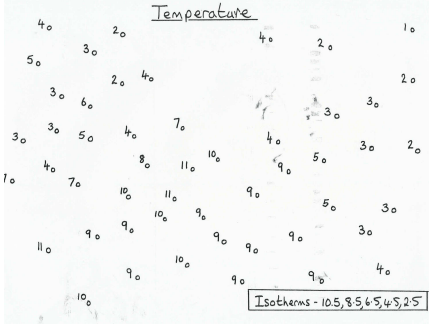
Lines of equal temperature – temperature contours, are called isotherms.
In this exercise, the task is to draw the 8.5°C, 6.5°C and 2.5°C isotherms. The 10.5°C and 4.5°C isotherms have already been drawn to help.
Start with the 8.5°C isotherm. This is the line which has everything warmer than 8.5°C on one side of it, and everything colder than 8.5°C on the other side. You could use a coloured pencil to colour in the dots for everywhere that is warmer than 8.5°C. Your isotherm is then the line which separates your coloured dots from the uncoloured ones.
Next, try the 2.5°C isotherm. For this, you could use a different colour to shade the dots for everywhere that is colder than 2.5°C.
Lastly, draw the 6.5°C isotherm. This will be very close to the 4.5°C isotherm in places, so be careful! To help with this, you could use a 3rd colour to shade the places where the temperature is 7 or 8°C, and a 4th colour to shade the places where the temperature is 5 or 6°C. Your line will divide the two.
Remember, contours can never touch or cross each other (it can’t be 8.5°C and 6.5°C at the same place!). The line should start and finish at an edge of the page.

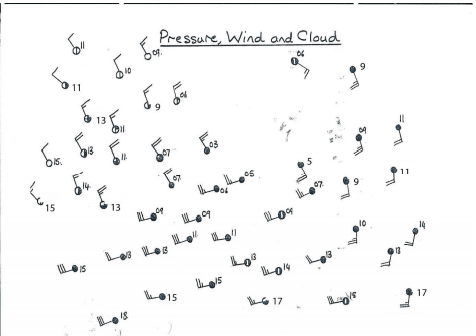
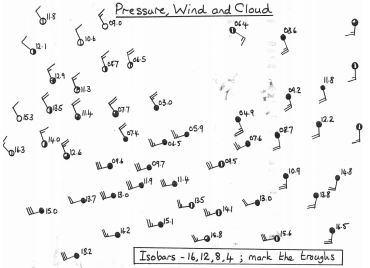
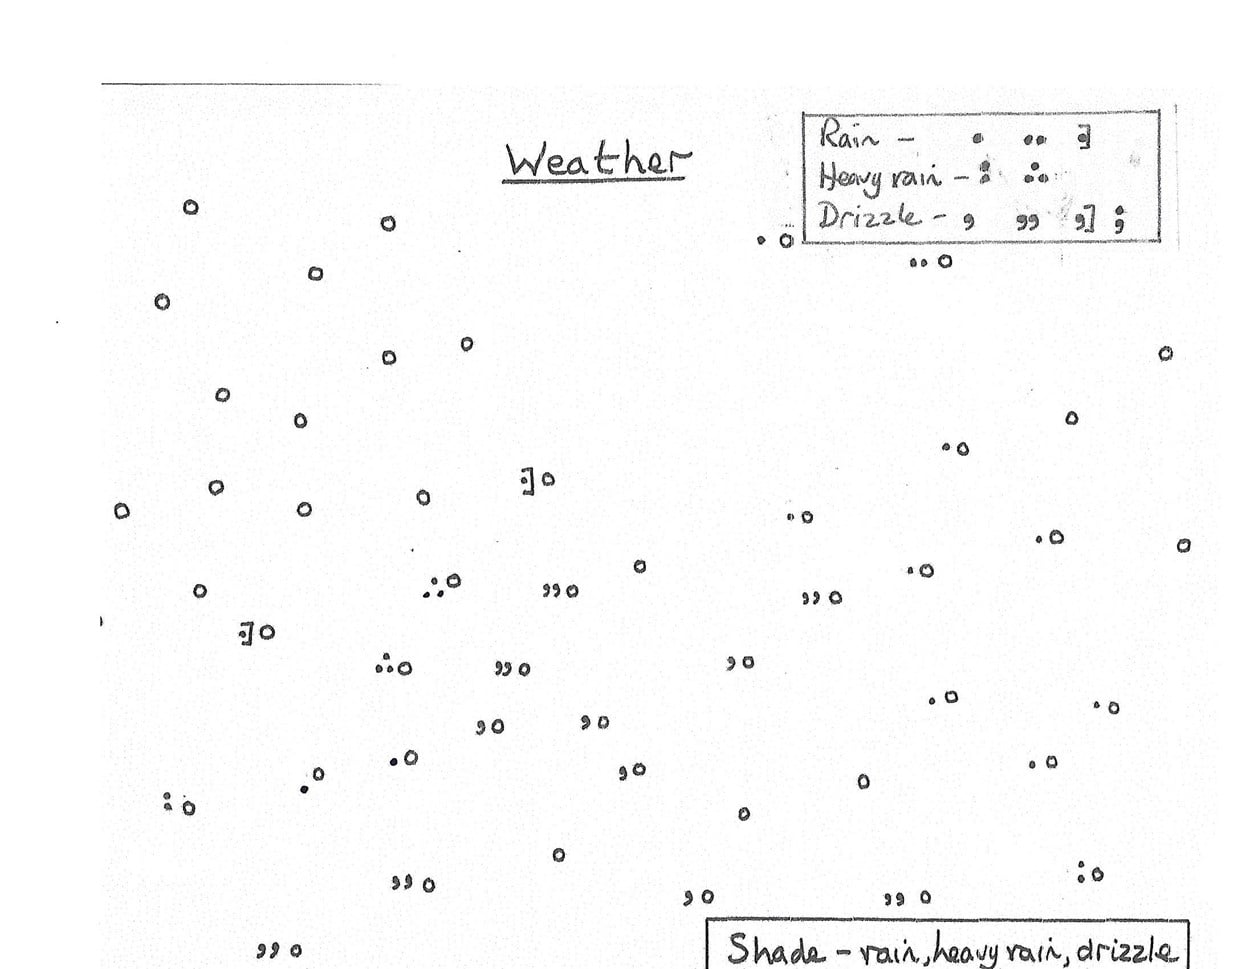
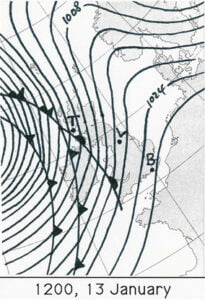
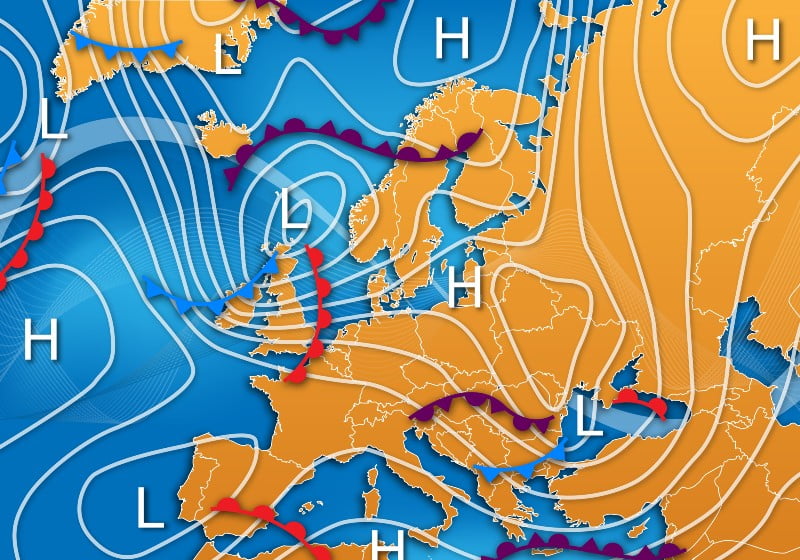
Lines of equal pressure – pressure contours, are called isobars.
In this exercise, the task is to draw the 1016, 1012, 1008 and 1004mb isobars. However, to save space on the map, the pressure values have been recorded in shorthand – so 9 or 09 is short for 1009, 11 is short for 1011 etc.
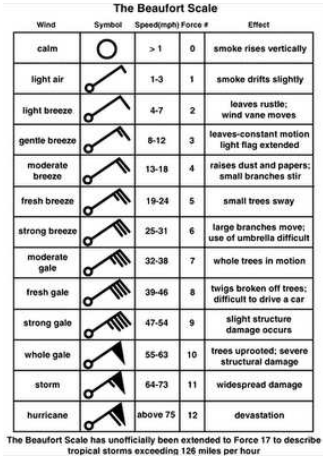
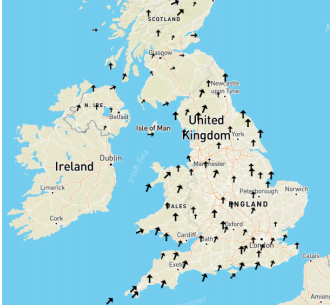
On this map, we have some extra clues – these weather observations indicate the wind speed by the tail on the symbol. The wind is blowing from the tail of the arrow to the centre (the bars on the tail of the arrow tell you the wind speed) so –o is a wind blowing from the west to the east, or o—is a wind blowing from the east to the west. The wind tends to blow along the pressure contours, so your contours need to be roughly parallel to the tails on the closest weather symbols.
Start with the 1016mb contour. Where on the map are there places where the pressure is higher than that? If it helps, colour in those symbols where the value is greater than 16. Your pressure contour needs to divide those symbols from the others.
Now use a different colour to shade the symbols where the pressure value is 13, 14 or 15. Can you now draw the 1012mb isobar?
Again, use a different colour to shade the symbols where the pressure value is 9, 10 or 11. Can you now draw the 1008mbar contour?
Lastly, is there anywhere where the pressure is under 1004mb? If so, draw the 1004mb contour to separate off that observation from the others.


