Country Background Information: Nigeria

Home » Teaching Resources » Climate » Page 8

Country Background Information: Nigeria

Facebook
Twitter
Pinterest
Print
Nigerian flag
Nigeria

If possible, download these two documents to your phone, so that you can refer to them later:

Key country facts

Glossary

lagos

Nigeria has the highest population in Africa. 51% of its population lives in urban areas, an 18% increase over the last 10 years. Half the population of the country lives below the International Poverty Line, driven by ethnic conflict, political instability and income inequality. Source: Flickr / Robert

women

Gender inequality is a major issue in Nigeria. In 2007, 64% of boys and 58% of girls of primary school age were in school. Nigeria has the highest number of children out of school in the world. Source: Flickr / Mark Fischer

drilling

Nigeria is the 13th largest producer of oil in the world. Its oil and gas sector accounts for about 10% of GDP, while petroleum exports revenue represents over 86% of total exports revenue. However, it employs only a tiny fraction of the population and conflict limits productivity. Source: Flickr / e.r.w.i.n.

market

Agriculture and food production is the main source of livelihood and largest economic sector in Nigeria, despite the prominence of the oil industry. Its main crops are rice and cassava, with a heavy reliance on rainfall. Source: Flickr / Andrew Moore

makoko village

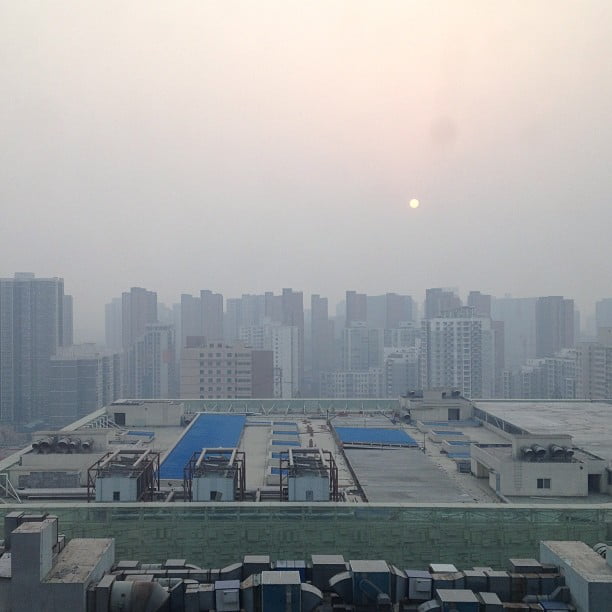
Situated on a lagoon in Lagos, Nigeria’s largest city, is Makoko – a floating slum village. This community was a result of population explosion and migration of people into the cities. It has about 250,000 residents. The government is working with them to regenerate the area. Source: Flickr / Rainer Wozny, Heinrich-Böll-Stiftung

villager

There are more rural poor than urban poor. Nigeria has the 5th lowest life expectancy of countries worldwide. Source: Flickr / Rainer Wozny, Heinrich-Böll-Stiftung

waterfall

Nigeria’s unique rainforest is amongst the richest in Africa. The country is also home to numerous important game reserves, such as the Yankari and Kainji national parks. Source: Flickr / Shiraz Chakera

infrastructure

Despite its relatively fast development, infrastructure (e.g. buildings, roads and other communications networks and power supplies) in Nigeria remains inadequate. Nigeria spends about US$6 billion (5% of GDP) per year for infrastructure development, however, the Asian Development Bank recommends that for a developing country to sustain growth, it has to spend at least 6% of its GDP on infrastructure. Source: Flickr / Jollof Malt

cocoa

Cocoa is the main agricultural export of Nigeria. However, production has been declining in the last five years. Apart from policy challenges, cocoa production is sensitive to increase in temperature and reduced rainfall. Source: Flickr / Jollof Malt

desertification

Around two-thirds of the total land area of Nigeria is experiencing desertification. Desertification happens because of high temperatures and low rainfall which results in land being unable to support vegetation or the growth of plants. Source: Flickr / Jeff Attaway

Country Background Information: Maldives

Home » Teaching Resources » Climate » Page 8

Country Background Information: Maldives

Facebook
Twitter
Pinterest
Print
Maldive flag
Maldives

If possible, download these two documents to your phone, so that you can refer to them later:

Maldives

Glossary

tropical beach

Tourism is the main industry in the Maldives. It has 1,190 islands, with 200 inhabited. The availability of drinking water and arable land are its limiting factors. As sea levels rise, salt water can encroach on the lenses of fresh water stored in the ground.

corals

Maldives has one of the richest marine biodiversity in the world. All the islands in the Maldives are atolls or ring-shaped coral islands. In unusually hot weather, coral reefs can become ‘bleached’ when the coral loses the algae that lives within it and provides it with food. In long hot spells, this can lead to the coral dying. Over 60% of its reefs are already bleached. As the climate warms, more bleaching events are predicted.

maldives underwater

Over 80% of the Maldives is less than 1m above sea level. This makes the country very vulnerable to sea level rise. In 2009, the Government held a cabinet meeting under water to highlight its vulnerability. Source: Flickr/ Sindi

mangroves

The Maldives hold a range of coastal ecosystems including coral reefs, seagrass beds, lagoons, beaches and small areas of mangrove. These coastal and marine ecosystems are the asset base of the national economy. For example, tourism is based wholly on the health and attractiveness of Maldives’s coastal features. Source: Wikimedia Commons / Nevit Dilmen

family

The total population of the Maldives is just over 540,000. The number of people living in poverty in the Maldives has fallen rapidly in recent years such that now there is very little. Recent migration to the Maldives from South Asia, Egypt, Russia etc. has been to fill jobs in tourism, construction, health and education sectors. Migrants make up over a third of the population.

male arial photo

Most people live on the capital island, Male. Congestion is an issue. It is the 7th most densely populated island in the world. Source: Flickr / Timo Newton-Syms

cargo boat

Imported oil and diesel are the main power source for the Maldives. The Maldives also imports wood, iron and steel, pre-fabricated buildings, vegetables and cement. Source: Flickr / Mark Fischer

fishmonger

Fishing is the second largest industry in the Maldives. Fish is the dominant export from the islands. Fishing relies on healthy marine ecosystems. Source: Flickr / Mark Fischer

diving

Many tourist resorts are reporting severe beach erosion as sea levels rise. Source: Flickr / Neville Wootton

coconuts

Coconuts are important to Maldives’ agriculture and economy. Coconut production is its main agricultural activity while copra made from coconut palms is one of its top export products. Source: Flickr / Easa Shamih

Country Background Information: India

Home » Teaching Resources » Climate » Page 8

Country Background Information: India

Facebook
Twitter
Pinterest
Print
Indian flag
India

If possible, download these two documents to your phone, so that you can refer to them later:

Key country facts

Glossary

taj mahal

The Taj Mahal is a popular tourist attraction in Agra, India. It is considered to be the greatest example of Indo-Islamic architecture and was listed as a UN World Heritage Site in 1983. Local air pollution can cause discoloration to its centuries-old white marble.

flooding

Over 40 million hectares of India’s land is prone to flooding including its two main cities, Kolkota and Mumbai. As sea levels rise, by 2050 at least 40 million people are expected to be at risk.

monsoon

The monsoon season in India is from June to December. Year to year changes in the monsoon can mean flooding or drought. The impact of climate change on the Indian monsoon is as yet not clear. Source: Flickr / Craig Cloutier

mumbai

India is a rising economic power. Its financial and commercial centre is Mumbai where many of its industry sectors operate. These include electronics, manufacturing, and textile, contributing 25% to India’s industrial output. It is also the richest and most populous city in India. Source: Flickr / Puranjit Gangopadhyay / CIFOR

busy market

Over 1 380 million people live in India and its population continue to grow at a faster pace than China. It is therefore projected that by 2024, it will overtake China as the most populous country in the world. 21% of its population is below the poverty line.

wheat fields

Wheat is one of the main agricultural products of India, cultivated mostly in the Northern region. India is the second top producer of wheat in the world. Despite the existence of big commercial industries in Indian cities, more people (42%) still rely on agriculture for livelihood and employment.

Glacier

The Indian Himalayan glaciers cover around 25,000 km2 of catchment area, flowing in three major river systems. Glacial meltwater is important for reservoirs and river flow. Any change in the ice cover and flow of melting glaciers can significantly affect river systems, potentially impacting water quality and availability, for domestic, agricultural and industrial use. Source: Flickr / Steynard

solar panels

Solar energy is India’s top and fastest growing renewable energy resource. It currently contributes 10% to the country’s energy mix, with a generation capacity of 37 GW. In 2017, solar power became cheaper than power from coal. Source: Flickr / CGIAR

rickshaws

Auto-rickshaws are a popular mode of transportation in Indian cities. In Mumbai alone, there are about 200,000 of them. Air pollution from rickshaws poses health risks. Source: Flickr / Melanie M

Delhi

The Urban Heat Island effect means that many cities, like New Delhi, experience warmer temperatures, particularly at night. The warmest places are usually concentrated in residential, industrial, and commercial zones. Source: Flickr / Francisco Anzola

Country Background Information: European Union

Home » Teaching Resources » Climate » Page 8

Country Background Information: European Union

Facebook
Twitter
Pinterest
Print
European Union Flag
Europe

For the purposes of these negotiations, the 27 countries of the EU are Austria, Belgium, Bulgaria, Croatia, Republic of Cyprus, Czech Republic, Denmark, Estonia, Finland, France, Germany, Greece, Hungary, Ireland, Italy, Latvia, Lithuania, Luxembourg, Malta, Netherlands, Poland, Portugal, Romania, Slovakia, Slovenia, Spain and Sweden.

If possible, download these two documents to your phone, so that you can refer to them later:

Key EU facts

Glossary

EU flag

The European Union is composed of 27 diverse member states. The EU more than met its 2020 target of 20% reduction in greenhouse gas emissions. The European Climate Law sets the 2050 target of becoming the world’s first climate neutral continent. Between 2014 and 2020 the EU committed EUR 14 billion to finance climate change adaptation and mitigation activities in developing countries. Source: Flickr / Thijs ter Haar

Luxembourg

Luxembourg is the second richest country in the world based on income. Only 2 500 km2 in size, its territorial GHG emissions are much lower than other EU countries. However, their per capita emissions are one of the highest in the world due to a more energy-intensive lifestyle.

Paris

One of the most visited European destinations, Paris is also significant as a landmark for climate negotiations. In 2015 at the UNFCCC Conference of Parties, 195 nations agreed to sign the Paris Agreement which aims to “keep the global temperature rise in this century well below 2 degrees above pre-industrial levels” and pursue a limit of 1.5 C.

Croatia

Croatia joined the European Union in 2013; the newest member of the EU. Compared to other EU countries which focus on climate change mitigation, the government of Croatia’s climate change policy is focused on adaptation. Because of its coastal location, around 15% of the country is at risk from flooding caused by rising sea levels and extreme weather events. Source: Flickr / Andrey

BMW HQ

Germany has the largest economy in Europe, powered by its biggest industry–automobile manufacturing. Through improvements in engine efficiency and fuel alternatives, this industry has seen significant reductions in GHG emissions. So far, Germany has managed to reduce its total emissions to 36% below 1990 levels, yet it remains to be the biggest contributor to EU emissions.

Malta

Malta currently has the lowest GHG emission among all EU countries, with only 2 Mt CO2eq. Investment in new generation capacity, fuel switching and alternative sourcing of electricity contribute towards the rapid decrease in emissions since 2012.

wind farm at sea

Denmark generates the highest wind power in Europe. In 2019, more than 47% of the country’s electricity was from wind energy. Denmark also exports wind energy to neighbouring countries. Source: Flickr / Kim Hansen

Olive Trees

Olive oil is one of the top agricultural exports from the EU, providing 67% of the world’s olive oil. Scientists predict that olive yield will be affected as drought and pest infestations increase with climate change.

Nuclear Plant

Nuclear power is significant in France’s energy and economy. Around 75% of France’s electricity is from nuclear power. It is also able to export electricity from nuclear energy, earning them around EUR 3 billion per year. Source: Flickr / IAEA Imagebank

Refugees Welcome Sign

Since 2015, about 2 million refugees have come to the EU. Climate change is expected to cause further migration. The EU recognizes this and has set out policy discussions on how they could support and assist other countries in addressing migration as an adaptation strategy. Source: Flicker / Ilias Bartolini

Country Background Information: China

Home » Teaching Resources » Climate » Page 8

Country Background Information: China

Facebook
Twitter
Pinterest
Print
Chinese Flag
China

If possible, download these two documents to your phone, so that you can refer to them later:

Key country facts

Glossary

great wall of china

The Great Wall is one of the most popular historial attractions in China. Built from 3rd century BC to the 17th century AD as a military defence, the Wall extends to 20,000 km. It is listed as a UNESCO World Heritage Site in 1987.

shanghai

On the central coast of China is its biggest city and financial centre; Shanghai. While the city booms economically, its coastal location makes it vulnerable to extreme weather such as flooding. This threatens infrastructure, people, businesses and other economic activities.

panda bear

Pandas are native to China. Despite being a popular conservation icon, giant pandas remain vulnerable to climate change and habitat destruction.

pollution

Urban pollution, including haze and smog, is one of the biggest problems in major Chinese cities. This is caused by smoke from the many vehicles, steel factories, and coal-fired power plants. According to recent research, greenhouse gases potentially contribute to the increasing severity and frequency of haze, exacerbating health risks in cities. Source: Flickr / Thomas Galvez

factory workers

Around 30% of China’s population are employed in industry including mining, iron, steel, aluminum, machinery, and textiles. China is the largest exporter of goods in the world. This also makes it the biggest ‘carbon exporter’: it emits a significant amount of greenhouse gas through making goods for other countries. Source: Flickr / Chris

city people

China has the largest population of any country in the world. With over 1 400 million people, about 20% of the world’s population live in China. However, low birth rates due to government policy and personal choice mean their population is ageing rapidly.

power plant

As part of its efforts to reduce air pollution from coal-fired power plants and to shift to non-fossil fuel energy source, China is increasing its investments in nuclear energy. It currently has 45 nuclear power reactors and is building 12 more. Source: Flickr / Shubert Ciencia

cement factory

China’s manufacturing sector contributes about 40% to its GDP. The cement industry in particular, is one of its largest, along with steel and chemical fertilizers. These however are also carbon-intensive industries and are the largest sources of the country’s greenhouse gas emissions. China is the world’s biggest carbon emitter with emissions increasing through 2018 and the first half of 2019. Source: Flickr / Jonathan Kos-Read

gorges dam

The Three Gorges Dam is a hydroelectric dam built along the Yang Tze River. 660 km long with a 22,500 MW capacity, it is the largest power station in the world. Because of social and environmental issues surrounding its construction, it is also considered by campaigners as the most controversial power station. Source: Flickr / Harvey Barrison

rice fields

425 million are employed in agriculture, producing food for 20% of the world’s population. Crops include rice, wheat, potatoes, sorghum, peanuts, tea, millet, barley, cotton and soybeans. About 74% of their total nitrous oxide emissions (a greenhouse gas) come from fertilizer applications.

Country Background Information: Bangladesh

Home » Teaching Resources » Climate » Page 8

Country Background Information: Bangladesh

Facebook
Twitter
Pinterest
Print
Bangladesh flag
Bangladesh

If possible, download these two documents to your phone, so that you can refer to them later:

Key country facts

Glossary

farming

Agriculture is the main industry employing 87% of its rural population. 39% of Bangladesh’s greenhouse gas emissions come from agriculture which is in itself very vulnerable to floods and drought. Rice is the main crop grown. Source: Flickr /IRRI

rickshaw

Rickshaws, both pedal and motorised, are one of the most common public transportation system in Bangladesh. Transport is Bangladesh’s fastest growing sector and is where Bangladesh’s efforts to reduce greenhouse gas emissions are focussed. Source: Flickr /IRRI

willage

Poverty remains prominent in Bangladesh, where around 22% of the population live below the international poverty line. Many of its rural areas are in riverside and coastal communities that are continuously affected by coastal flooding, river erosion and salt water intrusion. These affect their land and livelihoods making the poor especially vulnerable to climate change.

bengal tiger

The Bengal Tiger is the national animal of Bangladesh and is listed as an endangered species by the IUCN. According to a report by the WWF, continuous sea level rise in the coastal area of Sundarban could significantly reduce their habitats and further endanger tiger populations.

stilt houses

Two thirds of Bangladesh is less than 5m above sea level. Stilt houses are structural solutions for floodprone areas.With around 700 rivers and an extensive river network, up to 70% of the country becomes flooded every year. Tropical cyclones can also cause coastal flooding. Both these risks could increase as the climate changes. If global temperatures continue to increase to 2°C, scientists predict that almost 20% of Bangladesh would eventually be below sea level. Source: Flickr / UCL Development Planning Unit

kids

All children between the ages of 6 and 10 must attend school. Access to education remains a challenge for vulnerable groups, particularly working children, disabled children, indigenous children and those in remote areas or living in extreme poverty. Boys are more likely to miss school than girls, when required to help support their families. Source: Flickr / IRRI

boats on river

Bangladesh lies on a delta of rivers emptying into the Bay of Bengal. Is it low lying and therefore prone to flooding and the effects of tropical cyclones and sea level rise. The government of Bangladesh spends 6-7% of its annual budget on adapting to climate change already. Source: Flickr / IRRI

dhaka uni

Dhaka is the capital of Bangladesh, with a population of 21 million people. The textile industry, making clothes for international markets, is centred on urban areas and is the country’s biggest industry. Source: Flickr /IRRI

busy city

There was rapid urbanisation between 2000 – 2010. 55% of the urban population live in slums. Bangladesh is one of the world’s most densely populated countries with a population of over 160 million. Source: Flickr / Francisco Anzola

drought

Bangladesh sits on the Tropic of Cancer. Monsoon rains last from June to October. North-western Bangladesh can experience drought conditions when there is little rain before or after the monsoon. Climate change is expected to change the rainfall pattern in a way which will lead to more frequent droughts. Source: Flickr /IRRI

Country Background Information

Home » Teaching Resources » Climate » Page 8

Country Background Information

Australia
Bangladesh
Bangladesh
China
Europe
India
Maldives
Nigeria
Russian Federation
USA
Venezuela

Climate Change Negotiations for Schools

Simulating a world climate change conference

Guidance for Teachers

  • Notes for teachers – this contains everything you need to know to run the activity. Start here!
  • Curriculum Links
  • Print:
    Pack 1 (double sided if possible) – note these are personalised;
    Pack 2 (table flags, must be printed in colour, could be laminated), or as Pack2b names (which can be printed in black and white).
    Pack 3 (sticky labels for printing on standard 8 row label sheets or print on paper and use school lanyards),
    Optional Pack 4 (country fact sheets for reference in class),
    Pack 5 for Module 4, Market Places.
  • PowerPoint slides for use in all modules. Edit this before use to assign students to each country.

Please let us know if you have used these resources by emailing education@rmets.org. It would be great if you could also tell us which year group you used it with, how many students there were and how it went. This will help us refine it in the future.

Module 1 – Introduction

Module 2 – homework

Module 4

Module 5

Module 6

Useful Tools:

Acknowledgements

Silver Geographical Association Publishers Award 2018This work was funded by the Royal Meteorological Society and is supported by Rimini Protokoll, based on their theatre production for DeutschesSchauspielHausHamburg: World Climate Change Conference , 2014.

We are delighted that this resource has been awarded a Silver award by the Geographical Association. The citation given reads “Simulating a world climate change conference is a free, online and multimedia resource, relevant for both GCSE and A level specifications. It provides a wealth of high-quality, sophisticated and up-to-date materials including video input from one of the British delegates to the Paris climate talks. The judges felt that the quality of the resource would enable teachers to confidently set up an excellent simulation for their classes.”

This resource has also been Highly Commended by the Scottish Association for Geography Teachers.

You may also be interested in the higher level version, not specifically for schools, created by Climate Interactives using the CRoads model and the model climate conferences for secondary schools run by InterClimate.org in local council chambers.

David Warrilow, UK representative to the Paris negotiations, has published this article: Science and the international climate negotiations

stripes Europe

Climate Change Resources

Summary of Weather and Climate links in the KS3 2014 National Curriculum (England).

   Curriculum LinksOther useful resources
Module 1 – Climate Change Nuts and BoltsScheme of WorkGreenhouse GasesGeography, ChemistryClimate Change Resources
 RSC resourcesBackground info for teachersGeographyClimate, Climate Change and Climate Engineering
  Scheme of Work  
  Leaves as Thermometers  
  Sediment Core Image  
  Sediment Core Key  
  Tree Ring Images  
  Teacher Information Sheet – Ozone  
  Ozone Layer Questions  
Module 2 – Do not believe the hype .. or Should IScheme of Work Geography, Chemistry 
 Student Challenge Sheet   
 Persuasive Presentation – Climate Change  Climate Change Negotiations Resource
 Climate Change ScepticismTeachers’ GuideGeography, Chemistry, Combined Science 
  Debate Card 1  
  Debate Card 2  
  Climate Change Scepticism PowerPoint  
Module 3 – Climate Change all around me (Indicators)Scheme of Work Peer AssessmentGeography,  ChemistryClimate Change in the UK
Module 4 – so what (Impacts)Scheme of Work   
 Afsana MysteryInstructions  
  PowerPoint  
  Cards  
  Criteria levels  
 Day After TomorrowFact or Fiction  
  Answer Sheet  
 De BonoDe Bono Hats  
  Group Summary  
 Global DimensionScheme of WorkFrench 
  Climate Change global dimension – staff  
 Global Dimension – FloodingScheme of Work Geography 
  Session 1 – Flooding  
  Session 2 – Flooding  
  Session 3 – flooding and biodiversity  
  Session 4 – Doctor’s report  
  Session 4 – Flooding and Disease  
  Session 5 – flood prepare & prevention  
  Session 6 – Flooding Council  
 MigrationMemory Map  
  Card sort  
 Polar BearPowerPoint  
  Agony Aunt template  
 Impacts PowerPoint   
Module 5 – Climate Change Champions (Mitigation)Scheme of Work   
 Carbon Neutral HouseInstructions  
  Ideas Template  
  Sheet A  
  Sheet B  
  Sheet C  
  Sheet D  
   Sheet E  
  Sheet F  
 Recycling Food MilesFood Miles Factoids  
  Food Miles Factoids as pdf  
  Food Miles Articles  
  Recycling Factoids  
  Recycling Factoids as pdf  
 Sustainable LivingChallenge Point Scores Sheet Summary  
  Challenge 1 – compost  
  Challenge 1 – organic  
  Challenge 1 – food table  
  Challenge 2 – kite  
  Challenge 3 – word search  
  Challenge 5 – community classroom  
  Challenge 6  
  Challenge 7  
  Footprints  
  People Points  
  Planet Poster  
  Student Diary Challenge  
Module 6 – Making the most of it (Adaptation)Scheme of Work   
 What is Climate Change Adaptation   
 What is the Adaptation Challenge    
 Why is Climate Change Adaptation Important?   
 Peer Assessment   
 Student Challenge Sheet   
TreesScheme of Work Biology (plant reproduction, photosynthesis), Chemistry (carbon cycle) 
 How a Tree Works Scheme of WorkModel comments  
  Peer Assessment  
 Why are Trees Important Scheme of WorkExtended Teacher Notes  
  Sustainable Forest Management Questionnaire  

General Resources

Diamond Ranking sheet

Acknowledgements

The Climate Change Schools Resources were developed by the Climate Change Schools Project, based at the then Science Learning Centre in Durham and led by Krista McKinzey. A large number of teachers and schools in North East England were involved in their development.

They have subsequently been updated by the Royal Meteorological Society.

Climate Change Resources

Some introductory PowerPoint presentations suitable for more advanced students, teacher CPD etc.:

Atmospheric Structure

Atmospheric Composition

Solar Radiation

Climate Feedback Mechanisms

Ozone Depletion

The Climate Change Schools Resources were developed by the Climate Change Schools Project, based at the then Science Learning Centre in Durham and led by Krista McKinzey. A large number of teachers and schools in North East England were involved in their development.


They have subsequently been updated by the Royal Meteorological Society.

MetLink - Royal Meteorological Society
We use cookies on this site to enhance your user experienceBy clicking any link on this page you are giving your consent for us to set cookies. More info

By clicking any link on this page you are giving your consent for us to set cookies. More info