
secondary-science

Label the seasons in the Northern Hemisphere.

Web page reproduced with kind permission of the Met Office
Energy and Climate Change
Energy is needed in the form of electricity to power our lives, and to fuel our travel and industry. Since 1990, total world energy consumption has increased by over 55% and is projected to increase by another third by 2040.
Globally, oil accounts for over 30% of total energy use, followed by coal, gas and nuclear at 4%. This mix is different when you look only at electricity production, and different again on a country by country level.
A sustainable energy transition is a shift from an energy intensive society based on fossil fuels to energy efficiency with low carbon and renewable energy sources.
The Paris Agreement is a legally binding global climate change agreement, adopted by 189 nations at the Paris climate conference (COP21) in December 2015. It sets out a global framework to avoid dangerous climate change by limiting global warming to well below 2°C and pursuing efforts to limit it to 1.5°C.
Significant changes in energy production, transmission and use are necessary to achieve these commitments.
This should lead to co-benefits including improved air quality and reductions in energy poverty.
Since 2019, the costs of developing new power plants based on hydroelectric power, onshore wind, solar photovoltaic (PV), biomass and geothermal energy have become comparable to the costs of new oil and gas fuel plants.
Physicists play an essential role in all aspects of climate change research and policy decisions as well as in development of technologies and new ideas for preventing and mitigating the effects of future, damaging climate change.
Energy and Core Physics
Energy is a fundamental concept in physics and a key topic in any physics curriculum. The Earth’s climate system is driven by energy stores and transfers. Development of clean, sustainable energy generation and distribution methods relies on understanding the core physics involved. The climate system and sustainable energy production therefore provide engaging and relevant sources of examples for enhancing the teaching and learning of energy as a topic in Physics. They give teachers an obvious opportunity to engage their students in an appreciation of the importance of the physics already in the school curriculum in solving many of the problems surrounding accelerated climate change, as illustrated in the following, brief summary of potential links.
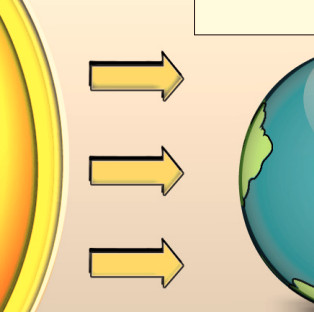
Energy is transferred by radiation from the Sun, increasing the thermal store in the Earth’s atmosphere and ocean systems. Energy transfers within these systems take place through the physical processes of conduction, convection, radiation and changes of state. Seasonal and longer term, natural variations in heating and cooling of the Earth are a result of the alignment of the Earth in space and its orbital motion around the Sun. Land and ice surfaces are heated differentially according to the absorptive or reflective nature of the surface type and rocks are heated internally due to energy released during radioactive decay and large scale, convective motion of the Earth’s interior.
Successful and sustainable, low carbon generation of electricity to meet current and future demands relies on understanding and exploiting many of these natural, physical processes. Atmospheric convection causes winds to drive wind turbines and also generates the ocean waves exploited in wave power devices. The relative motion of the Earth, Moon and Sun causes the ocean tides exploited in tidal barrages and undersea-current driven turbines. Seasonal changes, weather patterns and latitude can all affect the output of solar energy devices as can reflection and absorption of radiation by the materials they are made from. Geothermal energy relies on energy transfers due to radioactive heating of rocks, local volcanism or simply the heat capacity of the soil acting as a thermal store of energy.
Many large-scale electricity generation methods depend on the basic principle of a turbine turning a generator which relies on understanding the principles of electromagnetic induction and factors affecting potential power output and efficiency. Electricity distribution on a large scale, via the National Grid, involves minimising energy dissipation into the surroundings by transmitting electricity at very high potential difference and low current thus reducing thermal transfers of energy within the cables. Domestic uses of electricity involve devices with varying levels of energy efficiency and informed choice of the most efficient appliances and how long they are used for can lead to reductions in an individual’s energy demands, carbon footprint and household bills.
Energy Efficiency
Improving energy efficiency saves individuals money, reduces waste, conserves resources and cuts emissions of greenhouse gases and other pollutants. Discussing personal, financial savings and more immediately obvious environmental impacts can lead to engagement with climate change by an indirect route with valid applications in the physics curriculum. This is also a good opportunity to reinforce accurate vocabulary using the terms energy stores, transfers and pathways as well as the concept of energy dissipation and avoiding terms such as energy saving (https://spark.iop.org/collections/energy-new-curriculum). Examples can be given of more relevant applications of the Sankey Diagram as a tool for accounting for energy transfers in the atmosphere:
(see also http://www.sankey-diagrams.com/greenhouse-effect-explanation-with-sankey-diagram/ and https://www.metlink.org/wp-content/uploads/2020/11/PhysRev-25_energybudgets.pdf)
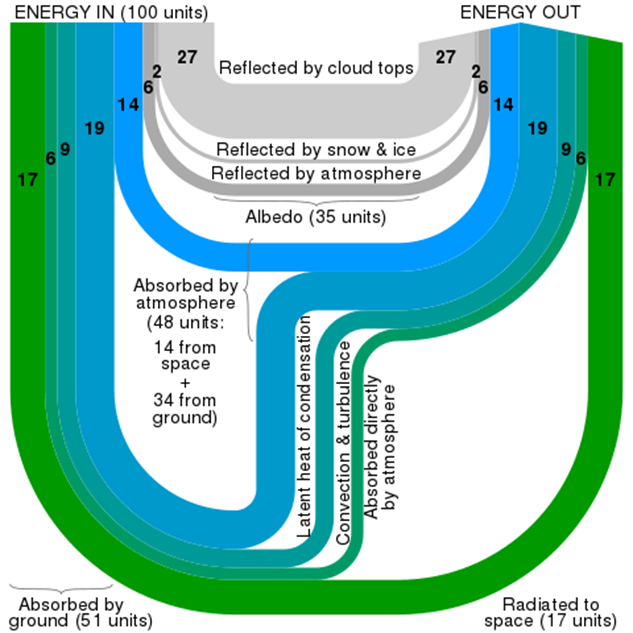
By Cmglee – Own work, CC BY-SA 3.0
This could be used to illustrate a more complex example of a Sankey diagram and lead to a discussion of the possible effects of changes to some of the pathways, reinforcing the concept of energy conservation as both sides must remain balanced.
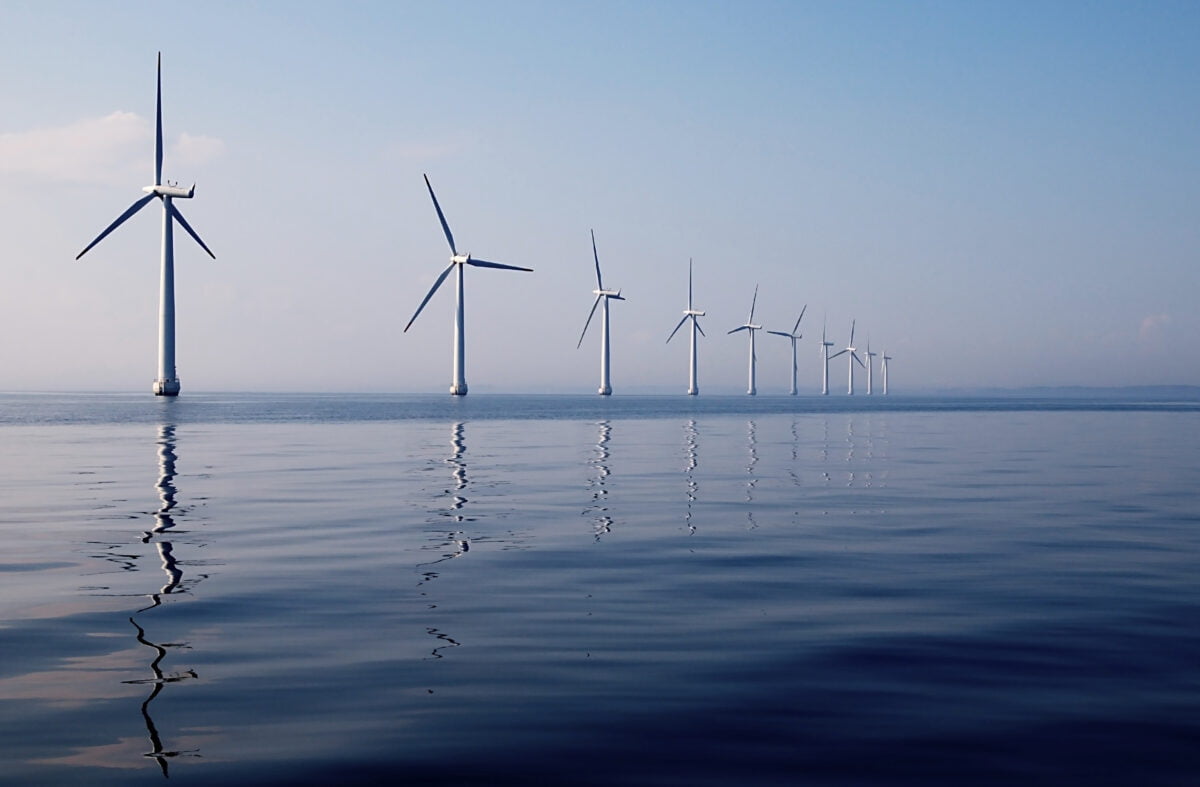
Wind Turbine Example
In a wind turbine, 20% of the energy from the wind is converted to electricity. Lost wind leads to a loss of 30 % of the energy, friction between the wind and the blades of the turbine and the wind leads to a loss of 25% of the energy, and the rest of the energy is lost due to friction in the electric generator.
2. Draw a Sankey diagram for the wind turbine, considering that the output in electrical energy is 20 kJ.

Experiments and demonstrations
A wide range of animations suitable for geography and science topics.
Resources looking at change of state, latent heat, data handling and the Electromagnetic Spectrum from the NCAS/ DIAMET project.
A science upd8 resource looking at rain and cloud seeding.
Online, interactive lessons on climate change from NGfL Cymru here and here
An Inconvenient Truth the climate change film pack (look under essential reading and DCSF lesson resources)
Met Office climate introduction
Climate change and information from Ice Cores from WAIS divide.
A NASA introduction to the Earth’s Energy Budget – scroll down to “Balancing our Planet’s Energy Budget”.

Planetary radiation budget images for the Earth, Venus, Mars with a dust storm and Mars without a dust storm.
Establishing the radiation or energy budget of the Earth has been crucial to understanding climate change, but what do the radiation budgets of other planets in our solar system look like? Read about it here:
Watching the Earth – artificial satellites
Catalyst article on Cloud Seeding
Resources to 3D print the Central England Temperature record and use the models in subsequent STEM or geography clubs or lessons.
Met Office Design and Technology resources to build your own weather station (for the Resistant Materials GCSE topic): Anemometer Project – Student version, Rain Gauge Project – Student version, Thermometer Project – Student version and Thermometer Project – Teacher Example
A wide range of animations from the Met Office suitable for geography and science topics.
Resources looking at change of state, latent heat, data handling and the Electromagnetic Spectrum from the NCAS/ DIAMET project.

In this experiment the students will look at the effect of Particulate matter or other substances that have landed on ice and test how this can speed up the melting of ice by affecting its albedo. Particulate Matter and aerosols are made up of a variety of pollutants, some of them enhancing and some counteracting the greenhouse effect when they are in the atmosphere. But once they land on snow or ice, they will promote the melting of these surfaces.
9.2.3. Properties and effects of atmospheric pollutants
Particulate Matter is a pollutant that absorbs at many different wavelengths, some act as greenhouse gases and others actually reflect more light than they absorb, leading to a reduction in the temperature of the atmosphere. When they (or Black Carbon in particular) deposit on snow and glaciers, they change the albedo (the reflectivity) of the snow surface. This controls the heat balance at the surface of snow and ice surfaces as the darker colour of the ice will lead to it melting faster.
Particulate Matter is solid particles that are so small that they float in the atmosphere and can be measured as a concentration in the atmosphere. They are formed from incomplete combustion of wood and fossil fuels. PM smaller than 2.5 microns (2.5 x 10⁻⁹ m), PM2.5 , is much smaller than the width of a human hair and can enter into our lungs and be carried into the blood system and cause damage to the brain and the cardiovascular system.
Uncertainties to do with the quantities of the different particles in the atmosphere (and the fact that particles enhance cloud formation) are part of the biggest current uncertainty in climate models.
This experiment can be carried out in pairs or larger groups and takes about 20 minutes.
Follow the notes in the student worksheet, allowing more time to discuss what particulate matter is, what is albedo and how sunlight is absorbed differently by different coloured substances.
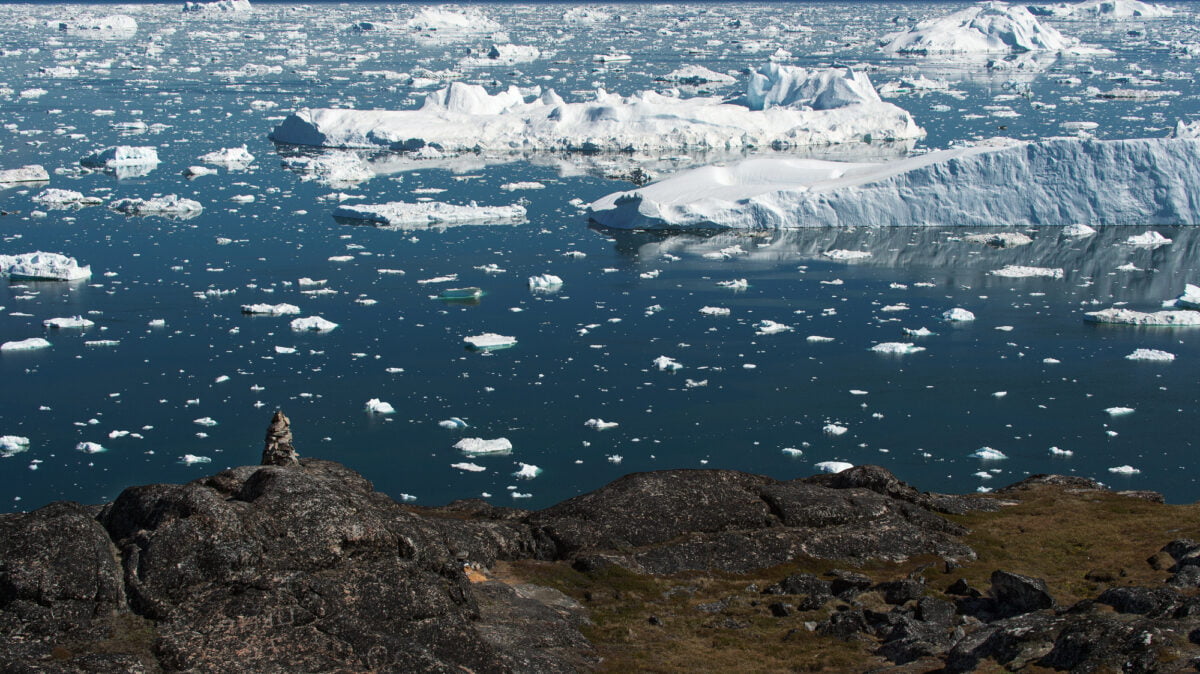
Application to the World’s Glaciers:
Glaciers around the world are more exposed to particulate matter now than they ever were before the industrial revolution and the increase in industry and cars over the last century. Covering snow and ice with a dark layer changes the albedo and they absorb more heat and melt quicker than the pure ice.
Particulates are tiny solid or liquid particles that are present in the atmosphere. They are sometimes termed aerosols when they float in the air. Examples are dust, spores and pollen, salt from sea spray, volcanic ash and smoke. Black carbon (elemental carbon (soot) or organic carbon) from incomplete combustion in the atmosphere can actually absorb incoming solar radiation and cool the Earth. However, when these particles land on ice, the absorption of radiation will enhance the ice´s melting.
Iain Stewart BBC black ice experiment
UN Environment programme, 2019: Glaciers are melting and air pollution is the cause
See bar chart of radiative forcing of various gases or particulates in Fig 14.4 Ramaswami et al., 2019
Increased CO2 levels in the atmosphere are buffered by the oceans, as they absorb roughly 30 % of this CO2. The negative consequences of this are that the oceans become more acidic. The CO2 reacts with water and carbonate to form carbonic acid, reducing the available carbonate that shellfish, crabs and corals combine with calcium to make hard shells and skeletons.
Chemicals | Apparatus |
Bicarbonate of soda (1/2 teaspoon) | 2 x 500 ml Beakers |
White vinegar (1 teaspoon) | Small plastic or paper cup (100 ml) |
Indicator: Bromothymol blue (Diluted with water: 8 ml bromothymol blue (0.04% aqueous) to 1 litre of water) | Masking tape |
2 x Petri dishes or lid for large beakers | |
Safety glasses and lab coat | |
Teaspoon or 5 ml measuring cylinder | |
Two sheets of white paper |
Corals and shellfish can be affected by ocean acidification, making it harder to create their shells, which will affect other fish up through the food web.
Corals and fish can be affected by slight changes in the temperature of the water and the next experiment also shows the effect of temperature increase on CO2 absorption, creating a positive feedback, a knock-on effect.
If the oceans are absorbing large quantities of carbon, and if we know the oceans are warming due to global warming, what is the effect of warmer oceans on CO2 absorption? Let´s check with this experiment that shows how much CO2 will dissolve in the water and how much will be in its gaseous form above the water.cr
|
Chemicals |
Apparatus |
|
Water |
2 x 500 ml measuring cylinders |
|
Effervescent fizz tablets (e.g. Alka Seltzer) |
2 x Petri dishes that fit over the cylinders |
|
Ice (optional) |
Bowl or container of at least 5 litres |
|
Stand and clamp to hold cylinders |
|
|
Water heater |
|
|
Funnel (optional) |
Experiment number | WARM water (volume of air/ml) | Experiment number | COLD water (volume of air/ml) |
1 |
| 1 |
|
2 |
| 2 |
|
3 |
| 3 |
|
4 |
| 4 |
|
AVERAGE volume |
| AVERAGE volume |
|
Question: Does more CO2 escape from warm or cold water?
If more has escaped from the liquid, the water cannot absorb as much CO2.
Extension Question: With global warming and warmer oceans, will the oceans be able to absorb more or less CO2 than before?
What is the perfect pH of the oceans? Is it different depending on which ocean and whether it is in the deep ocean or the shallower coastal areas?
Increased CO2 levels in the atmosphere are buffered by the oceans, as they absorb roughly 30 % of this CO2. The negative consequences of this are that the oceans become more acidic. The CO2 reacts with water and carbonate to form carbonic acid, reducing the available carbonate that shellfish, crabs and corals combine with calcium to make hard shells and skeletons.
4.2.4 The pH scale
9.1.2 The Earth´s early atmosphere
9.2.3. Global climate change
Na2CO3 + 2 CH3COOH → 2 CH3COONa + CO2 + H2O (Bicarbonate of soda reacts with vinegar to form carbon dioxide)
In this experiment the students will initiate a reaction that produces CO2 in an enclosed water-air environment. The CO2 formed will be absorbed into the water, making it more acidic and changing the colour of the indicator. The experiment can be carried out in pairs and takes about 15 minutes. An additional experiment to test the solubility of CO2 in warm and cold water can be carried out afterwards, explaining how global warming can affect marine CO2 absorption.
See the student worksheets for the detailed preparation: Ocean acidification and CO2 Absorption
The beaker is like an enclosed ocean-atmosphere and the CO2 from the reaction will equilibrate between the water and the air. Our oceans absorb more CO2 when the concentration in the atmosphere increases. But how much CO2 can they keep absorbing? Will they reach a saturation point?
Corals and shellfish are affected by ocean acidification, making it harder to create their shells, which will affect other fish up through the food web. Global warming caused by the increased CO2 effects the corals and fish as only slight changes in the temperature of the water can have effects throughout the ocean´s food chain. So there is a knock-on effect or a positive-feedback from the ocean heating and the ocean acidification.
If you want to illustrate more about the feedbacks and this double impact, the next experiment demonstrates the effect of a temperature increase on CO2 absorption, thus limiting the water´s capacity to absorb as much CO2.
This experiment allows students to determine how much CO2 dissolves in warm or cold water.
See the student worksheet for the detailed preparation.
Application to the World’s Oceans:
More CO2 has escaped from the warm water, showing that it cannot absorb as much CO2. Warmer oceans will not be as effective buffers at removing CO2 from the atmosphere. However, this phenomenon does prevent these warmer oceans from being as acidic.
Have a look at these two glaciers, one has fresh snow over the glacier and the other is a dry glacier in summer with accumulated deposits of dust and Black Carbon from air pollution. Which one do you think is more vulnerable to melting? Does a bright white surface reflect more or less light than a darkened surface?

Fresh clean snow on the Silvretta glacier, Switzerland (Zoë Fleming)

Dirty ice on the Fox Glacier, New Zealand (Sylvia Knight)
Particulate Matter is solid particles that are so small that they float in the atmosphere. They are formed from incomplete combustion of wood and fossil fuels. When they are smaller than 2.5 microns (2.5 x 10⁻⁹ m, an eight the width of a human hair), this PM2.5 can enter into our lungs and be carried into the blood system and cause damage to the brain and the cardiovascular system.
When Particulate Matter (or Black Carbon, which is more or less soot or pure Carbon) settles on glaciers and snow it darkens the colour of the snow and hence changes the how much of the Sun’s light the snow reflects. In this experiment we will check to see whether dirty or clean ice melts faster.
Chemicals | Apparatus |
3 ice cubes per group | 3 bowls for placing ice cubes |
Soot or Activated Carbon or burn a splint and gather the blackened combusted material | Spotlight |
Soil or sand (as light coloured as possible) | Measuring scale |
| Spoon or forceps to move the ice cube between the bowl and the measuring scale |
Application for the world’s glaciers:
Glaciers around the world are more exposed to particulate matter now than they ever were before the industrial revolution. Covering them with a dark material changes the albedo. The darker the surface, the more of the Sun’s light is absorbed by the glacier, warming it and melting it.
Particulates are tiny solid or liquid particles that are present in the atmosphere. They are sometimes termed aerosols as they float in the air. Black carbon (soot) is a particulate released from incomplete combustion. It absorbs the Sun’s light, which actually helps to cool the Earth. However, when it lands on ice, the absorption of radiation speeds up the ice´s melting as the light is absorbed by the dark colour and heats up the ice.
Social and political perspectives:
Knowing that air pollution that reaches glaciers is increasing their melting faster than what would happen from air temperature changes alone, what do you think we can do in terms of laws or behaviour change?
How can we reduce soot and Black Carbon reaching glaciers? Emission control of cars? Banning domestic wood-burning? Have you heard of smokeless coal that can be used in stoves in smoke-free zones? And pellet stoves, are there fewer emissions from these?
Note: You could carry out your own experiment if you are lucky enough to get snow. Prepare two neat snow blocks or two snow-balls of similar size and cover one with gravel or sand and leave the other clean. Watch which one melts first.