This resource makes connections across the sciences to show the vital links between the learning of students, their climate literacy and awareness of related careers.
Learning Objectives
- To understand the factors affecting photosynthesis and the relationships between them
- To understand that the Sun emits mostly radiation in a small range of the Electro-magnetic spectrum.
- To know that the Earth glows with longer wavelength infrared radiation than the Sun.
- To understand that through the latent heat required for evaporation, transpiration cools plants and their immediate surroundings.
- To understand that plants reflect most of the Sun’s radiation, absorbing just the energy needed for photosynthesis. This also cools the surrounding area.
- To be able to assess the healthiness of plants by their ability to reflect solar infra-red radiation.
- To apply their understanding to identify indicators of plant health in agriculture and horticulture, and ways of reducing urban heat stress.
Curriculum Links (England)
KS4 National Curriculum Science
Students should be helped to appreciate the achievements of science in showing how the complex and diverse phenomena of the natural world can be described in terms of a number of key ideas relating to the sciences which are inter-linked, and which are of universal application.
The sciences should be taught in ways that ensure students have the knowledge to enable them to develop curiosity about the natural world, insight into working scientifically, and appreciation of the relevance of science to their everyday lives.
Key ideas including
that many interactions occur over a distance and over time
that change is driven by interactions between different objects and systems
KS4 Biology
life on Earth is dependent on photosynthesis
factors affecting the rate of photosynthesis
some abiotic factors which affect communities
KS4 Physics
Energy transfer
Energy changes involved in change of state (vaporisation/ evaporation)
Electromagnetic waves and transfer of energy
What might teachers and their students gain from this resource?
The resource is about the interconnections between plants and climate: plants are affected by the climate (a mix of abiotic factors) and in turn influence climate, cooling their surroundings, both because of the transpiration that happens and the scattering of solar radiation.
It is also intended to show links between several topics encountered in physics (the electromagnetic spectrum, energy transfers, evaporation) and processes occurring in the living world.
Related resources
PowerPoint: Met Office summer records and vegetation
PDF document: Met Office summer records and VHI 2020-25 for sorting
PowerPoint: Photosynthesis – Plants and Sunlight images
Photosynthesis – Plants and Sunlight
Photosynthesis – the process
This wondrous chemical process at the heart of all life has four very basic requirements of the environment:
Sunlight
Water
A suitable temperature
Carbon dioxide from the air
It will also only happen within the chloroplasts of the plant’s leaves; their formation needs suitable minerals from the plant’s roots, but that’s another story.

Fig. 1

Fig. 2
Here we are going to explore how the interplay of sunlight, water and temperature affect photosynthesis, and how photosynthesising plants in turn affect the environment, locally and in terms of wider climate too.
A lot of this story is about the spectrum of light from the Sun.
Students are probably very aware that in photosynthesis plants remove some carbon dioxide (CO2) from the atmosphere and emit oxygen (O2) and that they influence the environment by providing shade.
Photosynthesising plants are also active in cooling our environment – how does this happen?
Photosynthesis’ Limiting Factors
Each species of plant will, by the long process of evolution, be adapted to the range of temperatures it’s likely to experience.
Within this it can flourish if other conditions are right.
These are enough sunlight incident on its leaves
enough water in its leaf cells
carbon dioxide in the air around it.
If, for instance, a plant has a lot of water, but little light, then extra water doesn’t speed photosynthesis: light is the limiting factor.

Fig 3
Water pressure keeps plant cells turgid (firm), and this has an important role in allowing carbon dioxide from the air to enter the leaf. The lower surface of a leaf has pores (stomata) and the guard cells around these control gas exchange between the leaf and its surrounding atmosphere.

Fig 4
Comparing air in and out of pores
Air In: Atmospheric levels of CO2, H2O vapour and O2
Air out: Decreased CO2, increased H2O vapour and O2
Where a plant is short of water, then the pore’s guard cells are floppy and they close – the plant benefits here by reduced water loss, but this slows down photosynthesis.
There is another look at this later in “plants and temperature”. Plants short of water will not be active in making sugars (the chemical energy store for all life) and in removing carbon dioxide from the air.
Sunlight and the electromagnetic spectrum

The whole family of the e/m spectrum from radio waves to gamma is radiation. Radiation can sound a menacing term, but it is just energy transferred outwards from a source, as shown in the diagram.
Radiation gets its name because each line that it takes is a radius. Sound is radiation because it travels outwards like this!
The Sun’s radiation in most regions of the spectrum doesn’t harm living things; if radiation is ionising, then the story is different. Everyone, especially at work or leisure in the Sun, needs to know that the ultraviolet radiation from the Sun is ionising and can harm our skin cells, with DNA and cell reproduction being affected.

Fig 6
The Sun’s Spectrum
The Sun emits electromagnetic waves right across the electromagnetic spectrum, but because of its temperature, its power is concentrated in the visible and the near infra-red regions of the spectrum, about half in each.
There is, of course, some UV in the Sun’s spectrum, but as shown in the pie chart, it’s only about 8% of the Sun’s energy transfer.

Fig 7
By definition we can’t see the Sun’s infra-red (i-r) radiation, and the Sun’s i-r is not like the longer wavelength i-r with which we glow and that passive infra-red detectors notice to turn on taps and lights when we are around. Because the Sun is so hot, this “near infra-red” is closer to light in the spectrum.

Fig 8
Our atmosphere, as long as there are no clouds, is transparent to both the Sun’s visible and near-infra red radiation. The solar radiation is transmitted and reaches the ground.
Where the Earth’s surface is dark, the solar radiation is absorbed and heats it. The warm Earth glows with “thermal infra-red radiation”, as do all living things, and it is this radiation that is absorbed and then re-emitted by greenhouse gases in the atmosphere.
If solar radiation is reflected or scattered when it reaches the Earth, then this reflected radiation will pass through the atmosphere off to space without being absorbed by Greenhouse gases or warming the atmosphere.

Fig 9
Plants and temperature – a two-way process
Plants can only photosynthesise if the temperature is right for them, but they in turn influence temperature. We are encouraged to “green” our surroundings in order to reduce the heating of our urban spaces, as well as all of the benefit of biodiversity.
Photosynthesising plants:
- are cooling because water evaporates from their leaves to the air through the process of transpiration. Evaporation is a cooling process, involving the concept of latent heat. An oak tree in leaf can evaporate 400kg[1] of water in a day, and the vaporisation of 1kg of water involves the transfer of 2.6 MJ of energy between thermal stores. All photosynthesising plants cool their surroundings to some extent. You can remind student to observe this as they walk around the school’s own surroundings in a heat wave. Ask them to notice where the coolest places are. A misconception is that the understory of trees is cool simply because of the shade – students can observe that the shade of a building is hotter than that of trees. The “life force” of photosynthesis is doing much of the cooling by evaporation.
[1] Daily transpiration of a single sessile oak measured by the tissue heat balance method

Images 1 & 2 Coop Academy Manchester, sunny spring morning.
The thermal image makes evident the impact of plants in the “green wall” on temperature. Teachers in the classroom behind this reported considerable temperature reduction during heat waves after its installation.
2. plants are cooling because they reflect much of the Sun’s energy, absorbing just the parts of the visible spectrum that are useful for photosynthesis, with energy transfer going to the chemical store of sugars. Almost all of the near infra-red radiation (50% of solar energy transfer) is reflected through the atmosphere to space, along with green light.
This reflectance by plants is important because it means that they are not significantly absorbing solar energy, apart from for photosynthesis. By comparison, most dark surfaces absorb not just light but also near infra-red; the energy transfer is to the thermal stores of the surface and the surroundings, increasing global heating.

Fig 10
A layer of cells inside the leaf is responsible for reflecting near infra-red radiation as shown by the white arrow here; notice that the upper layers are transparent to this radiation.
In healthy leaves this near infra-red passes out of the leaf, and off through the atmosphere to space.
Questions for discussion with students
What are the benefits to plants of the near infra-red shine of the lower mesophyll layer.
What would happen to the plant if this radiation was absorbed?
What happens to the temperature of artificial turf in hot weather? Plastic lacks the near infra-red reflectance of living plants and is only cooled by evaporation if sprayed with water.
Great for discussing energy stores, vaporisation and biodiversity as well as the two processes mentioned here.
Why might artificial grass be too hot for dogs (and people) in a heatwave?
Detecting Plant Health

Image 3
The photograph here, with snowy appearance, is of a garden in summer, taken with a camera sensitive to near infra-red radiation.
The bright appearance of the vegetation indicates good health- the leaves are behaving as in the diagram above. I
If water is short, then the initial response of plants is to slightly close the pores, and so water loss is reduced. This slows down photosynthesis and plant growth since less carbon dioxide can reach the chloroplasts. Shortage of water also means that the reflective cells of the mesophyll stop working as they should, and their near infra-red shine is lost.
Discussion with students
What might a near infra-red photo of the garden above look like in a drought?
There is a pair of images in a separate power point for comparison.
Might they suggest why plants have evolved to drop leaves in drought?
Near infra-red reflection depends on leaves being healthy, on them having taken up enough water to be hydrated. When leaves are dehydrated, before even they start to wilt they:
- slow down photosynthesis (students could be asked why, being reminded about the guard cells around pores)
- change colour, scattering more red light, and so appearing more orange or brown
- scatter less near infra-red (students could be asked about the effect of this on the temperature of the leaves)

Image 4
The impact of drought is shown in the photo here: a nature reserve in August 2025, a hot and dry summer. Notice the fallen leaves and their early colour change (leaf shedding helps reduce water loss by plants).
Agricultural advice from space
In the past, farmers had to walk thought their fields to assess crop health and rely on evidence before their eyes.
Now cameras on the ground, on drones or carried by satellite can collect images across different regions of the spectrum that can provide information about plants, soil and irrigation.
They can detect mineral deficiencies, disease and areas in need of water – this means that irrigation, application of fertiliser and pest control can be used where needed, rather than wastefully across whole crops.
An example of remote sensing is to compare the reflection of red light and near infra-red (the normalised difference vegetation index, NDVI).
As summarised below, there are differences between healthy and drought-stressed plants.

Table 1
This video from the NASA PACE mission shows satellite images of large areas of land globally and the significance of the changes that they can show.
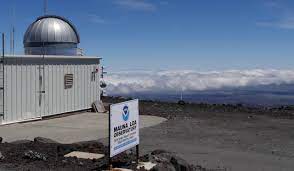
The image below from NOAA shows near infra-red satellite data for the UK July 1st 2025 – a period of drought, as indicated by the red colouring. Satellite images like these at field scale can give early indication of when crops are short of water so that irrigation can be targeted. Drone images can give even more detailed images of water depletion and so this technology can lead to less waste of water in the irrigation process.

Image 5
Why does this matter? Your students might suggest reasons like those below, or maybe add to them!
Vegetation reduces solar heating and plays an important role on a regional scale in climate; one of the reasons for this is their scattering of the Sun’s near infra-red – where landscapes have fewer plants, especially if surfaces are dark, then solar radiation is absorbed and mean temperatures are raised.
Satellite and drone images of plant health help farmers be more efficient in their use of land, water, fertiliser and pesticides – matching potential crops to fields, reducing waste and run off, as well as having a better indication of potential harvests.
Globally satellites help to monitor crops and land use, as well as monitoring soil quality, and have a huge role to play in achieving UN Sustainable Development Goal 2. They predict not just the health of crops, but also the need for transport from areas of plentiful harvest to those of shortage.
Plants have a cooling effect on their surroundings, the greener a city, the more temperate it can be in the face of climate change, because of the cooling effects vegetation offers and its significant role in the water cycle.
The role of vegetation in climate was first recognised by Alexander Von Humboldt in 1807: human clearance of South American forests was followed by flash flooding and drought.
The opportunities for better land management in the face of climate change means that many careers of the present and future will be around greening our urban spaces, and climate wise agriculture.

Fig 11

Fig 12
Careers inspiration for your students from this? Pass this on
RMetS Careers for Climate Guide
Chartered Institute of Ecology and Environmental Management: Careers
National Careers Service: green career advice
Sustain: Careers in sustainable food and farming
Royal Horticultural Society: Careers in horticulture
Landscape Architect career profile (Prospects)
Sources and copyright of images:
Fig 1: https://en.wikipedia.org/wiki/Photosynthesis#/media/File:Photosynthesis_en.svg CC BY-SA 4.0, Wattcle, Nefronus
Fig 2: https://commons.wikimedia.org/wiki/File:Photosynthesis_equation.svg, public domain
Fig 3, 6-9 : Melissa Lord
Fig 4: By Ali Zifan – Own work; Used information from: Campbell Biology (10th Edition) by: Jane B. Reece & Steven A. Wasserman.and [1]., https://commons.wikimedia.org/w/index.php?curid=50023738 CC BY-SA 4.0
Fig 5: NASA Science
Fig 10: NASA Science Jeff Carns science.nasa.gov/ems/08_nearinfraredwaves/
Figs11 & 12 : UN Sustainable Development Goal https://globalgoals.org/resources/
Images 1, 2, 4 : Melissa Lord
Image 3 : Rob Burnage


