In Depth – The Water Cycle

The water cycle

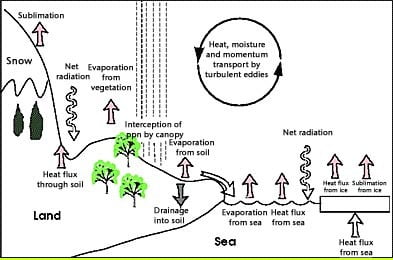
The water cycle, also known as the hydrological cycle, is the process by which water travels from the Earth’s surface to the atmosphere and then back to the ground again. The sun provides the energy for a continuous exchange of moisture between the oceans, the land and the atmosphere.

The Earth’s water

Nearly all (about 97%) of the Earth’s water is contained in the oceans. A smaller amount is locked away as ice sheets and glaciers. This leaves a very small amount which travels around in our water cycle, although it may not always seem this way on wet days.

Water enters the atmosphere as water vapour through evaporation, transpiration and sublimation. Water vapour high in the atmosphere forms into clouds through condensation. Water eventually returns to earth through precipitation as rain, snow, sleet and hail. When precipitation occurs over land, some water seeps into the ground as groundwater, a small amount is taken up by plants and animals, and the rest will return to rivers and streams as surface run-off to begin its journey back to the oceans.

Underwater scene

The processes:

Surface runoff
Surface runoff is the precipitation that falls on land and flows downhill towards stream channels which join rivers and eventually reach the oceans. Only about one third of precipitation falling on land will return to rivers and oceans. The rest will be soaked into the soil as groundwater, evaporated or transpired.

Groundwater
Some of the water from precipitation will soak into the soil and rocks as groundwater. A varying proportion of groundwater stays in the shallow soil layer, and will move slowly towards streams and rivers. When groundwater soaks deeper into the soil it refills the underground aquifers, where it can stay for long periods of time or be used by humans through drilling wells into aquifers.

Aquifer
An aquifer is a layer of water soaked sand, soil, stone, silt or clay underground. Aquifers act as huge underground water storage systems which people all over the world rely on for fresh water.

Reversible change of state
A change that can be undone or reversed. Energy is required for a material to change state and whilst it may change in appearance, it will still remain the same material. Melting, freezing, boiling, evaporating and condensing are always reversible changes and can be reversed by heating or cooling.

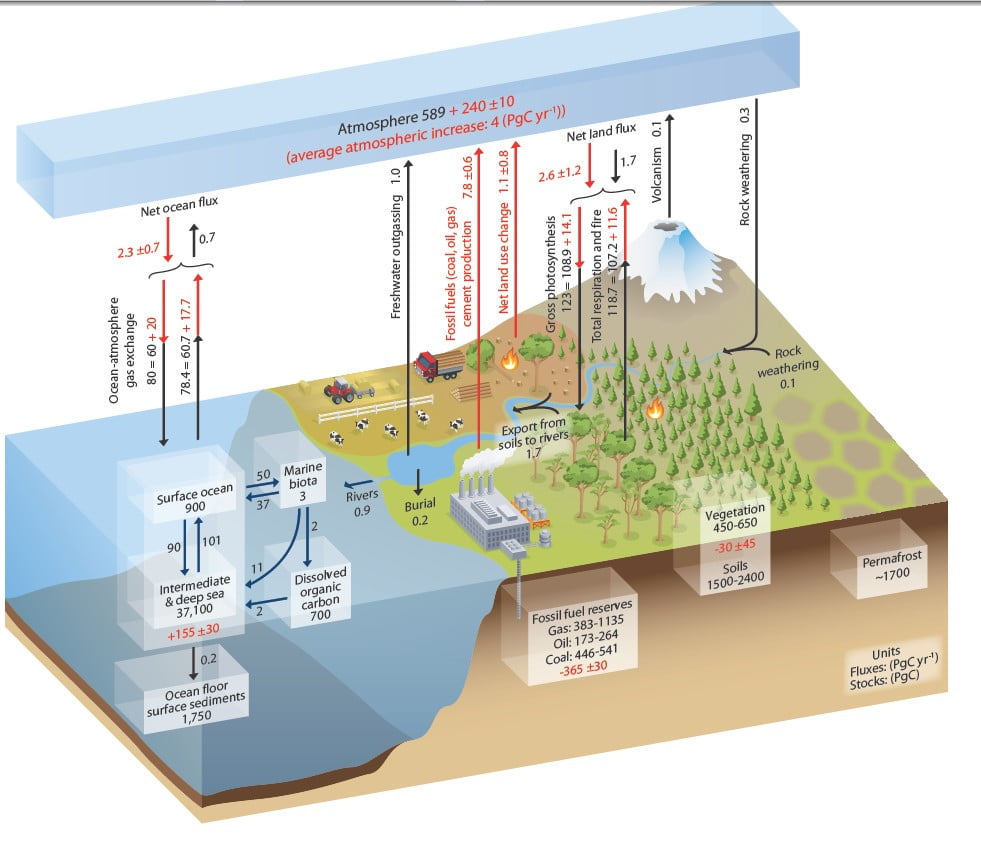
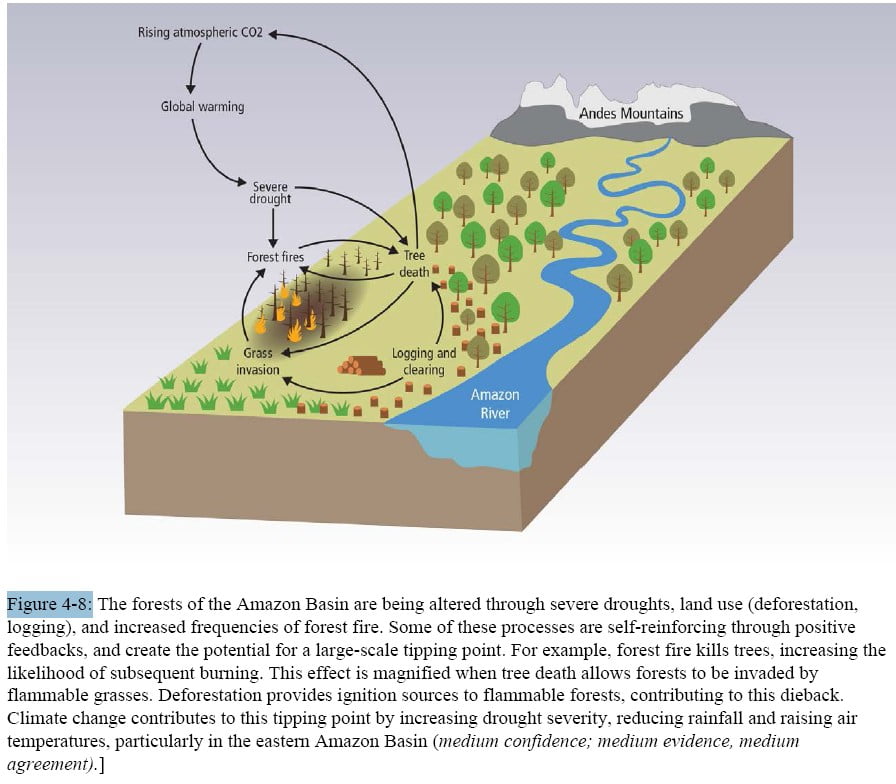
Deforestation, the water cycle and the carbon cycle in the Amazon.

Web page reproduced with the kind permission of the Met Office

In Depth – The Coriolis Effect

Coriolis Effect

As air blows from high to low pressure in the atmosphere, the Coriolis force diverts the air so that it follows the pressure contours. In the Northern Hemisphere, this means that air is blown around low pressure in an anticlockwise direction and around high pressure in a clockwise direction.

Think about a person standing at the Equator. In the course of a day, the planet rotates once, meaning that you travel a colossal 2π x R (the radius of the Earth – 6370km) = 40,000km through space – a speed of about 1700km/ hr. You don’t notice that you are travelling so fast, because the air around you is travelling at the same speed, so there is no wind. On the other hand, if you are standing at a Pole, all you do in the course of a day is turn around on the spot, you have no speed through space and similarly the air around you is stationary.

Now, think about really fast moving, Tropical air which is being pulled towards the poles by a pressure gradient. As it travels polewards, it moves over ground which is rotating more slowly, and so it overtakes the ground, and looks like it is moving from west to east. Similarly, slow moving polar air will be left behind by the rotating Earth and look like it is moving from east to west if it is pulled equatorward by a pressure difference.

In general, moving air in the Northern hemisphere is deflected to the right by the Coriolis Effect.

As the air blows from high to low pressure the Coriolis force acts on it, diverting it, and we end up with air following the pressure contours and blowing around low pressure in an anticlockwise direction and around high pressure in a clockwise direction (both true only for the Northern Hemisphere).

REPRESENTATION OF FLOW AROUND A LOW PRESSURE AREA.
FIGURE 1:SCHEMATIC REPRESENTATION OF FLOW AROUND A LOW PRESSURE AREA. PRESSURE GRADIENT FORCE REPRESENTED BY BLUE ARROWS. THE CORIOLIS FORCE, ALWAYS PERPENDICULAR TO THE VELOCITY, BY RED ARROWS. © SVG VERSION, ROLAND GEIDER (OGRE), OF THE ORIGINAL PNG, (CLEONTUNI)

In this diagram, the black arrows show the direction the air is moving in. The Coriolis force pulls the air to the right (red arrows). As the air is being pulled in to the depression by the pressure gradient (blue arrows), it is continuously deflected by the Coriolis Force. When the air moves in a circle around the depression, the Coriolis force (red arrows) is balanced by the pressure gradient force (blue arrows).

In summary, for the Northern Hemisphere:

  • Low pressure is called a cyclone and has anticlockwise winds blowing around it.
  • High pressure is called an anticyclone and has clockwise winds blowing around it.
  • The wind tends to blow along the pressure contours.
  • We name winds by the direction they are blowing from.
  • Buys Ballot’s Law states that “In the Northern Hemisphere, if you stand with your back to the wind then the lower pressure will be on your left”
  • Alternatively, some people find the rule ‘righty tighty, lefty loosey’ a useful reminder of the direction of rotation – high pressure is like tightening a screw (righty tighty) and low pressure like loosening a screw (lefty loosey) (Figure 2).

Figure 2: Air blows around a low pressure in an anticlockwise direction and around a high pressure in a clockwise direction in the Northern Hemisphere © RMetS

What about the Southern Hemisphere?

In the Southern Hemisphere, winds blow around a high pressure in an anticlockwise direction and around a low pressure in a clockwise direction.

The simplest way of visualising why this is the case is to take a ball (or an apple or orange, or anything spherical!). Mark on the poles and the equator, and then mark a spot in the ‘northern hemisphere’ and the ‘southern hemisphere’ of your sphere. Rotate your sphere. Keeping it rotating, tilt your sphere so that you are looking at it from the North Pole – your Northern Hemisphere spot should be going round in an anticlockwise direction. Now, making sure you keep rotating your sphere in the same direction, tilt it so that you are looking at the ‘south pole’. Your southern hemisphere spot should be rotating in a clockwise direction. This demonstration doesn’t explain the Coriolis effect, but it does show how things can be seen differently in the two hemispheres of the same planet.

Data and Image Sources

For an example of wind blowing along pressure contours, see the BBC website.

Useful Links:

In Depth – Extreme Weather

Flooding

Flooding is caused by:

  • a large amount of persistent rain
  • rapid thawing of snow
  • a storm surge
  • a combination of high tides and high river levels

Storm surges
Storm surges are caused by strong winds and low air pressure. When pressure decreases by one millibar, sea level rises by one centimetre. A deep depression, with a central pressure of about 960 mb, causes the sea level to rise half a metre above the level it would have been had pressure been about average (1013 mb). When pressure is above average, sea level correspondingly falls.

Storm surges create large waves. The highest waves wash away protective dunes, batter sea walls and break over coastal defences causing flooding.

The greatest surge on record for the North Sea as a whole occurred on 31 January and 1 February 1953.

Click here to view the floods case study

Tropical cyclones

A tropical cyclone is a low pressure system over tropical or sub-tropical waters, with convection (i.e. thunderstorm activity) and winds at low levels, circulating either anti-clockwise (in the northern hemisphere) or clockwise (in the southern hemisphere). The terms hurricane and typhoon are regionally-specific names for a strong tropical cyclone.


Thunderstorms

Most thunderstorms are associated with towering clouds known as cumulonimbus. The right conditions for the formation of a thunderstorm are unstable air and a mechanism for causing air to rise.

While air is rising it is said to be unstable. This instability is the result of a rapid fall of temperature with height, as well as a considerable amount of moisture in the air. This process may because by a warm surface; the air near the surface being forced to rise over higher ground or instability within a weather front.

E.g. on a summer’s day, the land is warmed by the sun, and as the air just above becomes warmer it starts to rise. As it rises it cools, and, if cooled sufficiently, cumulus clouds form at the condensation level. These small, white puffy clouds grow larger and larger as the temperature of the ground increases, causing more warm air to rise. After a time, the top of the cloud turns to ice (usually below a temperature of -20 °C) and streams away in the winds at the level of the cloud top, giving it a characteristic anvil shape.

Lightning
Lightning is a large electrical spark caused by electrons moving from one place to another. Electrons cannot be seen, but when they are moving extremely fast, the air around them glows, causing the lightning flash. The actual streak of lightning is the path the electrons follow when they move.

An atom consists of three basic parts, a proton (which has a positive charge), a neutron (which has no charge) and an electron (which has a negative charge). Electrons cling to the positively charged centre of the atom because they have a negative electrical charge. During a thunderstorm, some of the atoms in the cloud lose electrons while others gain them.

When a cloud is composed entirely of water droplets, there is very little transfer of electrons. As a storm cloud grows in height, the water droplets higher up become cooler. They continue in the liquid state below 0 °C as super-cooled water, but eventually they begin to turn to ice, usually at a temperature below -20 °C. These ice particles often collide. When they do, smaller particles lose an electron to the larger, thereby gaining a positive charge.

The small particles are propelled towards the top of the cloud by strong internal winds, while the larger particles start to fall. This causes the top of the cloud to develop a strong positive charge.

The larger, negatively charged, ice particles begin to ‘capture’ super-cooled water droplets, turning them instantly to ice and growing, some reaching a sufficient size to start falling.

This leads to the base of the cloud becoming negatively charged which, in turn, induces a positive charge on the ground below. In time, the potential gradient between cloud and ground, or between adjacent clouds, becomes large enough to overcome the resistance of the air and there is a massive, very rapid transfer of electrons, which appears as a lightning flash.

Lightning

lightening show

Thunder
The word thunder is derived from ‘Thor’, the Norse god of thunder. He was supposed to be a red-bearded man of tremendous strength; his greatest attribute being the ability to forge thunderbolts. The word Thursday is also derived from his name.

Thunder is the sharp or rumbling sound that accompanies lightning. It is caused by the intense heating and expansion of the air along the path of the lightning. The rumble of thunder is caused by the noise passing through layers of the atmosphere at different temperatures. Thunder lasts longer than lightning because of the time it takes for the sound to travel from different parts of the flash.

You can roughly estimate how far away a thunderstorm is by measuring the interval between the lightning flash and the start of the thunder. If you count the time in seconds and then divide by three, you will have the approximate distance in kilometres. Thunder is rarely heard at a distance of more than 20 km.

Drought

Drought occurs when there is a lack of rainfall over a long period of time, resulting in water shortages for groups of people, activities or the environment. Droughts have a significant impact on agriculture and can harm the economy.

Causes of lack of rain

  • Water vapour needs to rise high through the atmosphere in order to condense and bring about rain. However, in areas of high pressure, with the air subsides, water vapour does not rise and no rain or clouds will form. When the high pressure stays in an area for a prolonged length of time the result is drought.
  • Mountains effect the movement of air too. Air carrying water vapour will rise higher in order to pass over to the windward side of a mountain. As the air rises it cools causing water vapour to condense bringing about precipitation and when reaching the other side of the mountain it has lost most of its water vapour. The leeward side of a mountain is warmer and drier and in some cases a desert.

dry earth

Web page reproduced with the kind permission of the Met Office

In Depth – Carbon

Carbon (chemical element C) is one of the most abundant elements in the universe.

All known life forms are carbon-based and it amounts to about 18% of a human body.

Carbon dioxide (CO2) and methane (CH4) make up about 0.04% of our atmosphere by volume.

However, alongside water vapour, nitrous oxide and ozone (collectively called greenhouse gases) they help to keep our planet warm.

In fact, without these gases, the Earth’s surface would be about 18 °C below zero – far too cold for nearly all life to survive. Greenhouse gases occur naturally, but human activities have directly increased the amount of carbon dioxide, methane and some other gases in our atmosphere. There is overwhelming evidence that this has enhanced the natural greenhouse effect, contributing to the warming we have seen over the last century or so. For more information on this visit our in depth climate section

When studying our climate, scientists draw their evidence from many sources. It is important that they look at all the processes that influence our climate, and one of the most important is the carbon cycle.


Web page reproduced with the kind permission of the Met Office

IPCC 2013 Figures

Some Figures and Tables from the IPCC 2013 Fifth Assessment Report

WG1 – The Physical Science Basis

Copyright for all figures:

IPCC, 2013: Climate Change 2013: The Physical Science Basis. Working Group I Contribution to the Fifth Assessment Report of the Intergovernmental Panel on Climate Change, Cambridge University Press, Cambridge, United Kingdom and New York, NY, USA.

WG2- Impacts, Adaptation and Vulnerability

Copyright for all figures:

IPCC, 2014: Climate Change 2014: Impacts, Adaptation, and Vulnerability. Working Group II Contribution to the Fifth Assessment Report of the Intergovernmental Panel on Climate Change, Cambridge University Press, Cambridge, United Kingdom and New York, NY, USA.

WG3 – Mitigation of Climate Change

Copyright for all figures:

IPCC, 2014: Climate Change 2014: Mitigation of Climate Change. Working Group III Contribution to the Fifth Assessment Report of the Intergovernmental Panel on Climate Change, Cambridge University Press, Cambridge, United Kingdom and New York, NY, USA.

Climate Change Schools’ Project Resources

craft modelThe Climate Change Schools Resources were developed by the Climate Change Schools Project, based at the then Science Learning Centre in Durham and led by Krista McKinzey. A large number of teachers and schools in North East England were involved in their development.

They have subsequently been updated by the Royal Meteorological Society.


Climate Change Teaching Resources for Schools

Resources for KS2/ upper primary

Resources for KS3 (some can also be used at KS4/ GCSE)

Resources for A level/ more advanced students and teacher CPD


Climate Literate person;

  • Understands the essential principles of Earth’s climate system and knows how to assess scientifically credible information about climate,
  • Communicates about climate and climate change in a meaningful way,
  • Can make informed and responsible decisions with regard to actions that may affect climate.

Climate Change Resources

Summary of Weather and Climate links in the KS3 2014 National Curriculum (England).

   Curriculum LinksOther useful resources
Module 1 – Climate Change Nuts and BoltsScheme of WorkGreenhouse GasesGeography, ChemistryClimate Change Resources
 RSC resourcesBackground info for teachersGeographyClimate, Climate Change and Climate Engineering
  Scheme of Work  
  Leaves as Thermometers  
  Sediment Core Image  
  Sediment Core Key  
  Tree Ring Images  
  Teacher Information Sheet – Ozone  
  Ozone Layer Questions  
Module 2 – Do not believe the hype .. or Should IScheme of Work Geography, Chemistry 
 Student Challenge Sheet   
 Persuasive Presentation – Climate Change  Climate Change Negotiations Resource
 Climate Change ScepticismTeachers’ GuideGeography, Chemistry, Combined Science 
  Debate Card 1  
  Debate Card 2  
  Climate Change Scepticism PowerPoint  
Module 3 – Climate Change all around me (Indicators)Scheme of Work Peer AssessmentGeography,  ChemistryClimate Change in the UK
Module 4 – so what (Impacts)Scheme of Work   
 Afsana MysteryInstructions  
  PowerPoint  
  Cards  
  Criteria levels  
 Day After TomorrowFact or Fiction  
  Answer Sheet  
 De BonoDe Bono Hats  
  Group Summary  
 Global DimensionScheme of WorkFrench 
  Climate Change global dimension – staff  
 Global Dimension – FloodingScheme of Work Geography 
  Session 1 – Flooding  
  Session 2 – Flooding  
  Session 3 – flooding and biodiversity  
  Session 4 – Doctor’s report  
  Session 4 – Flooding and Disease  
  Session 5 – flood prepare & prevention  
  Session 6 – Flooding Council  
 MigrationMemory Map  
  Card sort  
 Polar BearPowerPoint  
  Agony Aunt template  
 Impacts PowerPoint   
Module 5 – Climate Change Champions (Mitigation)Scheme of Work   
 Carbon Neutral HouseInstructions  
  Ideas Template  
  Sheet A  
  Sheet B  
  Sheet C  
  Sheet D  
   Sheet E  
  Sheet F  
 Recycling Food MilesFood Miles Factoids  
  Food Miles Factoids as pdf  
  Food Miles Articles  
  Recycling Factoids  
  Recycling Factoids as pdf  
 Sustainable LivingChallenge Point Scores Sheet Summary  
  Challenge 1 – compost  
  Challenge 1 – organic  
  Challenge 1 – food table  
  Challenge 2 – kite  
  Challenge 3 – word search  
  Challenge 5 – community classroom  
  Challenge 6  
  Challenge 7  
  Footprints  
  People Points  
  Planet Poster  
  Student Diary Challenge  
Module 6 – Making the most of it (Adaptation)Scheme of Work   
 What is Climate Change Adaptation   
 What is the Adaptation Challenge    
 Why is Climate Change Adaptation Important?   
 Peer Assessment   
 Student Challenge Sheet   
TreesScheme of Work Biology (plant reproduction, photosynthesis), Chemistry (carbon cycle) 
 How a Tree Works Scheme of WorkModel comments  
  Peer Assessment  
 Why are Trees Important Scheme of WorkExtended Teacher Notes  
  Sustainable Forest Management Questionnaire  

General Resources

Diamond Ranking sheet

Acknowledgements

The Climate Change Schools Resources were developed by the Climate Change Schools Project, based at the then Science Learning Centre in Durham and led by Krista McKinzey. A large number of teachers and schools in North East England were involved in their development.

They have subsequently been updated by the Royal Meteorological Society.

Climate Change Resources

Some introductory PowerPoint presentations suitable for more advanced students, teacher CPD etc.:

Atmospheric Structure

Atmospheric Composition

Solar Radiation

Climate Feedback Mechanisms

Ozone Depletion

The Climate Change Schools Resources were developed by the Climate Change Schools Project, based at the then Science Learning Centre in Durham and led by Krista McKinzey. A large number of teachers and schools in North East England were involved in their development.


They have subsequently been updated by the Royal Meteorological Society.

Climate Change Teaching Resources

Secondary geography resources based on the 2021/ 2022 IPCC report

Climate negotiations resource for KS3/ 4 geography.

Resources to teach the climate of the last 2.6 million years.

Using Tree Rings to teach past climate change.

Past and future global and UK climate change resources from Weather and Climate: a Teacher’s Guide

A summary of the IPCC’s 1.5 Degree climate change report.

A climate change concept cartoon, produced in conjunction with Millgate House.

In Depth Climate and Climate Change information from the Met Office .

In Depth Carbon information from the Met Office.

Climate Change Schools Project Resources.

Climate change updates from the 2013/ 2014 IPCC report for geography teachers and science teachers with selected FAQs and downloadable figures.

Climate change updates from the 2013/ 2014 IPCC report for A level geography

Climate change Scheme of Work for year 8 geography, originally developed by Charlotte Woolliscroft at Lawrence Sheriff School:

Climate change teaching resources for GCSE science.

Climate/ climate change teaching resources for Scottish Curriculum for Excellence level 3/ KS3.

MetLink - Royal Meteorological Society
We use cookies on this site to enhance your user experienceBy clicking any link on this page you are giving your consent for us to set cookies. More info

By clicking any link on this page you are giving your consent for us to set cookies. More info