Weather Systems Video

Weather Systems Teachers’ Notes

Teachers’ notes to accompany Weather Systems

Teaching objectives/Learning outcomes

By the end of the lesson, pupils will know and understand:

  • the characteristics of depressions and fronts and the sequence of associated weather
  • the characteristics of anticyclones and the contrast between those in summer and in winter.

Resources required

Computers with internet access would be desirable. Alternatively if internet access is not available, printed copies of student sheets and worksheets should be made.

Prior knowledge required

A basic background of weather and climate.

The information on the student sheets can be delivered by the teacher and activities completed individually. Alternatively students can work through the whole lesson themselves.

Part A – Anticyclones and Depressions

Part B – Fronts

Part C – Life cycle of a depression

Part D – Depression cross-section and weather sequence

Exercises

Five worksheets with exercises are provided to consolidate learning.

Suggestions for home work

Any of the worksheet activities can be completed.

Reproduced with the kind permission of the Met Office

Weather Systems

Anticyclones, Depressions and Fronts

By the end of the lesson, you will be able to:

  • Understand the characteristics of depressions and fronts and the sequence of associated weather
  • Understand the characteristics of anticyclones and the contrast between those in summer and in winter. 

Part A – Anticyclones and Depressions

Part B – Fronts

Part C – Life cycle of a Depression

Part D – Depression cross-section and weather sequence

Teachers’ notes

fronts diagram

Part A


Anticyclones, Depressions and Fronts

Part A – Anticyclones and Depressions

High pressure systems

A high pressure system, also known as an anticyclone occurs when the weather is dominated by stable conditions. Under an anticyclone air is descending, forming an area of higher pressure at the surface. Because of these stable conditions, cloud formation is inhibited, so the weather is usually settled with only small amounts of cloud cover. In the Northern Hemisphere winds blow in a clockwise direction around an anticyclone. As isobars are normally widely spaced around an anticyclone, winds are often quite light.

Anticyclones can be identified on weather charts as an often large area of widely spaced isobars, where pressure is higher than surrounding areas.

Winter anticyclones

In winter the clear, settled conditions and light winds associated with anticyclones can lead to frost and fog. The clear skies allow heat to be lost from the surface of the earth by radiation, allowing temperatures to fall steadily overnight, leading to air or ground frosts. Light winds along with falling temperatures can encourage fog to form; this can linger well into the following morning and be slow to clear. If high pressure becomes established over Northern Europe during winter this can bring a spell of cold easterly winds to the UK.

Summer anticyclones

In summer the clear settled conditions associated with anticyclones can bring long sunny days and warm temperatures. The weather is normally dry, although occasionally, very hot temperatures can trigger thunderstorms. An anticyclone situated over the UK or near continent usually brings warm, fine weather.

Low pressure systems

A low pressure system, also known as a depression occurs when the weather is dominated by unstable conditions. Under a depression air is rising, forming an area of low pressure at the surface. This rising air cools and condenses and helps encourage cloud formation, so the weather is often cloudy and wet. In the Northern Hemisphere winds blow in anticlockwise direction around a depression. Isobars are normally closely spaced around a depressions leading to strong winds.

Depressions can be identified on weather charts as an area of closely spaced isobars, often in a roughly circular shape, where pressure is lower than surrounding areas. They are often accompanied by fronts.

What to do next

Using this information on pressure systems you should now be able to complete worksheet 1.

Then you can complete Extension 1 or worksheet 2.

Part B


Anticyclones, Depressions and Fronts

Part B – Fronts

A front is a boundary between two different types of air masses, these are normally warm moist air masses from the tropics and cooler drier air masses from polar regions. Fronts move with the wind so over the UK they normally move from west to east. The notes below provide information about the most common types of fronts. The descriptions given apply to active well developed fronts, weaker fronts may not display all the characteristics or they may be less well defined.

Warm fronts

A warm front indicates that warm air is advancing and rising up over the colder air. This is because the warm air is ‘lighter’ or less dense, than the cold air. Therefore warm fronts occur where warmer air is replacing cooler air at the surface. As the warm front approaches there is a gradual deterioration in the weather. Clouds gradually lower from higher cirrus, through altostratus, to stratus and nimbostratus at the front. There is often a prolonged spell of rainfall which is often heavy. Behind the warm front the rain becomes lighter, turns to drizzle or ceases, but it remains cloudy. Temperatures rise behind the warm front and winds turn clockwise, also known as a wind ‘veer’. Pressure falls steadily ahead of and during the passage of the warm front, but then rises slowly after its passage.

The diagram below shows the formation of a warm front in diagrammatic form.

high pressure diagram

The diagram below shows a cross section through a warm front, with associated cloud, temperature and weather changes.

low pressure diagram

Cold fronts

A cold front indicates that cold air is advancing and pushing underneath warmer air at the surface. This occurs because the cold air is ‘heavier’ or denser than the warm air. Therefore cold fronts occur where cooler air is replacing warmer air at the surface. The passage of weather associated with a cold front is much shorter lived than that with a warm front. As there is often a lot of cloud in the warmer air ahead of the cold front, there is often little indication of the approaching cold front. As the front passes temperatures fall and there is often a short spell of very heavy rain, sometimes with inbedded thunderstorms and cumulonimbus clouds. Behind the front the weather is much brighter with broken clouds but occasional showers. Winds veer with the passage of the cold front and are often strong and gusty, especially near showers. Pressure rises throughout the approach and passage of the cold front.

The diagram below shows the formation of a cold front in diagrammatic form.

isobaric through

The diagram below shows a cross section through a cold front, with associated cloud, temperature and weather changes.

ridge

Occlusions

In a mature depression the warm front normally precedes the cold front. Cold fronts generally travel much quicker than warm fronts, and eventually it will catch up with the warm front. Where the two fronts meet, warm air is lifted from the surface and an occlusion is formed. An occlusion can be thought of as having similar characteristics to both warm and cold fronts. The weather ahead of an occlusion is similar to that ahead of a warm front, whilst the weather behind is similar to that behind a cold front.

The diagrams below depict the formation of an occlusion.

diagrams below depict the formation of an occlusion.

The diagram below shows the occlusion in cross section.

The diagram below shows the occlusion in cross section.

What to do next

Now you can go on to Part C – Life cycle of a Depression.

Anticyclones, Depressions and Fronts

Part C – Life cycle of a Depression

A Norwegian scientist called Vilhelm Bjerknes devised a simple model which described how depressions developed from the meeting of warm and cold air. The model had four stages which are detailed below.

Origin and infancy

Initially a warm air mass such as one from the tropics, meets a cooler air mass, such as one from the polar regions. Depressions which affect the UK normally originate over the Atlantic Ocean. map of UK Maturity The warm air rises up over the colder air which is sinking. A warm sector develops between the warm and cold fronts. The mature stage of a depression often occurs over the UK. air temp

Occlusion

The cold front travels at around 40 to 50 miles per hour, compared to the warm front which travels at only 20 to 30 miles per hour. Therefore the cold front eventually catches up with the warm front. When this occurs an occlusion is formed. Occlusion chart

Death

Eventually the frontal system dies as all the warm air has been pushed up from the surface and all that remains is cold air. The occlusion dies out as temperatures are similar on both sides. This stage normally occurs over Europe or Scandinavia. What to do next Now you can go on to Part D – Depression cross-section and weather sequence.

Anticyclones, Depressions and Fronts

Part D – Depression cross-section and weather sequence

Cross-section through a classic Depression

Most depressions have a warm and cold front, more mature depressions may also have an occluded front. The diagram below shows a cross-section through a depression, showing the warm and cold fronts and an indication of the associated weather.

cross section through a depression

WEATHER ASSOCIATED WITH THE PASSAGE OF A CLASSIC DEPRESSION
 Ahead of the warm frontPassage of the warm frontWarm sectorPassage of the cold frontCold sector
Pressure
starts to fall steadilycontinues to fallsteadiesstarts to risecontinues to rise
Temperature
quite cold, starts to risecontinues to risequite mildsudden dropremains cold
Cloud cover
cloud base drops and thickens (cirrus and altostratus)cloud base is low and thick (nimbostratus)cloud may thin and breakclouds thicken (sometimes with large cumulonimbus)clouds thin with some cumulus
Wind speed and direction
speeds increase and direction backsveers and becomes blustery with strong gustsremain steady, backs slightlyspeeds increase, sometimes to gale force, sharp veerwinds are squally
Precipitation
none at first, rain closer to front, sometimes snow on leading edgecontinues, and sometimes heavy rainfallrain turns to drizzle or stopsheavy rain, sometimes with hail, thunder or sleetshowers

What to do next

Using this information on the passage of depressions you should now be able to complete worksheet 3, and worksheet 4.

Web page reproduced with the kind permission of the Met Office

Weather Charts

By the end of the lesson, you will be able to:

  • Understand isobars and their relationship with wind speed
  • Identify various pressure systems and fronts on a weather chart
  • Interpret and produce plotted weather symbols.

Part A – Isobars, pressure and wind

Part B – Identifying pressure systems and fronts

Part C – Plotted weather charts

Teachers’ notes

Teachers’ Notes

Resources required

Computers with Internet access would be desirable. Alternatively if Internet access is not available, printed copies of student sheets and worksheets should be made.

Prior knowledge required

A basic background of weather and climate.

Teaching activities

Students can visit the following pages to gain a basic background into the topics covered:

Weather charts

Interpreting Weather Maps

The information on the student sheets can be delivered by the teacher and activities completed individually. Alternatively students can work through the whole lesson themselves.

Exercises

Three worksheets with exercises are provided to consolidate learning.

A series of additional exercises are provided for more able students, or those who have already studied pressure systems and fronts in more detail prior to this lesson.

Suggestions for homework

Any of the worksheet activities can be completed. Alternatively students can collect weather charts from the Internet or a newspaper and repeat the exercises using these.


Part A – Isobars, pressure and wind

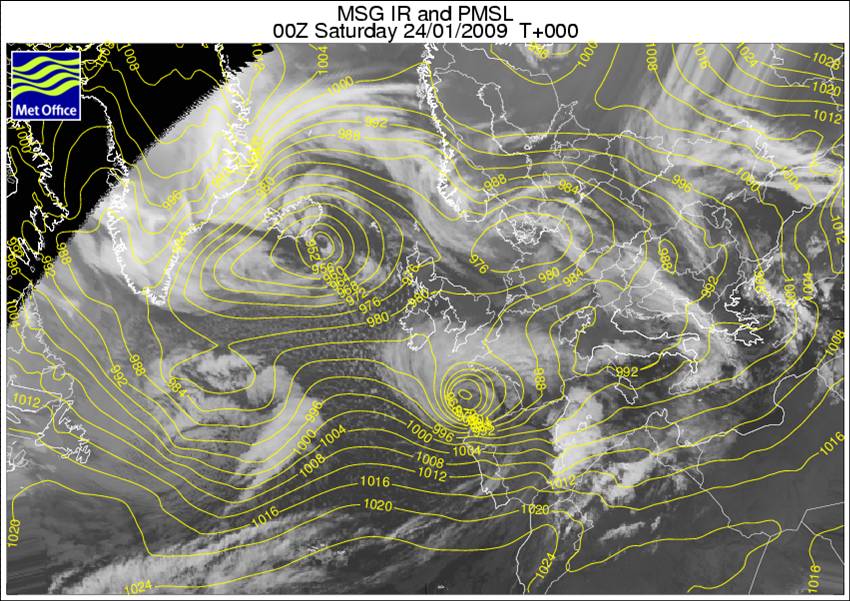
Isobars are lines joining points of equal pressure, similar to contours, which are shown on weather charts. Charts showing isobars are useful because they can help to identify anticyclones and depressions. Pressure is measured in millibars and isobars are normally drawn at intervals of 4 millibars. Pressure values are corrected to Mean Sea Level Pressure (MSLP) before being plotted on a map, this ensures that altitude does not affect the mapping.

Isobars are also helpful because the help us to understand the direction and strength of the wind in a particular area. Where isobars are very close together, for example near a depression, they indicate strong winds. Where the isobars are more widely spaced, near an anticyclone for example, they indicate light winds.

The wind will blow almost parallel to the isobars. Around an anticyclone the winds will blow slightly across the isobars, away from the centre of the anticyclone. In depressions, the wind will blow slightly across the isobars towards the centre of the low pressure.

Buys’ Ballot’s Law states that if you stand with you back to the wind in the northern Hemisphere, low pressure will be on your left. This means that you can work out the wind direction at different locations on a weather chart.

What to do next

Using this information on isobars you should now be able to complete worksheet 1.

Then you can complete extension exercise 1 or go on to Part B – Identifying pressure systems and fronts.

Part B – Identifying pressure systems and fronts

Anticyclones

An anticyclone, also known as a ‘high’ can be identified on a weather chart as an often large area of widely spaced isobars, where pressure is higher than surrounding areas. In the Northern Hemisphere winds blow in a clockwise direction around high pressure. The highest pressure occurs at the centre and is known as the ‘high pressure centre’. Anticyclones can bring warm and sunny weather in summer, but cold and foggy weather in winter.
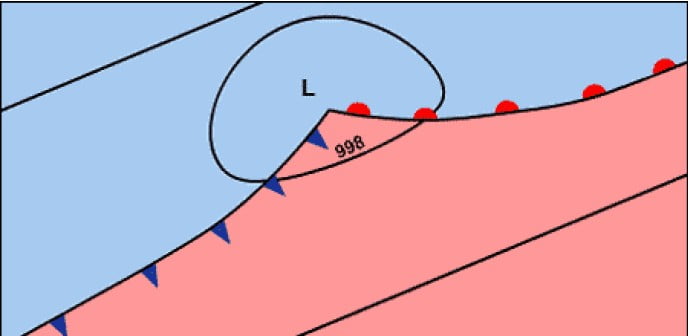
Depressions

A depression, also known as a ‘low’ can be recognised on a weather chart by an area of closely spaced isobars, often in a roughly circular shape, where pressure is lower than surrounding areas. They are often accompanied by fronts. In the Northern Hemisphere winds blow around depressions in an anticlockwise direction. The lowest pressure occurs at the middle of a depression, this is known as the ‘low pressure centre’. Depressions are often associated with strong winds and heavy rain and are nearly always accompanied by fronts.

depressions

Troughs

Troughs are elongated extensions of areas of low pressure. They bring similar weather to that associated with depressions.

Ridges

Ridges are elongated extensions of areas of high pressure. They bring similar weather to that associated with anticyclones.


Col

A col can be identified as an area of slack pressure between two anticyclones and two depressions.

The following diagram summarises the appearance on a weather chart of the main types of pressure systems.

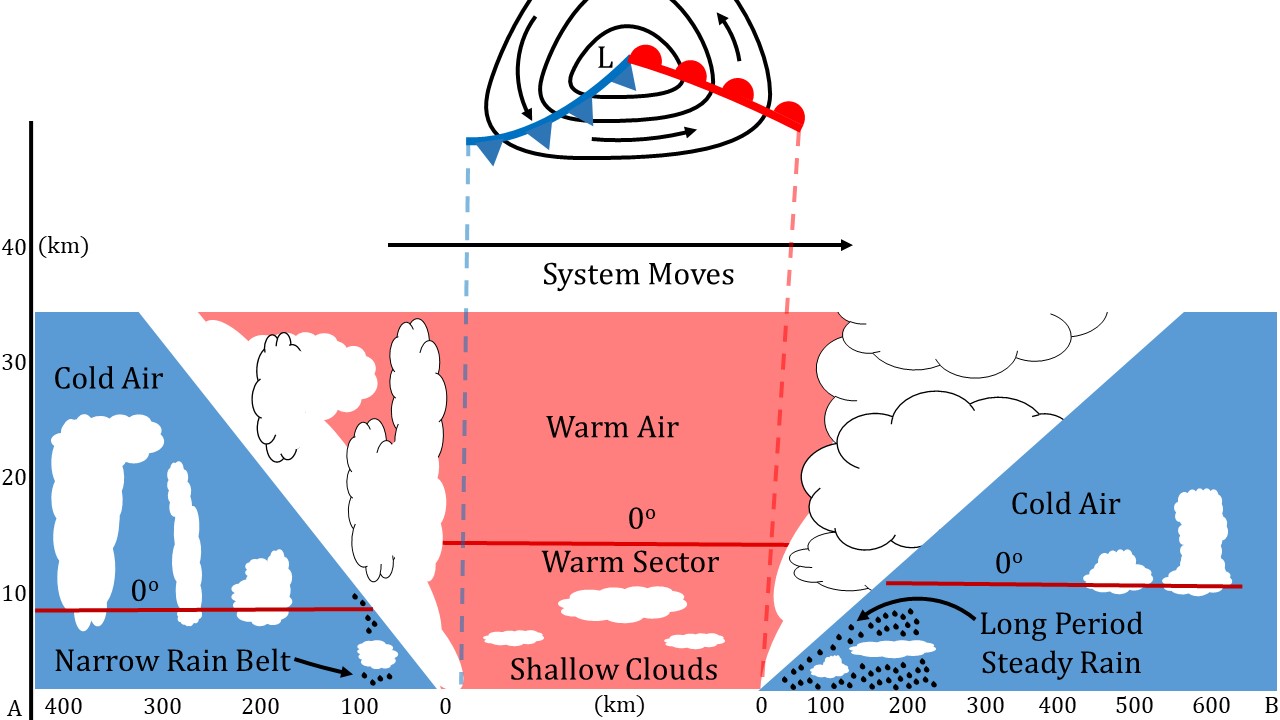
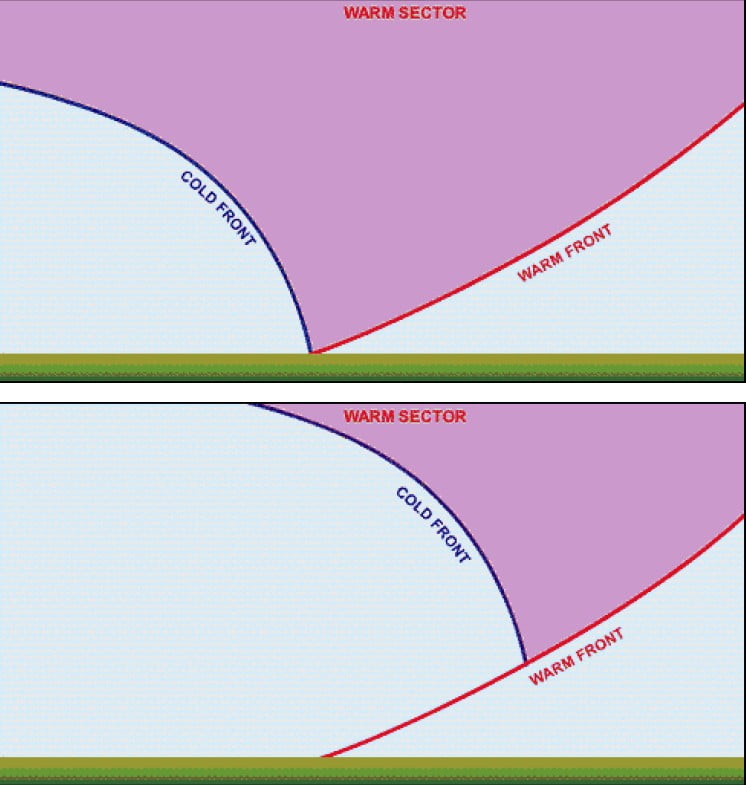
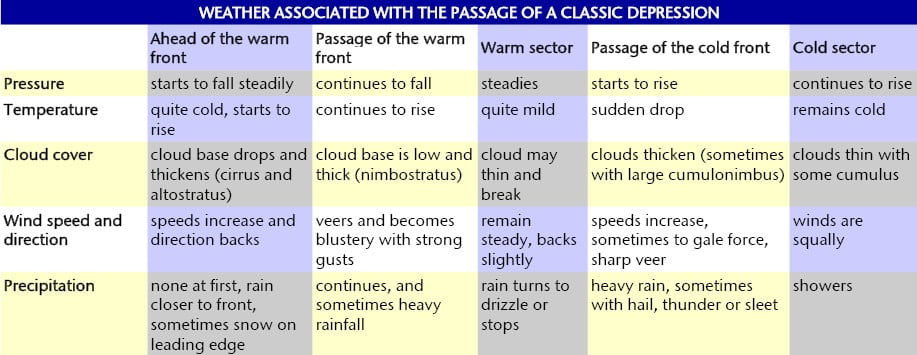
Cold fronts and warm fronts

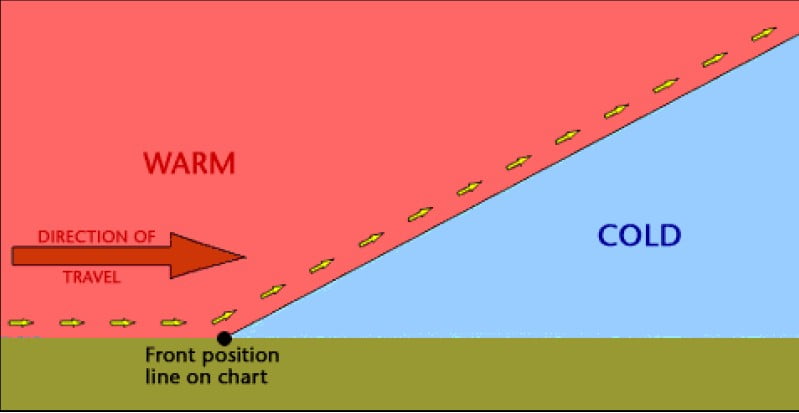
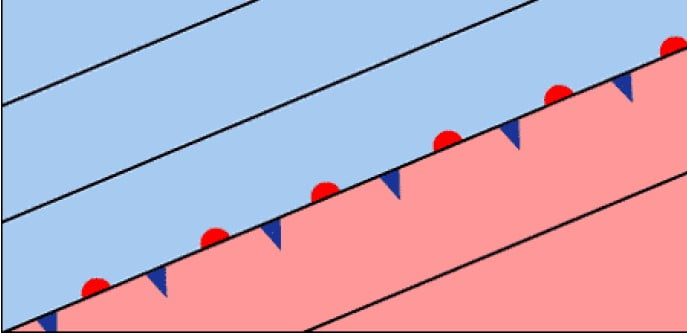
Cold fronts can be identified on weather charts as bold lines with triangles. These are blue when displayed on colour charts. The points of the triangle indicate the direction in which the front is moving. A cold front indicates a change in air mass, where warmer air is being replaced by colder air. They often bring short spells of heavy rainfall in the form of showers and squally winds, and are accompanied by a decrease in temperature, a veer in wind direction and a change to brighter showery conditions.

Warm fronts can be identified on weather charts as bold lines with semi-circles or humps. These are coloured red when displayed on colour charts. The direction of the humps indicates the direction in which the front is moving. A warm front indicates a change from a colder to a warmer air mass. They often bring spells of prolonged and sometimes heavy rainfall, with strong winds.
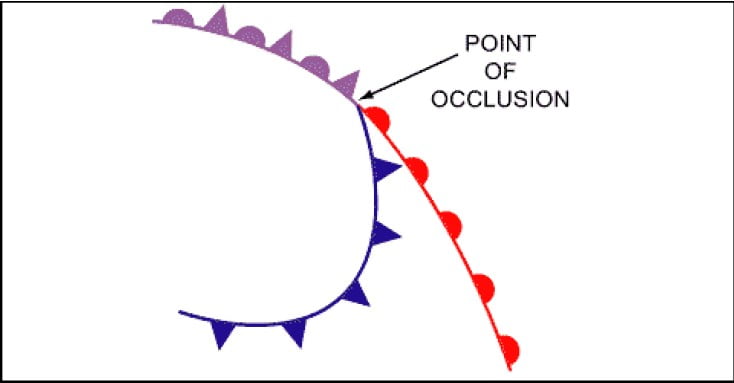
Occluded fronts

Occluded fronts can be identified on weather charts as bold lines with sets of triangles and semi-circles. These are coloured purple on coloured weather charts. The direction in which the symbols face indicates the direction in which the front is travelling. Occlusions are formed when the cold front overtakes the warm front, therefore they have similar characteristics to a cold front, but less intense.

Warm Sector

The warm sector of a depression is located behind the warm front and ahead of the cold front. It often brings mild temperatures but the weather can be overcast with drizzle.

What to do next

Using this information you should now be able to complete worksheet 2.

Then you can complete extension exercise 2 or go on to Part C.

 Part C – Plotted weather charts

The following image is an example of a UK plotted weather chart.

Plotted surface charts are made up of individual ‘station circles’. Each individual stations observation is put into graphical format so that it is simple to understand, can be put on a chart and be compared to its neighbours.

The diagram opposite shows the basic station circle, including temperature, pressure, weather, cloud cover, wind speed and direction. Some elements, e.g. weather and cloud cover, are put into a graphical code to make them more obvious. The Met Office uses a much more complex station circle but the one below is a simplified version using the main weather elements.

Wind direction is indicated by a line coming from the centre of the station circle. The line indicates the direction from which the wind is blowing.Wind speed and direction

On the end of the wind direction line are ‘feathers’, these indicate the wind speed. Half feathers represent 5 knots whilst whole feathers indicate 10 knots. A wind speed of 50 knots is indicated by a triangle. Combinations of these can be used to report wind speed to the nearest 5 knots.

The table below shows the symbols used to indicate different wind speeds.

Cloud cover

Cloud cover is indicated by the shading of the centre of the station circle. The table below shows the meanings of the different symbols.

Temperature

Temperature is plotted to the nearest degree and is located in the top left-hand corner of the station plot.

Pressure

Pressure is plotted in the top right-hand corner of the station plot.

Weather

In total the Met Office has 99 codes for recording the current weather at the time of the observation. However these can be simplified down. Different types of weather are represented using different weather symbols, a key to which can be found below.

What to do next

Using this information you should now be able to complete worksheet 3.

Then you can complete extension exercise 3 .

Worksheet 1 – Reading pressure values from a surface pressure chart

The image below is an extract from a surface pressure chart, on which isobars, fronts and pressure systems have already been drawn. Download a copy of the worksheet here. If working on a PC, print out a copy of this page. Then study the chart, and complete the table below, by entering the approximate pressure at each of the labelled locations.

Worksheet 2 – Surface chart analysis

The image below shows a surface pressure chart, on which isobars, fronts and pressure systems have already been drawn. Download a copy of the worksheet here. Then study the chart, and identify and label the following items:

Cold front Col
Warm front Trough
Occlusion High pressure centre
Trough of low pressure Low pressure centre
Ridge of High pressure Warm sector

If you need help refer back to Part B – Identifying pressure systems and fronts.

Worksheet 3 – Station circle plots

The following three questions contain examples of plotted station circles. Download a copy of the worksheet here. Then study each of these plots and complete the tables below with details of the temperature, weather, pressure, cloud cover, wind speed and wind direction.

The following three questions contain tables of weather data. Study each of these tables and plot the details of the temperature, weather, pressure, cloud cover, wind speed and wind direction on to the station circle provided.

If you need help refer back to Part C – Plotted weather charts.

Worksheet 1 – extension exercise

The following diagram shows a series of plotted pressure values. Download a copy of the worksheet here. Complete the diagram by drawing isobars at intervals of 4 millibars, including 992, 996, 1000, 1004 and 1008.


Worksheet 2 – extension exercise

Study the chart below. This chart is for mid-November. Download a copy of the worksheet here. Then using your knowledge of the characteristics of anticyclones, depressions and fronts in winter, complete the table below with approximate readings.

There is no one correct answer. Your values should simply indicate the typical values and the variations between each location. For example, should location A be warmer or colder than location B? Should location E have stronger or lighter winds than location D?


Worksheet 3 – extension exercise

Study the chart below. This chart is for mid November. Download a copy of the worksheet here. Then using your knowledge of the characteristics of anticyclones, depressions and fronts in winter, construct a station circle for each of the locations marked on the chart.

There is no one correct answer. You values should simply indicate the typical values and the variations between each location. For example should location A be warmer or colder than location B? Should E have stronger or lighter winds than location D?

If you have already completed extension exercise 2, you will simply need to convert your table of results into station circle plots.

Location A
Location B

 
Location C

 
Location D

 
Location E

 
Location F

 
Location G

 
Location H


Web page reproduced with the kind permission of the Met Office

Anticyclones, Depressions and Fronts

LESSON PLAN: Introduction to Anticyclones, Depressions and Fronts
Key Stage 4 – GCSE
Subject Geography


Length 1 lesson

Teaching Objectives/Learning Outcomes
By the end of the lesson, pupils will know and understand:
Characteristics of depressions and fronts and the sequence of associated weather
Characteristics of anticyclones and the contrast between those in summer and in winter.

Resources Required
None.

Prior Knowledge Required
A basic knowledge of weather and climate

Teaching Activities
The following web pages have related resources at a similar level:

Weather Systems

Student Charts

Weather Systems

Exercises
4 worksheets with exercises are provided to consolidate learning.
A series of extension exercises are provided for more able students, or those who have already studied the topics covered in more detail prior to this lesson.

Plenary – A quiz is available, which brings together all the topics covered. The can be used to examine whether the objectives of the lessons have been met.

Suggestions for Home Work
Any of the worksheet activities can be completed as homework.

PART A – ANTICYCLONES AND DEPRESSIONS

High Pressure Systems

A high pressure system, also known as an anticyclone occurs when the weather is dominated by stable conditions. Under an anticyclone air is descending, forming an area of higher pressure at the surface. Because of these stable conditions, cloud formation is inhibited, so the weather is usually settled with only small amounts of cloud cover. In the Northern Hemisphere winds blow in a clockwise direction around an anticyclone. As isobars are normally widely spaced around an anticyclone, winds are often quite light.
Anticyclones can be identified on weather charts as an often large area of widely spaced isobars, where pressure is higher than surrounding areas.

Winter Anticyclones

In winter the clear, settled conditions and light winds associated with anticyclones can lead to frost and fog. The clear skies allow heat to be lost from the surface of the earth by radiation, allowing temperatures to fall steadily overnight, leading to air or ground frosts. Light winds along with falling temperatures can encourage fog to form; this can linger well into the following morning and be slow to clear. If high pressure becomes established over Northern Europe during winter this can bring a spell of cold easterly winds to the UK.

Summer Anticyclones

In summer the clear settled conditions associated with anticyclones can bring long sunny days and warm temperatures. The weather is normally dry, although occasionally, very hot temperatures can trigger thunderstorms. An anticyclone situated over the UK or near continent usually brings warm, fine weather.

Low Pressure Systems

A low pressure system, also known as a depression occurs when the weather is dominated by unstable conditions. Under a depression air is rising, forming an area of low pressure at the surface. This rising air cools and condenses and helps encourage cloud formation, so the weather is often cloudy and wet. In the Northern Hemisphere winds blow in anticlockwise direction around a depression. Isobars are normally closely spaced around a depressions leading to strong winds.
Depressions can be identified on weather charts as an area of closely spaced isobars, often in a roughly circular shape, where pressure is lower than surrounding areas. They are often accompanied by fronts.

What to do next
Using this information on pressure systems you should now be able to complete worksheet 1. Then you can move on to extension exercise 1 or worksheet 2

  • PART B – FRONTS

A front is a boundary between two different types of air masses, these are normally warm moist air masses from the tropics and cooler drier air masses from polar regions. Fronts move with the wind so over the UK they normally move from west to east. The notes below provide information about the most common types of fronts. The descriptions given apply to active well developed fronts, weaker fronts may not display all the characteristics or they may be less well defined.

Warm Fronts

A warm front indicates that warm air is advancing and rising up over the colder air. This is because the warm air is ‘lighter’ or less dense, than the cold air. Therefore warm fronts occur where warmer air is replacing cooler air at the surface. As the warm front approaches there is a gradual deterioration in the weather. Clouds gradually lower from higher cirrus, through altostratus, to stratus and nimbostratus at the front. There is often a prolonged spell of rainfall which is often heavy. Behind the warm front the rain becomes lighter, turns to drizzle or ceases, but it remains cloudy. 

 Temperatures rise behind the warm front and winds turn clockwise, also known as a wind ‘veer’. 

Pressure falls steadily ahead of and during the passage of the warm front, but then rises slowly after its passage. 

 The following diagram shows the formation of a warm front in diagrammatic form.

PART B – FRONTS A front is a boundary between two different types of air masses, these are normally warm moist air masses from the tropics and cooler drier air masses from polar regions. Fronts move with the wind so over the UK they normally move from west to east. The notes below provide information about the most common types of fronts. The descriptions given apply to active well developed fronts, weaker fronts may not display all the characteristics or they may be less well defined. Warm Fronts A warm front indicates that warm air is advancing and rising up over the colder air. This is because the warm air is ‘lighter’ or less dense, than the cold air. Therefore warm fronts occur where warmer air is replacing cooler air at the surface. As the warm front approaches there is a gradual deterioration in the weather. Clouds gradually lower from higher cirrus, through altostratus, to stratus and nimbostratus at the front. There is often a prolonged spell of rainfall which is often heavy. Behind the warm front the rain becomes lighter, turns to drizzle or ceases, but it remains cloudy. Temperatures rise behind the warm front and winds turn clockwise, also known as a wind ‘veer’. Pressure falls steadily ahead of and during the passage of the warm front, but then rises slowly after its passage. The following diagram shows the formation of a warm front in diagrammatic form.

The following diagram shows a cross section through a warm front, with associated cloud, temperature and weather changes.

warm front

Cold Fronts

A cold front indicates that cold air is advancing and pushing underneath warmer air at the surface. This occurs because the cold air is ‘heavier’ or denser than the warm air. Therefore cold fronts occur where cooler air is replacing warmer air at the surface. The passage of weather associated with a cold front is much shorter lived than that with a warm front. As there is often a lot of cloud in the warmer air ahead of the cold front, there is often little indication of the approaching cold front. 

As the front passes temperatures fall and there is often a short spell of very heavy rain, sometimes with inbedded thunderstorms and cumulonimbus clouds. Behind the front the weather is much brighter with broken clouds but occasional showers. Winds veer with the passage of the cold front and are often strong and gusty, especially near showers. 

Pressure rises throughout the approach and passage of the cold front. 

The following diagram shows the formation of a cold front in diagrammatic form.

anticyclones_depressions_fronts_3

The following diagram shows a cross section through a cold front, with associated cloud, temperature and weather changes.

cold front

Occlusions

In a mature depression the warm front normally precedes the cold front. Cold fronts generally travel much quicker than warm fronts, and eventually it will catch up with the warm front.

Where the two fronts meet, warm air is lifted from the surface and an occlusion is formed. An occlusion can be thought of as having similar characteristics to both warm and cold fronts.

The weather ahead of an occlusion is similar to that ahead of a warm front, whilst the weather behind is similar to that behind a cold front.

The following diagrams depict the formation of an occlusion.

anticyclones_depressions_fronts_5
anticyclones_depressions_fronts_6

What to do next:

You can now move on to Part C – Life Cycle of a Depression.

PART C – LIFE CYCLE OF A DEPRESSION

A Norwegian scientist called Vilhelm Bjerknes devised a simple model which described how depressions developed from the meeting of warm and cold air. The model had four stages which are detailed below.

Origin and Infancy

Initially a warm air mass such as one from the tropics, meets a cooler air mass, such as one from the polar regions. Depressions which affect the UK normally originate over the Atlantic Ocean.

anticyclones depressions

Maturity

The warm air rises up over the colder air which is sinking. A warm sector develops between the warm and cold fronts. The mature stage of a depression often occurs over the UK.

anticyclones depressions fronts

Occlusion

The cold front travels at around 40 to 50 miles per hour, compared to the warm front which travels at only 20 to 30 miles per hour. Therefore the cold front eventually catches up with the warm front. When this occurs an occlusion is formed.

anticyclones depressions fronts

Death

Eventually the frontal system dies as all the warm air has been pushed up from the surface and all that remains is cold air. The occlusion dies out as temperatures are similar on both sides. This stage normally occurs over Europe or Scandinavia.

What to do next
You can now move on to Part D – Depression cross-section and weather sequence

PART D – DEPRESSION CROSS SECTION AND WEATHER SEQUENCE

Cross-section through a Classic Depression

Most depressions have a warm and cold front, more mature depressions may also have an occluded front. The diagram below shows a cross-section through a depression, showing the warm and cold fronts and an indication of the associated weather.

cross section through a depression

table

What to do next

Using this information on the passage of depressions you should now be able to complete worksheet 3 and worksheet 4.

Web page reproduced with the kind permission of the Met Office