Understanding weather
Air masses
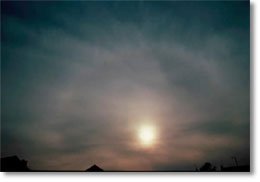
Atmosphere
Clouds
El Niño and La Niña
High pressure or anticyclone
Low pressure or depression
Temperature differences
Weather fronts
Weather systems
Wind
Air masses
Air masses are parcels of air that bring distinctive weather features to the country. An air mass is a body or ‘mass’ of air in which changes in temperature and humidity within them are relatively slight. That is to say the air making up the mass is very uniform. in temperature and humidity.
An air mass is separated from an adjacent body of air by a weather front. An air mass may cover several millions of square kilometres and extend vertically throughout the troposphere.
Atmosphere
A thin layer of mixed gases which covers the Earth and helps it from becoming too hot or too cold. Its circulation, the heat (terrestrial radiation) and light (solar radiation) which pass through it, and the processes which go on in it, all affect the climate. The atmosphere is about 800 km (500 miles) deep and is made up of 21% oxygen, 78% nitrogen, 0.037% carbon dioxide, and other gases including hydrogen, helium, neon, argon, krypton, xenon, and water vapour.

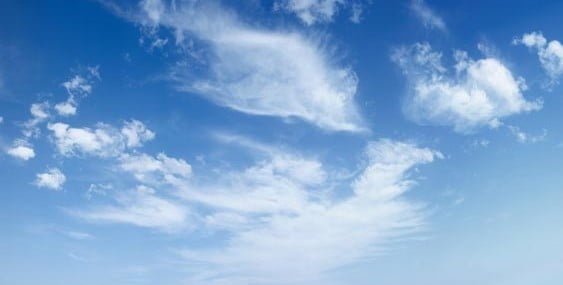
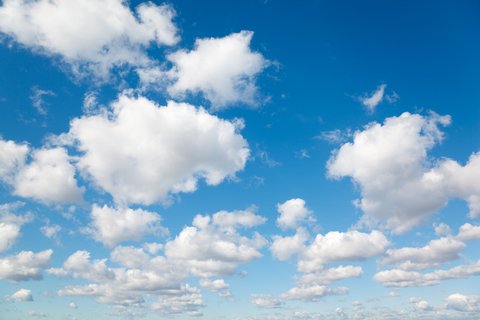
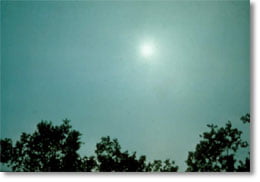
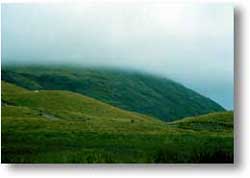
Clouds
A classification of clouds was introduced by Luke Howard (1772-1864) who used Latin words to describe their characteristics.
- Cirrus – a tuft or filament (e.g. of hair)
- Cumulus – a heap or pile
- Stratus – a layer
- Nimbus – rain bearing
There are now ten basic cloud types with names based on combinations of these words (the word ‘alto’, meaning high but now used to denote medium-level cloud, is also used).
Clouds form when moist air is cooled to such an extent it becomes saturated. The main mechanism for cooling air is to force it to rise. As air rises it expands – because the pressure decreases with height in the atmosphere – and this causes it to cool. Eventually it may become saturated and the water vapour then condenses into tiny water droplets, similar in size to those found in fog, and forms cloud. If the temperature falls below about minus 20 °C, many of the cloud droplets will have frozen so that the cloud is mainly composed of ice crystals.
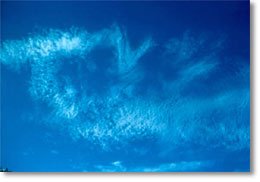
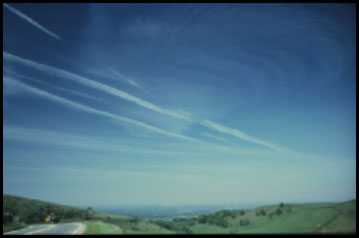
The ten main types of cloud can be separated into three broad categories according to the height of their base above the ground: high clouds, medium clouds and low clouds.
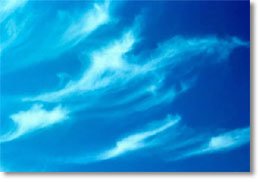
High clouds are usually composed solely of ice crystals and have a base between 18,000 and 45,000 feet (5,500 and 14,000 metres).
- Cirrus – white filaments
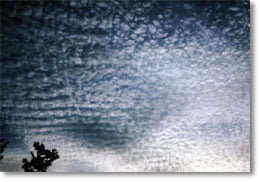
- Cirrocumulus – small rippled elements
- Cirrostratus – transparent sheet, often with a halo
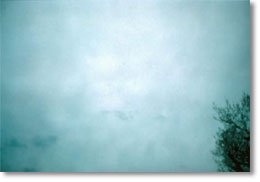
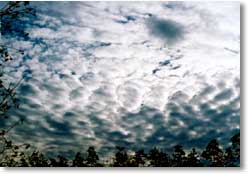
Medium clouds are usually composed of water droplets or a mixture of water droplets and ice crystals, and have a base between 6,500 and 18,000 feet (2,000 and 5,500 metres).
- Altocumulus – layered, rippled elements, generally white with some shading
- Altostratus – thin layer, grey, allows sun to appear as if through ground glass
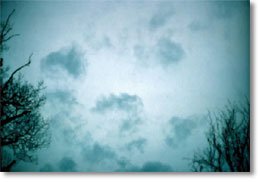
- Nimbostratus – thick layer, low base, dark. Rain or snow falling from it may sometimes be heavy
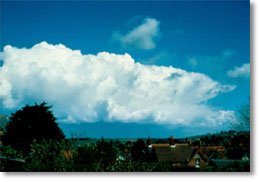
Low clouds are usually composed of water droplets — though cumulonimbus clouds include ice crystals – and have a base below 6,500 feet (2,000 metres).
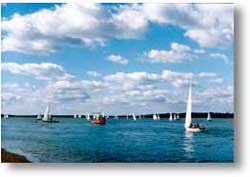
- Stratocumulus – layered, series of rounded rolls, generally white with some shading
- Stratus – layered, uniform base, grey
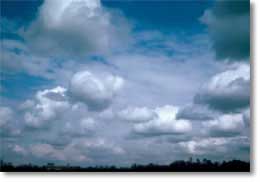
- Cumulus – individual cells, vertical rolls or towers, flat base
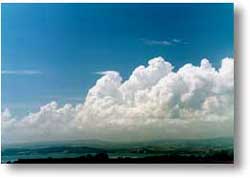
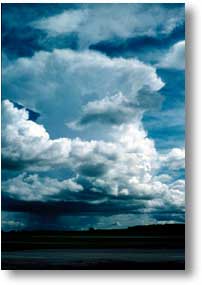
- Cumulonimbus – large cauliflower-shaped towers, often ‘anvil tops’, sometimes giving thunderstorms or showers of rain or snow
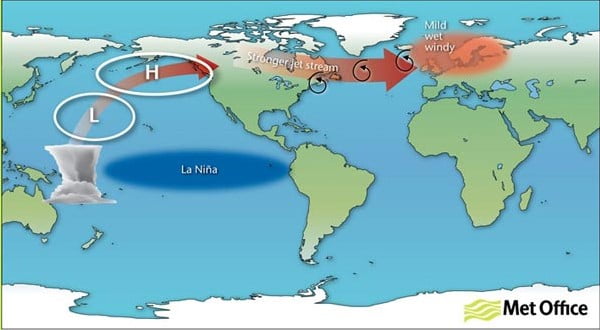
El Niño and La Niña
The tropical Pacific Ocean has a warming and cooling cycle. This cycle is a completely natural event and usually lasts between three to seven years. When the waters become warmer it is called El Niño, and when they become cooler it is called La Niña. During the cycle, the temperature of the ocean can change by around 3 °C between the warmest and coolest times.
Fishermen off the South American coast have known about this natural event for hundreds of years. When it happens, they see a huge fall in the numbers of fish caught. But scientists are only just beginning to understand how the event affects Earth’s weather and climate.
High pressure or anticyclone
In an anticyclone (also referred to as a ‘high’) the winds tend to be light and blow in a clockwise direction. Also the air is descending, which inhibits the formation of cloud. The light winds and clear skies can lead to overnight fog or frost. If an anticyclone persists over northern Europe in winter, then much of the British Isles can be affected by very cold east winds from Siberia. However, in summer an anticyclone in the vicinity of the British Isles often brings fine, warm weather.
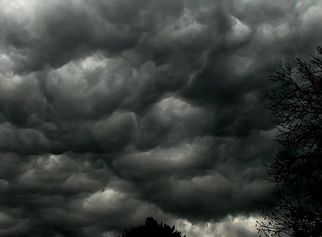
Low pressure or depression
In a depression (also referred to as a ‘low’), air is rising. As it rises and cools, water vapour condenses to form clouds and perhaps precipitation. Consequently, the weather in a depression is often cloudy, wet and windy (with winds blowing in an anticlockwise direction around the depression). There are usually frontal systems associated with depressions.
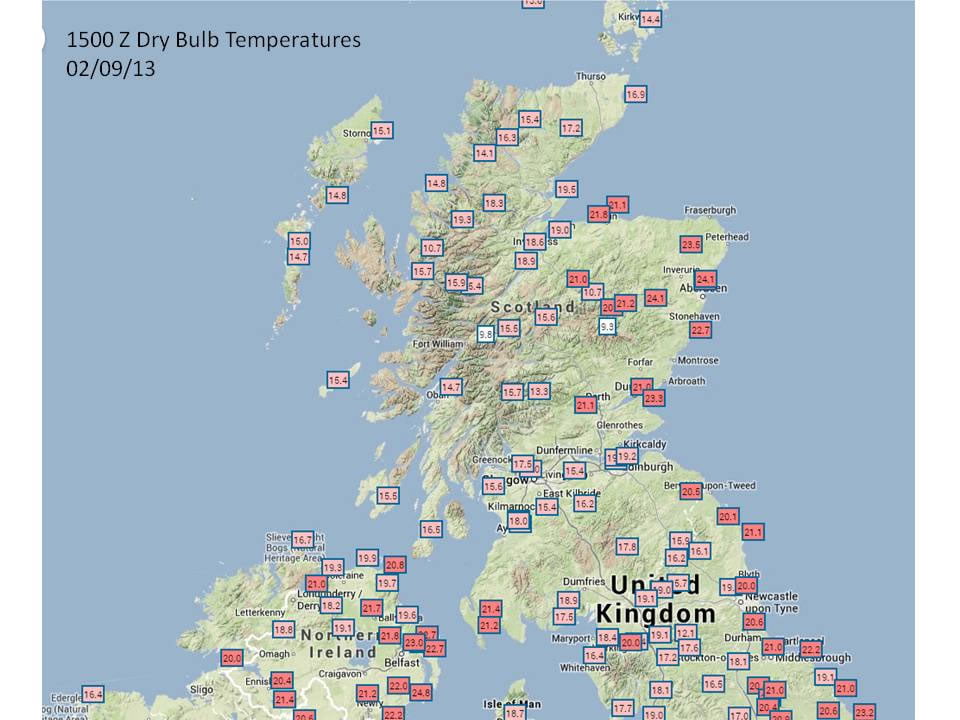
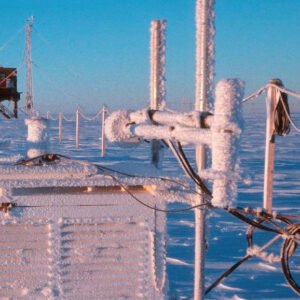
Temperature differences
Temperature affects other weather elements including air pressure, cloud formation, humidity and precipitation.
Factors affecting temperature:
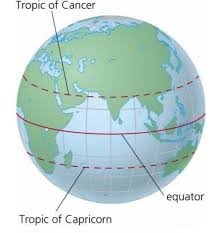
- Latitude – warmer closer to the equator and cooler moving away towards the poles
- Altitude – getting colder as the land gets higher
- Distance from the sea – temperatures inland are higher than the coast during the summer and lower than the coast during winter. This is because land heats up and cools down more quickly than the sea
- North-facing slopes in the southern hemisphere and south-facing slopes in the northern hemisphere receive more sunlight than the opposite slopes and are warmer
- Wind – generally makes the air feel cooler
Weather fronts
A weather front is simply the boundary between two air masses.
There are three different types of weather front. These are:
- Cold front
- Warm front
- Occluded front (also called an occlusion)
Cold front
This is the boundary between warm air and cold air and is indicative of cold air replacing warm air at a point on the Earth’s surface
On a synoptic chart a cold front appears blue

The presence of a cold front means cold air is advancing and pushing underneath warmer air. This is because the cold air is ‘heavier’ or denser, than the warmer air. Cold air is thus replacing warm air at the surface. The symbols on the front indicate the direction the front is moving.
The passage of a cold front is normally marked at the earth’s surface by a rise of pressure, a fall of temperature and dew-point, and a veer of wind (in the northern hemisphere). Rain occurs in association with most cold fronts and may extend some 100 to 200 km ahead of or behind the front. Some cold fronts give only a shower at the front, while others give no precipitation. Thunder may occur at a cold front.
Warm front
This is the boundary between cold air and warm air and is indicative of warm air replacing cold air at a point on the Earth’s surface
On a synoptic chart a warm front appears red

The presence of a warm front means warm air is advancing and rising up over cold air. This is because the warm air is ‘lighter’ or less dense, than the colder air. Warm air is thus replacing cold air at the surface. The symbols on the front indicate the direction the front is moving.
As a warm front approaches, temperature and dew-point within the cold air gradually rise and pressure falls at an increasing rate. Precipitation usually occurs within a wide belt some 400 km in advance of the front. Passage of the front is usually marked by a steadying of the barometer, a jump in temperature and dew-point, a veer of wind (in the northern hemisphere), and a cessation or near cessation of precipitation.
Occluded front
These are more complex than cold or warm fronts. An occlusion is formed when a cold front catches up with a warm front
When a cold front catches up with a warm front the warm air in the warm sector is forced up from the surface
On a synoptic chart an occluded front appears purple

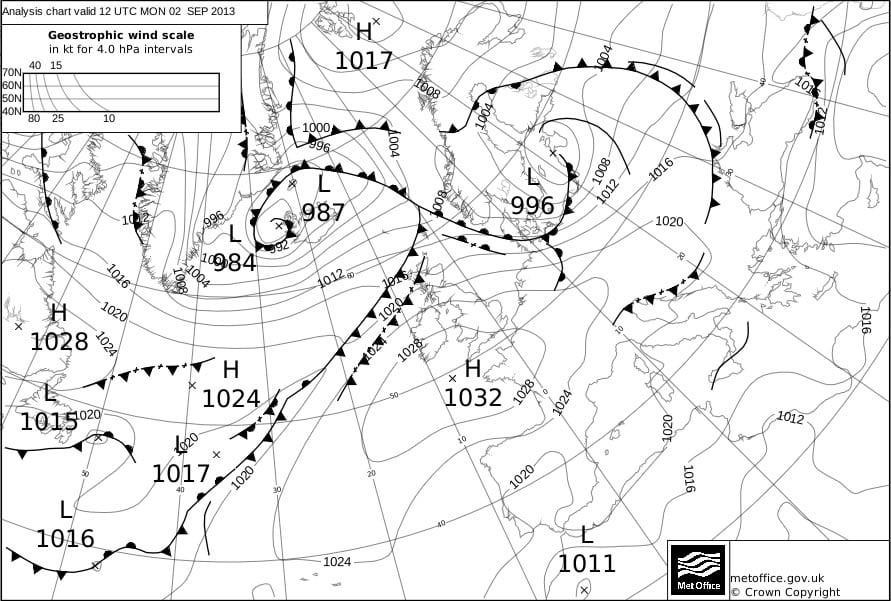
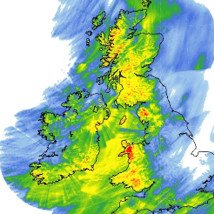
Weather systems
Weather can change on a daily basis especially at middle to high latitudes where it is controlled by weather systems, depressions and anticyclones.
On a weather chart, lines joining places with equal sea-level pressures are called isobars. Charts showing isobars are useful because they identify features such as anticyclones (areas of high pressure), depressions (areas of low pressure), troughs and ridges which are associated with particular kinds of weather.
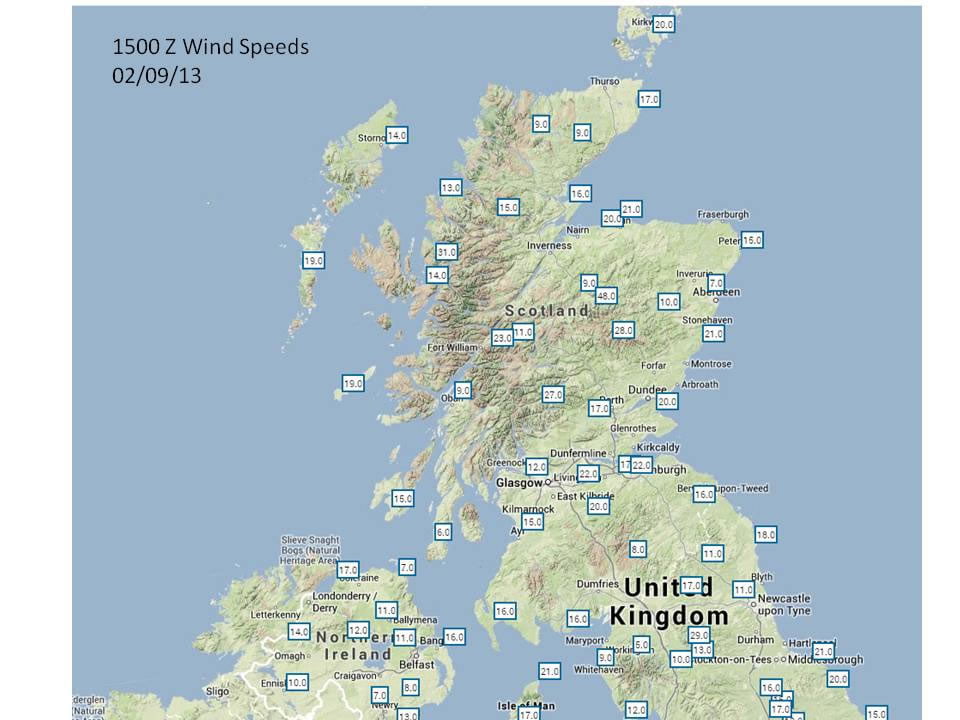
Wind
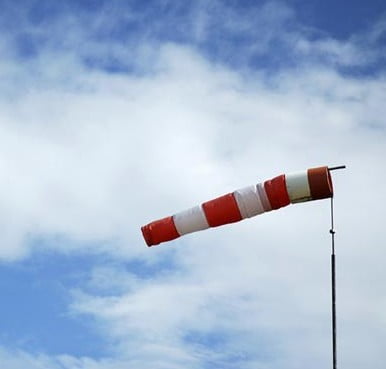
The movement of air around the earth from high pressure to low pressure is what brings about winds. The direction given for the wind refers to the direction from which it comes. For example, a westerly wind is blowing from the west towards the east.
Measurements of wind strength are made at 10 metres (33 feet) above the ground. A specified height has to be used because the wind speed decreases towards the ground. In this country winds are measured in knots (nautical miles per hour). However, forecast winds are often given in miles per hour (where 1 knot is equivalent to 1.15 mph) or in terms of the Beaufort Scale.
There are rapid variations in the wind – these are referred to as gusts. Gusts are higher inland than over the sea or windward coasts, although the mean wind speeds tend to be lower inland. Typically, gusts can be 60% higher than the mean speed, although in the middle of cities this can reach 100%. Northerly winds tend to be gustier than southerly ones. In general, the weather is strongly influenced by the wind direction, so information about the wind provides an indication of the type of weather likely to be experienced.
- Northerly winds tend to bring relatively cold air from polar regions to the British Isles. Similarly, southerly winds tend to bring relatively warm air from the tropics
- As cold polar air moves southwards over an increasingly warm sea, the heating of the air by the sea causes cumulus clouds to form. These clouds may grow sufficiently for showers to develop and, consequently, winds from the north-west, north or north-east usually bring cold, showery weather to the British Isles
- Warm air from the tropics moving northwards over the sea is cooled from below. Sometimes the cooling is sufficient for sea fog or a thin layer of stratus to form. The cloud can become thick enough for drizzle, especially on windward coasts and over high ground. In general, winds from the west or south-west are associated with overcast, wet weather
- Winds from the south and south-east mainly occur in summer and these bring warm, dry weather. However, southerly winds can sometimes bring hot, thundery weather
- Easterly winds in winter bring very cold air to the British Isles. The characteristics and path of the air determine whether it is cloudy (with perhaps rain, sleet or snow) or fine and sunny. In summer, an easterly wind will mean it is cool on the east coast but warm elsewhere, usually with clear skies
Web page reproduced with the kind permission of the Met Office


 One of these is lightning, though the possibility of its occurrence may be indicated indirectly in a forecast or station report as ‘thundery showers’. In fact, lightning is not such a risk to sailors as it might at first appear. Boats are surrounded by a very good conductor of electricity – water – and unless the boat suffers a direct hit, which is unlikely, the current is dissipated much more quickly than on land.